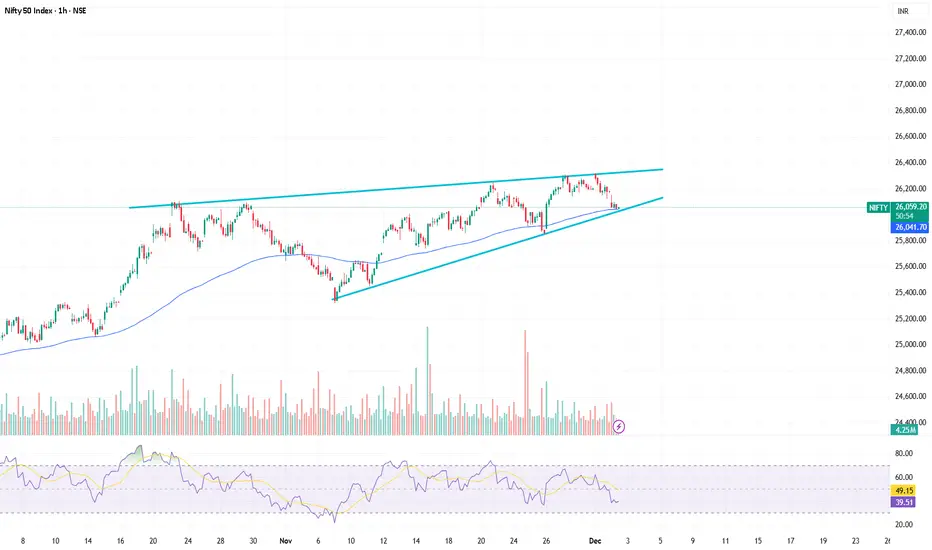
NIfty Hourly Strong SupportHello Friends,
Nifty Spot at 26050-60 having support of EMA100 along with trendline support and RSI oversold in hourly ......Overall Momentum is Bullish this is good DIP expceting 26400,26500,26700+ in coming few sessions
Niftyoptionstrategy
SENSEX INTRADAY LEVELS ( EDUCATIONAL PURPOSE ) 09/07/2025🔹 SENSEX Intraday Trade Plan – 9 July
📊 Analysis: 15-min TF | Execution: 1-min TF
🔵 GAP-UP Opening (Above 83,750)
📌 Plan: Avoid chasing the gap. Look for reversal or a retest
🔁 Entry: Sell below 5-min breakdown or rejection from 83,750–83,800
🛑 SL: 25–30 pts above high
🎯 Target: 83,580 – 83,500
🔻 GAP-DOWN Opening (Below 83,400)
📌 Plan: Avoid panic selling. Wait for price to reclaim or reversal
🔁 Entry: Buy above 5-min high after reclaim or strong bullish candle
🛑 SL: 25–30 pts below low
🎯 Target: 83,600 – 83,750
📏 NORMAL OPEN (Between 83,400–83,750)
🔁 Range Play Setup:
Buy near 83,400–450 (support zone)
Sell near 83,700–750 (resistance zone)
🛑 SL: 20–30 pts beyond level
🎯 Target: 50–70 pts
🚀 Breakout Trade Setup
🔁 Entry: Above 83,800 breakout candle
🛑 SL: Below breakout bar
🎯 Target: 83,900 – 84,000
🔁 Breakdown Trade Setup
🔁 Entry: Below 83,350 breakdown candle
🛑 SL: Above breakdown bar
🎯 Target: 83,200 – 83,100
📌 Note: Stick to risk management. Avoid overtrading in sideways zone. Use confirmation on 1-min candle before entry.

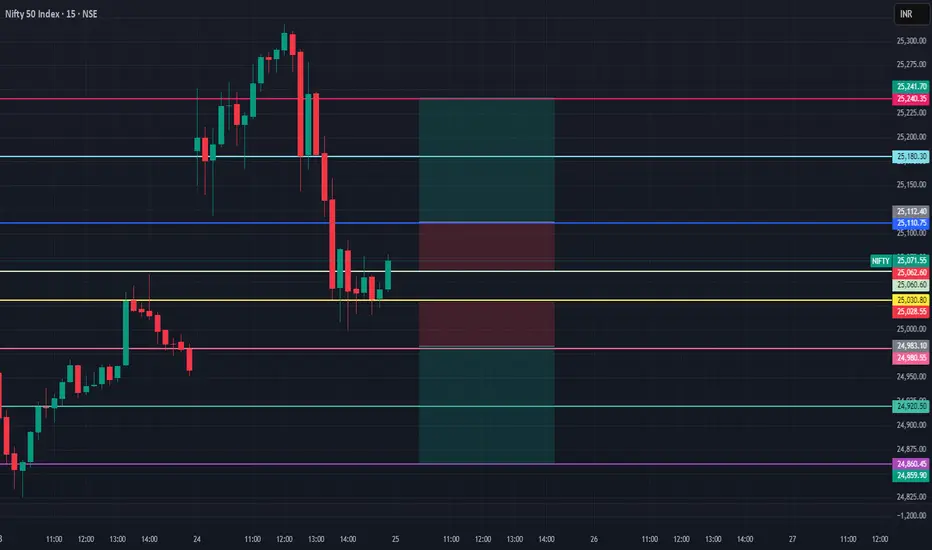
NIFTY Levels For Intraday ( Educational Purpose) 25/06/2025📊 Nifty Intraday Strategy – 25.06.2025
🔎 Structure: 15-min | Execution: 1-min
🔼 Buy Above: 25,110
🎯 Target: 25,180 / 25,240
🛑 SL: 25,060
🔽 Sell Below: 24,980
🎯 Target: 24,920 / 24,860
🛑 SL: 25,030
📈 Gap-Up Opening:
▪️ Wait near 25,180–25,240 zone
▪️ Avoid long entries until rejection or breakout confirmation (1-min + volume)
📉 Gap-Down Opening:
▪️ Watch 24,900–24,860 for reversal
▪️ Go long only after bullish engulfing / strong 1-min candle with volume
⚠️ Do’s & Don’ts:
✅ Use 1-min for trigger after breakout
❌ Don’t jump in first 5 mins
✅ Maintain 1:2 risk-reward
🚫 Avoid trading during news spike
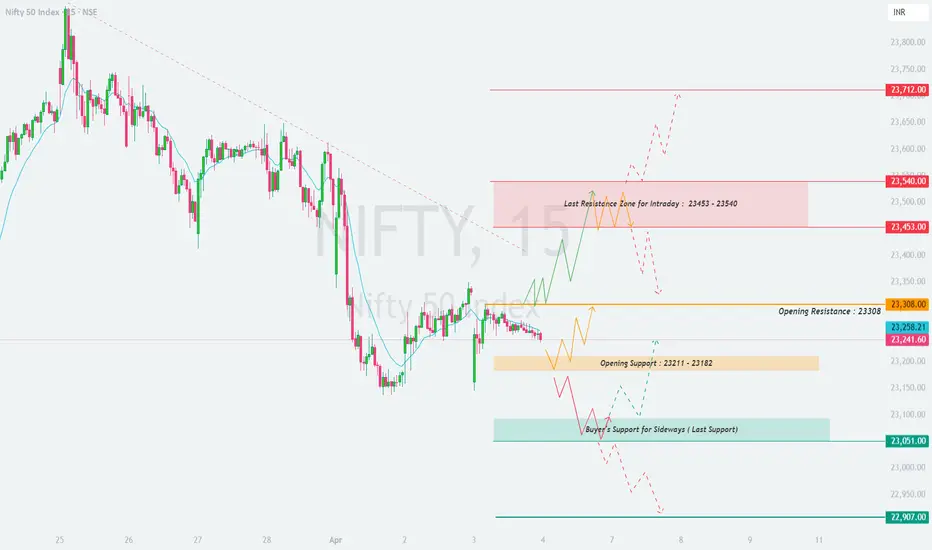
NIFTY : Intraday Trading Levels and Plan for 04-Apr-2025📌 NIFTY Trading Plan – 04-Apr-2025
📊 Market Overview:
Nifty closed at 23,241.60, showing signs of consolidation around a key support zone. The opening resistance at 23,308 and opening support at 23,211 – 23,182 will be crucial in determining the day's trend.
To navigate this session effectively, we will analyze all potential market opening scenarios and provide an actionable trading strategy.
🔼 Scenario 1: Gap-Up Opening (100+ points above 23,308)
A gap-up above 23,308 signals bullish momentum, but the intraday resistance zone of 23,453 – 23,540 will determine if the rally continues.
✅ Plan of Action:
If Nifty sustains above 23,308, expect a move towards 23,453 → 23,540. A breakout above 23,540 could trigger further buying towards 23,712.
If Nifty faces rejection at 23,453 – 23,540, expect a pullback towards 23,308, where it may either bounce or break down.
Avoid aggressive long positions near 23,540 unless a strong breakout with volume occurs.
🎯 Pro Tip: If the gap-up struggles to hold 23,308 in the first 15 minutes, profit booking may follow, leading to consolidation or a dip.
⚖ Scenario 2: Flat Opening (Within ±100 points, around 23,241)
A flat opening suggests indecision, where price action around the opening support (23,211 – 23,182) and resistance (23,308) will set the trend.
✅ Plan of Action:
Upside case: If Nifty sustains above 23,308, expect a test of 23,453 – 23,540.
Downside case: If Nifty slips below 23,211, it could test 23,182, followed by 23,051 (last buyer’s support zone).
No Trade Zone: Avoid trading inside 23,211 – 23,308 unless a strong breakout or breakdown occurs.
🎯 Pro Tip: Wait for a strong 15-minute candle close outside the range before initiating a trade to avoid false breakouts.
🔽 Scenario 3: Gap-Down Opening (100+ points below 23,182)
A gap-down below 23,182 indicates bearish sentiment, with key support at 23,051 being the last buyer’s zone.
✅ Plan of Action:
If Nifty sustains below 23,182, expect a decline towards 23,051. A breakdown below 23,051 could push the index towards 22,907.
If Nifty finds support at 23,051 and rebounds, look for a possible recovery towards 23,182 → 23,211.
Avoid panic shorting on a gap-down open; wait for confirmation before entering trades.
🎯 Pro Tip: A gap-down near a strong support zone could trigger a short-covering bounce. Wait for a reversal signal before taking long positions.
⚠️ Risk Management Tips for Options Traders
🛑 Avoid Over-leveraging – Stick to defined risk per trade and avoid emotional trading.
⌛ Theta Decay Awareness – If the market remains sideways, option premiums will erode rapidly.
🔄 Use Spreads for Risk Control – Consider hedged positions like Bull Call or Bear Put spreads instead of naked options.
📊 Trade at Key Levels – Avoid random trades; focus on high-probability setups.
📌 Summary & Conclusion
📍 Key Levels to Watch:
🟥 Resistance: 23,308 → 23,453 → 23,540 → 23,712
🟧 Opening Support/Resistance Zone: 23,211 – 23,182
🟩 Support: 23,051 → 22,907
🔸 Bullish Bias: Above 23,308, targeting 23,453 – 23,540
🔸 Bearish Bias: Below 23,182, expecting a drop towards 23,051 – 22,907
🔸 Neutral/Choppy: Inside 23,211 – 23,308, wait for a breakout
🎯 Final Advice:
Stick to the trading plan and execute trades only at key levels.
The first 15-30 minutes will define market sentiment—observe price action carefully.
Risk management is crucial—never risk more than you can afford to lose.
📢 Disclaimer
I am not a SEBI-registered analyst. This trading plan is for educational purposes only. Please conduct your own research or consult a financial advisor before making any trades.
🚀 Stay updated with real-time trade setups!
Nifty key levels for 22.01.2025Nifty key levels for 22.01.2025
If Nifty breaks the upper or lower range, we can expect momentum. The consolidation zone will be favorable for option sellers, while a breakout on either side will benefit option buyers.
Disclaimer:
I'm not a SEBI Registered financial advisor. These views are purely educational in nature. You are solely responsible for any decisions made based on this research.

Nifty key levels for 15.01.2025Nifty key levels for 15.01.2025
If Nifty breaks the upper or lower range, we can expect momentum. The consolidation zone will be favorable for option sellers, while a breakout on either side will benefit option buyers.
Disclaimer:
These views are purely educational in nature. You are solely responsible for any decisions made based on this research.

Nifty key levels for 14.01.2025Nifty key levels for 14.01.2025
If Nifty breaks the upper or lower range, we can expect momentum. The consolidation zone will be favorable for option sellers, while a breakout on either side will benefit option buyers.
Disclaimer:
These views are purely educational in nature. You are solely responsible for any decisions made based on this research.

Nifty key levels for 13.01.2025Nifty key levels for 13.01.2025
If Nifty breaks the upper or lower range, we can expect momentum. The consolidation zone will be favorable for option sellers, while a breakout on either side will benefit option buyers.
Disclaimer:
These views are purely educational in nature. You are solely responsible for any decisions made based on this research.

Nifty key levels for 10.01.2025Nifty key levels for 10.01.2025
If Nifty breaks the upper or lower range, we can expect momentum. The consolidation zone will be favorable for option sellers, while a breakout on either side will benefit option buyers.
Disclaimer:
These views are purely educational in nature. You are solely responsible for any decisions made based on this research.

Nifty key levels for 08.01.2025Nifty key levels for 08.01.2025
If Nifty breaks the upper or lower range, we can expect momentum. The consolidation zone will be favorable for option sellers, while a breakout on either side will benefit option buyers.
Disclaimer:
These views are purely educational in nature. You are solely responsible for any decisions made based on this research.

Nifty key levels for 07.01.2025Nifty key levels for 07.01.2025
If nifty breaks the upper or lower range we can expect the momentum. Consolidation zone will be favour to option sellers. Either side breakout will help option buyers.
Disclaimer:
Views are purely educational in nature. You are solely responsible for any decisions you take on basis of my research

Nifty weekly expiry analysis for 02/01/2025.Tomorrow is nifty first weekly expiry of the year.
A consolidation is going on in the index and today also it closed in a range.
If there is break out of the trendline on the upper side, chances of market retesting 24k levels are high.
In case of a fail and market trading downside, a trend downside possibilities are there.
20-EMA and 50-EMA are acting as a resistance and once cleared higher EMAs can be tested.
Option buyer be cautious of the expiry premium decay. Only trade the momentum.
Major levels
Upper resistance :- 24850, 24080
Lower support :- 23550, 23330.

BUY NIFTY 23700 CE 26TH DEC EXP @ 125 - 130 | NIFTY LONG TRADENIFTY 23700 CE 26TH DEC EXP
NIFTY OPTIONS BUYING TRADE
TIME FRAME RECOMMENDED TO TRACK TRADE: 5 MINS
Hi Traders,
Nifty is currently trading a support level, and we anticipate an upside movement from here towards 23,770 and 23,820. We recommend buying the 23,700 CE (Call Option) with a 26th December expiry in the price range of 125 – 130.
The target levels are 170 and 195, with a stop-loss set at 80.
Regards,
OptionsDaddy Research Team

Nifty Trading Strategy for 29th November 2024Nifty Trading Strategy
Current Level: Nifty at 23914
Long Position: Above the high of the 15-minute candle that closes above 24055
Short Position: Below the low of the 15-minute candle that closes below 23780
Support Levels: 23650, 23500
Resistance Levels: 24150, 24230
Disclaimer: I am not SEBI registered. Please consult with a certified financial advisor before making any trading decisions.

Nifty Trading Strategy for 28th November 2024Trade Strategy for Nifty
Current Market Condition: Nifty has been consolidating for the last three days. A breakout on either side is expected to result in a movement of 300 points.
Buy: Enter a long position when the price moves above 24260 on a 15-minute candle close.
Sell: Enter a short position when the price drops below 24120 on a 15-minute candle close.
Current Price: 24275
Support and Resistance Levels
Support Levels:
24120: This is the first line of defense where the price might find support and potentially reverse upwards.
24000: If the price falls below 24120, 24000 acts as the next significant support level.
23500: This is a major psychological level that could provide strong support.
Resistance Levels:
24260: The initial barrier where the price might encounter resistance and potentially reverse downwards.
24500: If the price breaks above 24260, 24500 becomes the next key resistance level.
25000: This is a significant resistance level that could pose a challenge for further upward movement.
Disclaimer
Please note that I am not a SEBI-registered advisor. Trading involves significant risk and it's important to do your own thorough research or consult with a professional financial advisor before making any investment decisions. The information provided here is for educational purposes only and should not be considered as financial advice. Always consider your risk tolerance and investment goals before engaging in trading activities.

Nifty Trading Strategy for 13th November 2024Nifty Trading Strategy: Buy Above 24,100 / Sell Below 23,800
Current Price: 23,884
Key Levels:
Buy Signal: If the price closes above 24,100 on the 15-minute candle, it indicates a potential upward trend, suggesting a good time to consider buying.
Sell Signal: If the price closes below 23,800 on the 15-minute candle, it suggests a potential downward trend, indicating it might be a good time to consider selling.
Market Analysis:
The current price is hovering around 23,884, just below the buy signal level.
It's important to monitor the price closely, especially around the 23,850 to 24,000 levels, which could act as support or resistance.
Recommendations:
Buy: If the price sustains above 24,100 on the 15-minute candle close, consider entering long positions. Book profit at regular intervals or use a trailing stop loss to protect your profit, with targets at 24,150 and 24,200.
Sell: If the price breaks below 23,800 on the 15-minute candle close, consider short positions. Book profit at regular intervals or use a trailing stop loss to protect your profit, with targets at 23,700 , 23600 and 23,350
Disclaimer: I am not SEBI registered. This is only for educational purposes. You may do your own analysis before taking any trading decisions.

Nifty Trading Strategy for 6th November 2024Nifty Trading Strategy: Buy Above 24,325 / Sell Below 24,150
Current Price: 24,214.00
Key Levels:
Buy Signal: If the price closes above 24,325 on the one-hour candle, it indicates a potential upward trend, suggesting a good time to consider buying.
Sell Signal: If the price closes below 24,150 on the one-hour candle, it suggests a potential downward trend, indicating it might be a good time to consider selling.
Market Analysis:
The current price is hovering around 24,214.00, just below the buy signal level.
The market is showing signs of bullish momentum, but it's important to monitor the price closely, especially around the 24,300 to 24,350 levels, which could act as resistance.
Recommendations:
Buy: If the price sustains above 24,325 on the one-hour candle close, consider entering long positions with targets at 24,500 and 24,600.
Sell: If the price breaks below 24,150 on the one-hour candle close, consider short positions with targets at 24,000 and 23,900.
Disclaimer: I am not SEBI registered. This is only for educational purposes. You may do your own analysis before taking any trading decisions.

Nifty Trading Strategy for 5th November 2024 Nifty Trading Strategy: Buy Above 24,110 / Sell Below 24,900
Current Price: 23,996.00
Key Levels:
Buy Signal: If the price closes above 24,110 on the one-hour candle, it indicates a potential upward trend, suggesting a good time to consider buying.
Sell Signal: If the price closes below 24,900 on the one-hour candle, it suggests a potential downward trend, indicating it might be a good time to consider selling.
Market Analysis:
The current price is hovering around 23,996.00, just below the buy signal level.
It's important to monitor the price closely, especially around the 24,200 to 24,250 levels, which could act as resistance.
Recommendations:
Buy: If the price sustains above 24,110 on the one-hour candle close, consider entering long positions with targets at 24,300 and 24,500.
Sell: If the price breaks below 24,900 on the one-hour candle close, consider short positions with targets at 24,700 and 24,600.
Disclaimer: I am not SEBI registered. This is only for educational purposes. You may do your own analysis before taking any trading decisions.

Nifty for 30.10.2024Trading Levels for Today (Based on 1-Hour Candle Close):
Buy Above 24,500: Enter a buy position if a 1-hour candle closes above 24,500. This could confirm a breakout and signal upward momentum. To manage risk, set a stop-loss in case of unexpected price reversals.
Sell Below 24,200: Enter a sell position if a 1-hour candle closes below 24,200. This may confirm a breakdown, indicating further downside potential. Set a stop-loss to protect against sudden price rebounds.
Disclaimer: I am not a SEBI-registered financial advisor. These levels are based on my personal trading approach for today, focusing on 1-hour candle close confirmations. Please perform your own analysis and consult with a certified professional before making any trading decisions.

Nifty for the week 16th sep to 20 sep 2024.Nifty is in uptrend as long as it above 24250.
Buy above 25435 or
if Nifty falls then wait for retracement or green candle above 24250 in one hour time frame and buy above the high of the green candle
Sell below the low of the candle which closes below 24250 in one hour time frame.
Disclaimer.
I am not a SEBI registered analyst. The above is only for Educational Purpose.

Nifty Intraday Levels | 30-AUG-2024#Optionbuyers
#Niftyoptionscalping
1️⃣ Zones you always Like:-
👉Green zone- Institutional support
👉Red zone - Institutional resistance
👉Gap between institutional zones is always of 100 points
👉Zone is created with the help of pivot points and Fibonacci
👉Advance version of price action
👉Trades based on Nifty future chart
2️⃣ Trade Execution:-
👉Trade based on order flow data
👉Timeframe - 1 min and 5 min
👉Risk Reward Ratio always 1:2
👉Strike price always ATM & slightly ITM
👉Maintain Position sizing according to your own method
3️⃣ House Rules in trading:-
👉Sharp at 9:15 AM
👉Priority to risk management
👉Fast execution (morning breakfast)
👉Stop-loss 10 points (strictly)
#ThankU For Checking Out Our IDEA , We Hope U Liked IT 📌
🙏FOLLOW for more !
👍LIKE if useful !
✍️COMMENT Below your view !

#BUDGET2024 NIFTY POV 24/07/2024Well, today's market opening has a gap up in Nifty. Also, all markets will be opening with GUP-UP. So, come to the point I think the market may be going to the downside because of the weak sustainability. the reason for weak sustainability is the big players manipulate the retail buyers or this recovery shows the interest of retail buyers in the bullish view because of this the FII/DII make the big moves where the retailers lose their money in the market sentiments.
L E V E L S:-
SUPPORT:-24300 24100
RESISTANCE:-24600

#NIFTY B R E A K D O W N LEVELS 18/07/2024Price is consolidating in the form of a channel and the movement is in zig zag manner. Now price is at the support of the lower trend line. the market is unpredictable so trade carefully big players try to trap retail buyers and make them foolish be careful because the is in a sideways situation before the budget is announced to ensure your trade is profitable or otherwise don't be traded if not make opportunities 100% guarantee.
L E V E L S:-
Support-24400
Resistance-24700-24800
