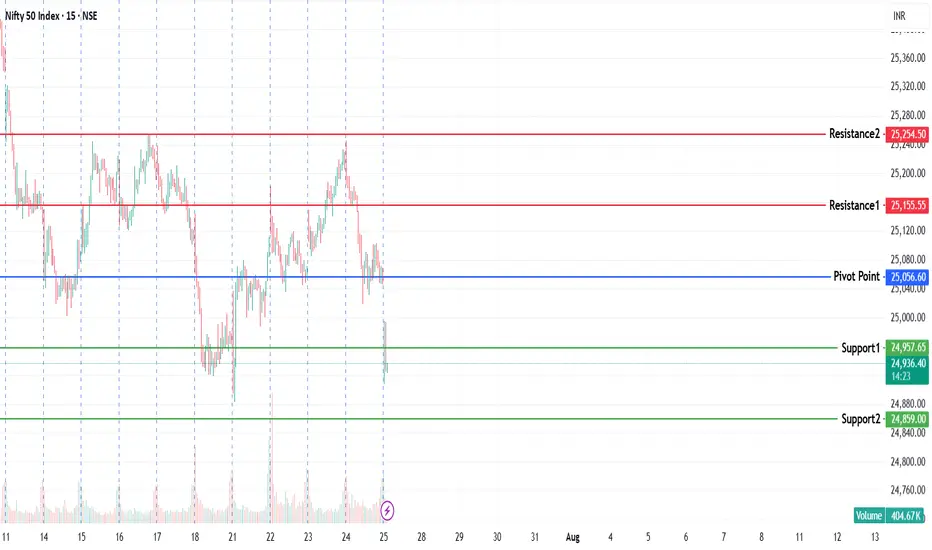
NIFTY KEY LEVELS FOR 28.11.2025NIFTY KEY LEVELS FOR 28.11.2025
Timeframe: 3 Minutes
If the candle stays above the pivot point, it is considered a bullish bias; if it remains below, it indicates a bearish bias. Price may reverse near Resistance 1 or Support 1. If it moves further, the next potential reversal zone is near Resistance 2 or Support 2. If these levels are also broken, we can expect the trend.
When a support or resistance level is broken, it often reverses its role; a broken resistance becomes the new support, and a broken support becomes the new resistance.
If the range(R2-S2) is narrow, the market may become volatile or trend strongly. If the range is wide, the market is more likely to remain sideways
please like and share my idea if you find it helpful
📢 Disclaimer
I am not a SEBI-registered financial adviser.
The information, views, and ideas shared here are purely for educational and informational purposes only. They are not intended as investment advice or a recommendation to buy, sell, or hold any financial instruments.
Please consult with your SEBI-registered financial advisor before making any trading or investment decisions.
Trading and investing in the stock market involves risk, and you should do your own research and analysis. You are solely responsible for any decisions made based on this research.
Niftypredictions

NIFTY KEY LEVELS FOR 25.07.2025NIFTY KEY LEVELS FOR 25.07.2025
If the candle stays above the pivot point, it is considered a bullish bias; if it remains below, it indicates a bearish bias. Price may reverse near Resistance 1 or Support 1. If it moves further, the next potential reversal zone is near Resistance 2 or Support 2. If these levels are also broken, we can expect the trend.
If the range is narrow, the market may become volatile or trend strongly. If the range is wide, the market is more likely to remain sideways
📢 Disclaimer
I am not a SEBI-registered financial adviser.
The information, views, and ideas shared here are purely for educational and informational purposes only. They are not intended as investment advice or a recommendation to buy, sell, or hold any financial instruments.
Please consult with your SEBI-registered financial advisor before making any trading or investment decisions.
Trading and investing in the stock market involves risk, and you should do your own research and analysis. You are solely responsible for any decisions made based on this research.
NIFTY Index Intraday Levels(For Educational purpose) 23/05/2025📈 Nifty Intraday Trade Setup – 23/06/2025 (Monday)
🕒 Timeframe: 1-Min Chart
📊 Market Outlook: Volatile with directional bias
🔼 Buy Above: 25,150 (with strong volume)
🎯 Target 1: 25,220
🎯 Target 2: 25,300
🛑 Stop Loss: 25,070
⚠️ Entry only after 5-min candle closes above 25,150
🔽 Sell Below: 24,960 (on breakdown)
🎯 Target 1: 24,880
🎯 Target 2: 24,800
🛑 Stop Loss: 25,040
⚠️ Only if price fails to hold 25,000 zone
📍 Key Levels to Watch:
🔹 Resistance: 25,150
🔹 S/R Flip Zone: 25,000 – 25,040
🔹 Support: 24,880 – 24,800
🔹 Demand Zone: 24,680
📌 Pro Tips:
✅ Watch opening 15 mins carefully
✅ Use VWAP & EMA (20/50) for trend confirmation
✅ Trade with discipline, not emotion

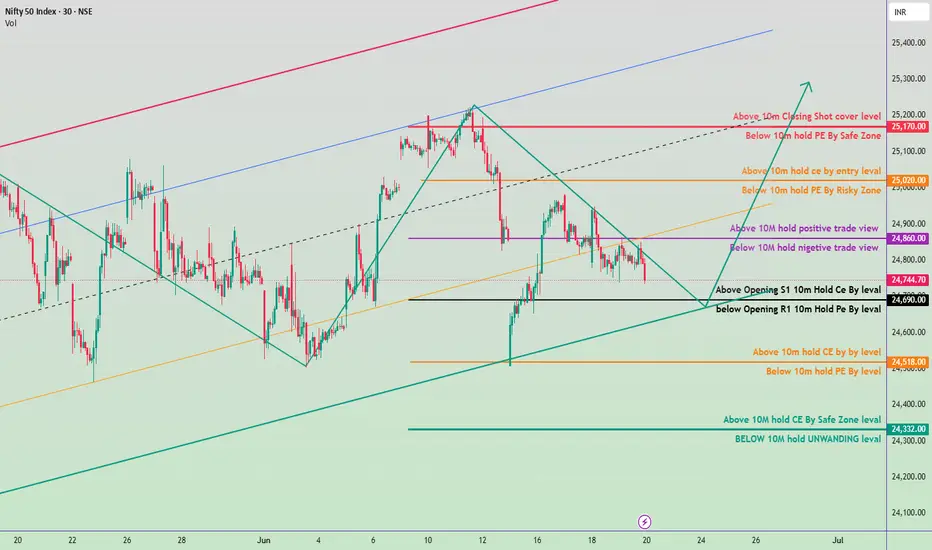
20June Nifty 50 breakdown and brekout levals🟢 Bullish Zones (CE - Call Buyers Support):
Above 25,000 – Entry level for CE
If Nifty sustains above this level, expect aggressive buying.
Target: 25,170 (Safe Zone), then 25,200 (Closing Shot Cover)
24,860 – Positive trade view
Holding above this gives bullish bias; CE can be held with confidence.
Indicates momentum shift toward buyers.
24,744 – Intraday CE Holding Level
Sustaining above this from open = potential move toward 24,860+
24,690 – Opening Support
Above this level for 10 mins = safe for CE traders.
24,518 – Minor CE Holding Zone
CE can be re-entered with small SL.
24,332 – Strong CE Safe Zone
Major support for positional bulls.
🔴 Bearish Zones (PE - Put Buyers Support):
Below 25,000 – Risky Zone for PE
PE entry starts once price fails to sustain above 25k.
Below 24,860 – Negative view
Falling below this adds bearish pressure.
Below 24,690 – Weakness
PE holding possible if sustained below 10 mins.
Below 24,518 – Confirmed PE zone
Can see acceleration downwards.
Below 24,332 – Strong PE momentum
Major breakdown area.
Below 10m Candle UNWINDING Zone – Around 24,200
Heavy PE buyers may dominate below this.
✅ Summary Trade Plan:
Bullish Above: 24,518 →24,720 → 24,860 → 25,000 → 25,170+
Bearish Below: 25,000 →24,860 →24,690 → 24,518 → 24,332
Nifty - Intraday levels & Prediction for - 18 Jun 2025Nifty Prediction for Tomorrow:
Trend : BEARISH Breakout
Sentiment : Negative
Expectation : Nifty closed below 24900, expecting BEARISH breakout tomorrow. Any close above 2510 only its Bullish trend, and price will move to test 25200.
Look for Buy/Sell at Demand and Supply zone for profitable trades.
Demand and Supply Zones - When price breaks the zone, Demand zone will become Resistance and Supply zone will become Support. If Nifty Sustains above 24900 tomorrow we can see good rally upto 25080 Resistance. Any breakout above 25100 and next resistance 25200
Refer the chart for detailed Intraday Support and Resistance levels.
nifty analysismay be nifty will positive in this month from monday. nifty next target is ATH. after that i aspecting a fake breakout . then nifty will fall upto 24100- 24000 levels . we see 24000 levels in the month of september.

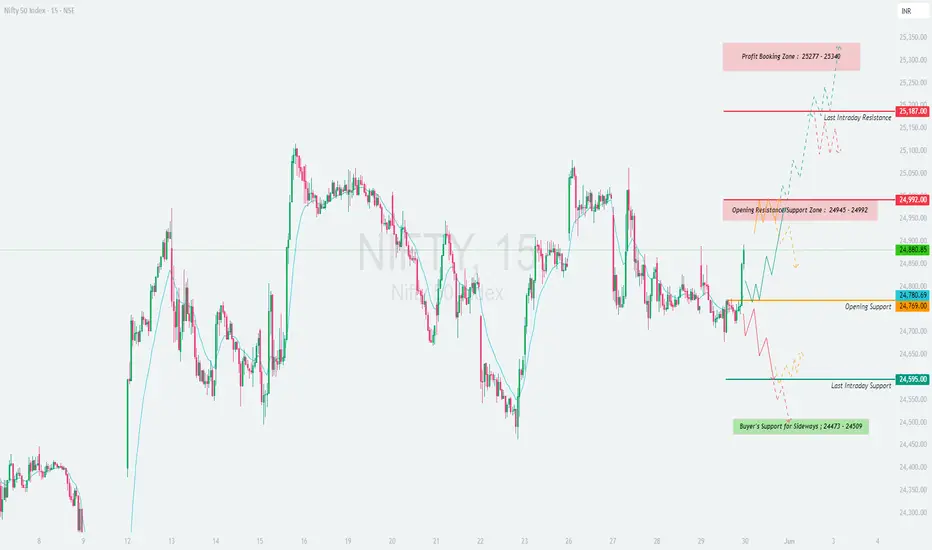
NIFTY : Trading Levels and Plan for 30-May-2025📘 NIFTY – TRADING PLAN for 30-May-2025
🕒 Based on 15-minute Chart Analysis
📍 Gap Opening Threshold: 100+ points from previous close of 24,880.85
🔼 GAP-UP OPENING (Above 24,992+):
If Nifty opens above the Opening Resistance zone (24,945 – 24,992) , it signals potential bullish continuation with strong upward momentum.
✅ Plan of Action:
• Wait for a 15-min candle close above 24,992 for breakout confirmation.
• Once confirmed, long trades may be initiated with upside targets:
→ 25,187 (Last Intraday Resistance)
→ 25,277 – 25,340 (Profit Booking Zone)
• Ideal stop-loss should be just below the breakout candle or beneath the 24,992 zone.
• If Nifty approaches 25,187 too quickly after open, expect minor profit booking or sideways move. Avoid aggressive buying near this resistance without proper structure.
🧠 Educational Insight: A gap-up above resistance is strong only if volume confirms and price sustains. Avoid chasing spikes; instead, wait for retest or consolidation above breakout levels to increase probability of success.
⚖️ FLAT OPENING (Between 24,780 – 24,945):
A flat open in this zone keeps the index in a balanced state with both opportunities and risks. Price action will dictate the day’s trend.
✅ Plan of Action:
• Mark the Opening Support: 24,780
• Mark the Resistance Supply zone: 24,945 – 24,992
• Wait for a range breakout:
→ Above 24,992 → Go long (targets: 25,187 → 25,340)
→ Below 24,780 → Go short (targets: 24,595 → 24,473)
• Do not trade within this zone unless price structure is clear and directional.
• Look for rejection wicks or engulfing patterns near support/resistance for potential scalps.
🧠 Educational Insight: Sideways zones are where traders lose most of their capital. Wait for confirmation before jumping in. A “No Trade” decision is also a trade that protects capital.
🔽 GAP-DOWN OPENING (Below 24,680):
A gap-down of more than 100 points brings Nifty near key supports: 24,595 (Last Intraday Support) and deeper into Buyer’s Support Zone (24,473 – 24,509).
✅ Plan of Action:
• Observe price behavior near 24,595.
• If this level holds, and you spot bullish reversal signs (hammer, bullish engulfing), go long toward:
→ 24,780 (Opening Support)
→ 24,880 (Previous Close)
• If price breaks below 24,473 with strong bearish candle, it opens up shorting possibilities with deeper targets.
• Stop-loss for reversal longs = below 24,473; for breakdown shorts = above 24,595.
• Avoid trading immediately at open; let the first 15–30 min range develop for clearer direction.
🧠 Educational Insight: Demand zones are highly reactive. Let the market show whether buyers are stepping in or fleeing. React, don’t predict.
🛡 RISK MANAGEMENT TIPS FOR OPTIONS TRADERS:
✅ Always use 15-min confirmation candles before taking a directional position.
✅ Don’t buy far OTM options post-gap openings ; use near ATM or spreads to control premium decay.
✅ Define your loss limit for the day and stick to it. One wrong revenge trade can ruin weeks of gains.
✅ Keep position sizing small on volatile or event days — focus on surviving first, thriving later.
✅ Use option spreads like debit spreads to reduce theta exposure during sideways market phases.
📊 SUMMARY & CONCLUSION:
• 🟢 Bullish Scenario: Above 24,992 → Targets: 25,187 / 25,340**
• 🔴 Bearish Scenario: Below 24,595 → Targets: 24,509 / 24,473**
• 🟧 Neutral Zone: 24,780 – 24,945 → Wait for breakout direction
• 🟩 Support Levels: 24,780 / 24,595 / 24,473
• 🟥 Resistance Levels: 24,992 / 25,187 / 25,340
• 🧠 Key Strategy: Avoid emotional trading during volatile opening. Wait, confirm, then act.
✨ Final Word: Trading is a skill of patience and preparation. Let levels guide you, not assumptions. The market rewards precision, not prediction.
📢 DISCLAIMER: I am not a SEBI-registered analyst. This trading plan is intended solely for educational purposes. Please consult your financial advisor before making any trading or investment decisions. Trade wisely. 📉📈
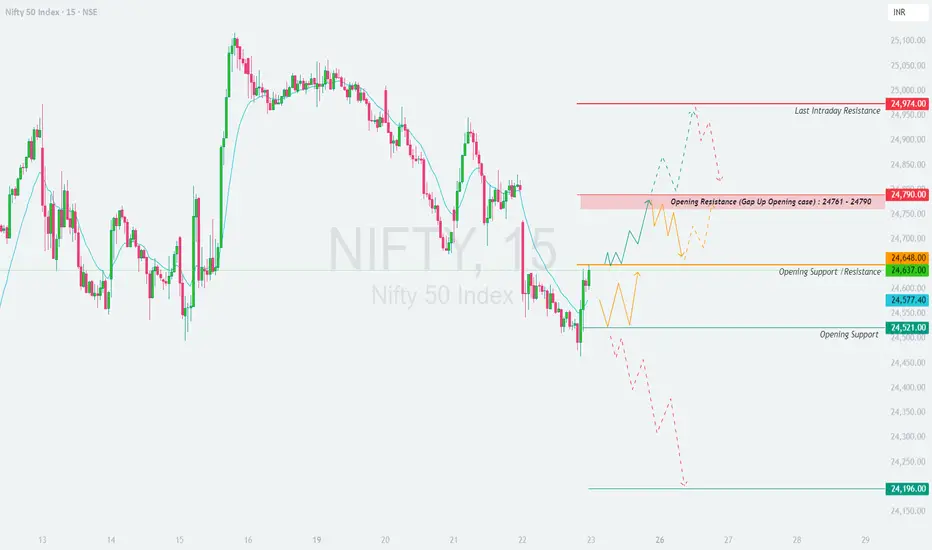
NIFTY : Trading levels and plan for 23-May-2025📊 Nifty Trading Plan – 23-May-2025
Chart Timeframe: 15 Min | Reference Spot Price: 24,637
Gap Opening Threshold: 100+ Points
🚀 Gap-Up Opening (100+ Points Above Previous Close)
If Nifty opens above 24,737 (i.e., 100+ points higher), it will directly enter the critical Opening Resistance Zone: 24,761 – 24,790 .
🟥 This zone has historically shown supply pressure, and a direct gap-up into it might lead to either a quick rejection or consolidation.
✅ Plan of Action:
– Avoid immediate long trades at open if price opens inside this zone.
– Wait for a 15-min candle to close above 24,790 to confirm bullish strength. If successful, Nifty could aim for 24,974, the last intraday resistance.
– If a bearish rejection pattern forms (like an inverted hammer or bearish engulfing) in this zone, consider a sell-on-rise setup targeting a retest of 24,648 and possibly down to 24,577.
– Ideal stop loss for shorts: Above 24,800–24,810.
🎓 Educational Insight: Gap-ups into resistance zones often trap breakout traders. Patience is key—let price confirm before acting.
📈 Flat Opening (within ±100 Points from Previous Close)
If Nifty opens between 24,537 – 24,737, it will be inside the indecisive zone between support and resistance.
🟧 This is often a low-conviction zone where both buyers and sellers test each other, causing choppy price action in the initial 30 minutes.
✅ Plan of Action:
– Avoid trading in the very first 15–30 minutes; let the market provide direction.
– If price holds above 24,648 and breaks out of 24,761, it can extend toward 24,790, and possibly test 24,974.
– If price fails to hold 24,577 and slips below 24,521, expect downside toward 24,196, the major support zone.
– Inside this range, prefer to trade only on confirmed breakouts or breakdowns with volume support.
🎓 Educational Insight: In flat openings, fakeouts are common. Let breakout candles be confirmed with size and volume.
📉 Gap-Down Opening (100+ Points Below Previous Close)
If Nifty opens below 24,537 (i.e., near 24,500 or lower), it will be close to the strong Opening Support Zone: 24,521 – 24,577 .
🟩 This zone has previously acted as a demand area and could attract buyers trying to play a reversal.
✅ Plan of Action:
– Observe price behavior near 24,521.
– If bullish reversal patterns emerge (e.g., hammer, bullish engulfing), and Nifty holds above this zone, consider long trade setups targeting a move back to 24,648 and potentially 24,761.
– If Nifty breaks down with a 15-min close below 24,521, sellers may gain control. Look for a further decline to 24,196, the last strong support.
– Ideal stop loss for longs: Below 24,500.
– Ideal stop loss for breakdown shorts: Above 24,540.
🎓 Educational Insight: Don't blindly buy into support zones—watch for confirmation candles to avoid catching a falling knife.
🛡️ Options Trading – Risk Management Tips
✅ Trade with a predefined stop-loss based on spot levels, not just option premiums.
✅ Use ATM or slightly ITM options to minimize time decay and benefit from delta movement.
✅ Avoid buying OTM options at open, especially on flat or range-bound days .
✅ Don’t trade in No Trade Zones (24,577 – 24,648) unless a clear breakout/breakdown happens.
✅ Book partial profits and trail SL once your trade starts working.
✅ Never overleverage —risk only 1–2% of your capital per trade.
✅ Take a break after 2 stop-losses ; overtrading reduces clarity and increases risk.
📌 Summary & Conclusion
🔹 Opening Resistance Zone: 24,761 – 24,790
🔹 Last Resistance: 24,974
🔹 Opening Support / Resistance Mid-Zone: 24,648
🔹 Support Zone: 24,577 – 24,521
🔹 Last Support: 24,196
🕒 First 15–30 mins are crucial . Let price action unfold before executing any trade.
🎯 Only enter trades after confirmation candles near key zones .
⚖️ Risk-to-reward setups are best near edges of the support/resistance levels , not in the middle zone.
📈 Trend confirmation + volume + candlestick patterns = High Probability Setup .
⚠️ Disclaimer:
I am not a SEBI-registered analyst. This trading plan is shared for educational and informational purposes only. Always consult with a registered financial advisor before taking any investment or trading decisions.
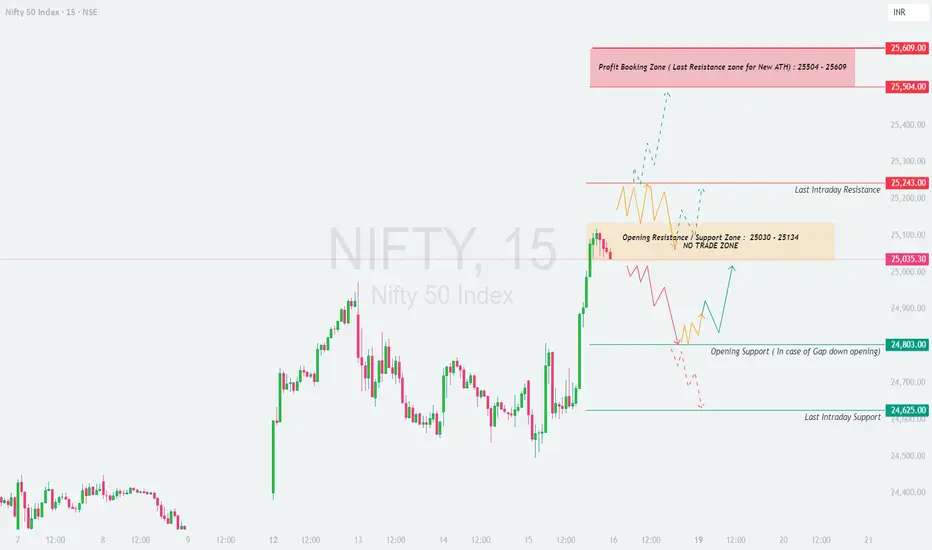
NIFTY : Trading levels and Plan for 16-May-2025📘 NIFTY TRADING PLAN – 16th May 2025 (15-Min Structure Based)
📍 Nifty closed at 25,035.30 on 15-May-2025. Price is currently hovering around the Opening Resistance/Support Zone (25,030 – 25,134) , which has been marked as a No Trade Zone due to potential whipsaws and lack of clear direction.
As per your rule, a Gap Opening is considered ±100 points or more from the previous close.
Let’s break down the strategy into three possible opening scenarios:
🚀 SCENARIO 1: GAP-UP OPENING (Above 25,135)
(Gap-up of 100+ points)
If Nifty opens above 25,135 , it will start trading near the Last Intraday Resistance zone at 25,243 . This zone may act as a strong supply area initially.
Price action near 25,243 must be closely watched. If there’s rejection or failure to sustain, a quick pullback toward 25,134 – 25,030 is possible.
However, if Nifty shows strength and sustains above 25,243 on 15-min closing basis with bullish structure, fresh long entries can be considered.
Upside targets will be 25,504 and potentially 25,609 , which is the Profit Booking / Last Resistance zone for a New All-Time High .
Risk increases if you chase long trades right at open without confirmation candles.
👉 📚 Tip: Prefer a breakout-retest strategy above 25,243 for cleaner long trades. Avoid buying at peak unless there’s strong momentum confirmation.
📊 SCENARIO 2: FLAT OPENING (Between 25,030 – 25,134)
(Flat to minor gap opening)
This zone is marked as the Opening Resistance/Support Zone (25,030 – 25,134) and is a NO TRADE ZONE due to the likelihood of choppy moves and indecision.
Wait for a directional break — either above 25,243 for bullish trades or below 25,030 to consider bearish setups.
If price consolidates within this zone during the first 30 minutes, it’s best to stay patient and avoid noise trades.
A 15-min candle closing below 25,030 could trigger shorting opportunities with targets at 24,803 and then 24,625 .
Above 25,134 , longs should only be taken after a 15-min close above 25,243 to avoid being trapped.
👉 📚 Tip: This zone is not ideal for option buying as theta decay will hurt both sides. Let the direction become clear before entering.
🔻 SCENARIO 3: GAP-DOWN OPENING (Below 24,935)
(Gap-down of 100+ points)
A gap-down below 24,935 pushes Nifty closer to Opening Support zone at 24,803 , which has the potential to act as a bounce area.
If price bounces from 24,803 with a bullish 15-min candle, a quick recovery toward 25,030 can be expected.
However, if Nifty breaks below 24,803 decisively with volume and a follow-up 15-min candle close, further downside may continue toward 24,625 (Last Intraday Support).
This zone may provide scalping opportunities on both sides but demands high discipline and tight SLs.
Aggressive traders may also look for PE buying or bear put spreads below 24,803 , targeting 24,625 and potentially further if global cues support weakness.
👉 📚 Tip: Watch for volume and structure at 24,803 — it's a decision point. If it cracks, ride the trend but be cautious near 24,625 as it may trigger a short-covering bounce.
🛡️ RISK MANAGEMENT & OPTIONS TRADING TIPS:
⏰ Avoid trading within the first 15 minutes post-market open unless a clean breakout/breakdown is visible.
⚖️ Never trade both sides at once — choose the direction based on price structure and stick with it.
💼 Use ATM or ITM options to minimize theta impact during intraday trades.
📉 If the market consolidates, avoid buying options. Use spreads (Bull Call / Bear Put) or wait for V-shaped moves.
🔄 Exit OTM options by 2:45 PM unless holding momentum trades.
📊 Keep SL on candle close basis (15-min preferred) and don’t average your loss-making trades.
👉 💡 Bonus Tip: For momentum confirmation, look for confluence of volume spike + candle body closing beyond marked zone.
📌 SUMMARY & CONCLUSION:
🔸 Bullish Breakout Trigger: 25,243 → Targets: 25,504 / 25,609
🔸 Bearish Breakdown Trigger: Below 25,030 → Targets: 24,803 / 24,625
🔸 Flat Zone: 25,030 – 25,134 → Avoid trading until a clear breakout or breakdown
🔸 Critical Supports: 24,803 (Gap-down cushion), 24,625 (last support zone)
🔸 Risk Focus: Wait for structure confirmation, don’t get trapped in emotional trades
📈 Nifty is currently poised near a decision zone. A clean breakout or breakdown can set the tone for the day, but avoid premature entries in the No Trade Zone. Let price confirm its intent, and then follow with disciplined execution.
⚠️ DISCLAIMER:
I am not a SEBI-registered analyst . This trading plan is shared strictly for educational and informational purposes only . Please conduct your own analysis or consult a registered advisor before initiating any trade. Trading carries risks – protect your capital at all times.
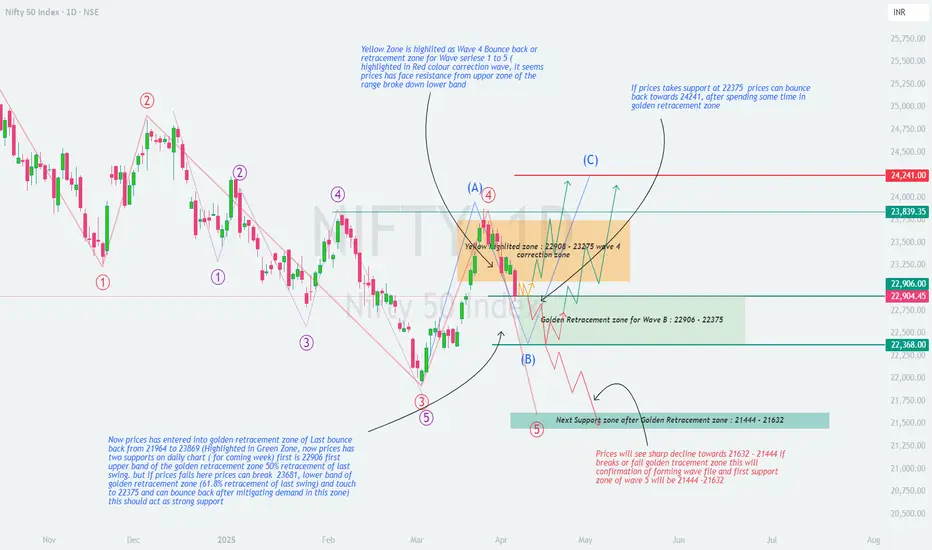
NIFTY : Weekly Analysis (07-Apr to 11-Apr)📊 NIFTY 50 Weekly Analysis – Elliott Wave & Retracement Outlook (April Week 2)
As per the latest Elliott Wave analysis and Fibonacci retracement zones plotted on the chart, NIFTY is currently at a critical juncture . Price action from here will define whether the market resumes upward correction or heads for a deeper fall.
🧠 Technical Structure Overview
The red-labelled impulse wave series 1 to 5 has completed, indicating a completed correction wave structure .
A corrective bounce has been observed post-Wave 5 in the form of Wave A .
Price is now moving in a Wave B correction and has entered a key Fibonacci retracement zone.
📍 Important Zones to Watch
🔶 Yellow Zone – Wave 4 Correction Resistance:
Range: 22,908 – 23,275
This was a previous bounce zone (Wave 4), now acting as a resistance range.
Price faced strong rejection here and reversed down into retracement territory.
🟩 Golden Fibonacci Retracement Zone for Wave B:
Range: 22,906 – 22,368
Price has entered this critical retracement zone.
This range corresponds to:
50% retracement = 22,906 (upper band)
61.8% retracement = 22,368 (lower band)
Implication: If NIFTY sustains within this zone and forms a base, it may initiate a move towards Wave C.
🧭 Scenarios for Coming Week
✅ Bullish Scenario:
If price sustains above 22,368 and reclaims 22,906, it can bounce back towards:
🎯 Target 1: 23,839
🎯 Target 2: 24,241 (Wave C projection)
Confluence: Wave A-B-C projection fits well within this move.
❌ Bearish Scenario:
If price breaks below 22,368 and fails to hold the golden zone:
Expect a sharp decline towards support zone: 21,444 – 21,632
This move would confirm the formation of another impulsive Wave 5 down .
🔍 Key Support and Resistance Levels
Resistance:
22,908
23,275
23,839
24,241
Support:
22,906 (Upper Golden Zone)
22,368 (Lower Golden Zone)
21,632 – 21,444 (Major Support Zone)
📌 Conclusion:
NIFTY is in a decisive zone. Whether we go for Wave C up or another Wave 5 down depends on price action within the 22,906 – 22,368 zone .
Traders should:
Watch for confirmation candles and volumes.
Use demand zone reactions to position accordingly.
Maintain strict risk management.
💬 Share your views in the comments – do you expect a bounce from here or a breakdown?
#NIFTY50 #ElliottWave #TechnicalAnalysis #TradingView #NIFTYAnalysis #Fibonacci #SwingTrading #PriceAction
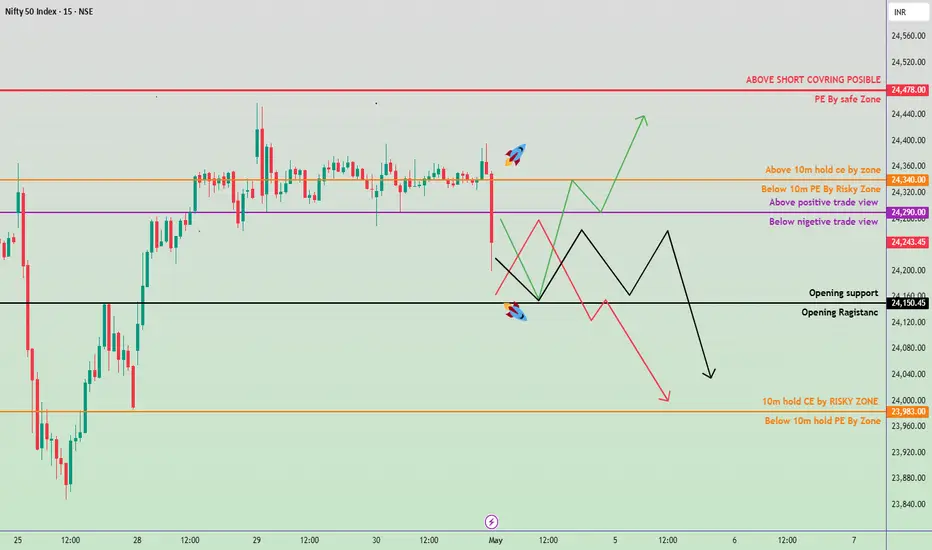
2nd May nifty50 Trading Zone #Nifty50 #option trading
🚀 If you like my trading plan and levels, don't forget to boost the post
99% working trading plan
👉Gap up open 24290 above & 15m hold after positive trade target 24340, 24470+
👉Gap up open 24290 below 15 m not break upside after nigetive trade target 24160, 23990
👉Gap down open 24150 above 15m hold after positive trade target 24340, 24470+
👉Gap down open 24150 below 15 m not break upside after nigetive trade target 23990, 23730,
💫big gapdown open 23987 above 1st positive trade view
💫big Gapup opening 24348 below 1st nigetive trade view
📌 Trade plan for education purpose I'm not responsible your trade
More education follow social media and boost my idea
📌 koi bhi trade leval se 20 point ke sl ke bhina karan nahi hi
📌 koi trade app activate tabhi karana hota hi level pe 2 candle uper ya niche closing aati hai to
📌 leval par Ane pe turant trade plan na kare ...
📌 Full risk apaki hi hi meri nah
NIFTY ViewNIFTY chart analysis showing general view for coming weeks.
Chart shows its in bearish mode untill it breakout channel. It has more chances to go down before breaking that.

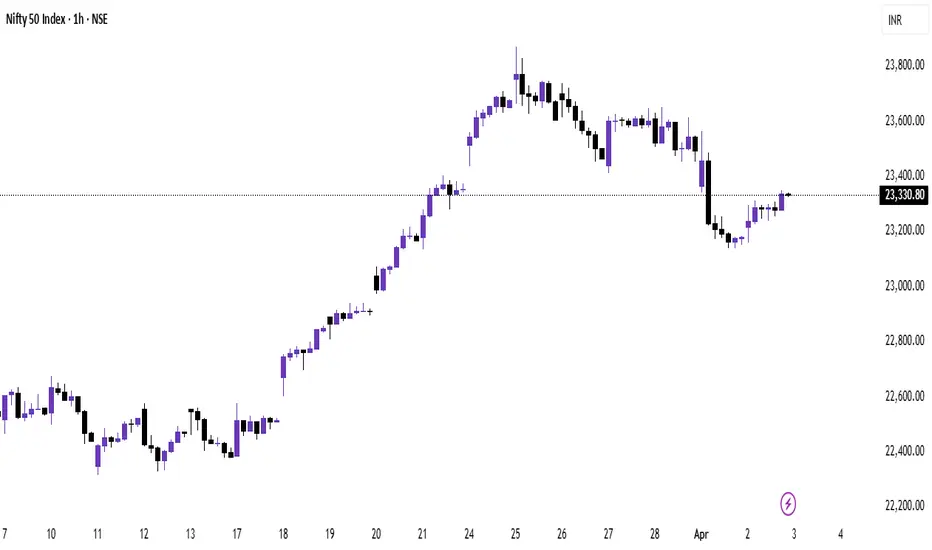
NIFTY 50 - ICT & SMC Analysis (April 3, 2025)1. Market Structure & Trend Overview
1D Chart (Higher Timeframe Bias)
Bearish Market Structure: The market has been in a downtrend, breaking market structure (MSS) at key levels. The recent rally from March was a retracement into a premium zone.
Key Resistance Areas:
Order Block (OB) at ~23,600: Market is rejecting this supply zone.
Previous Daily High (PDH) & Premium Liquidity Zone: Price recently swept liquidity above PDH and is rejecting.
Key Support Areas:
Fair Value Gap (FVG) at 22,800-22,900: This is the next area where price may drop to seek liquidity.
PDL (Previous Daily Low): A liquidity pool where price may react.
📌 Prediction:
If price stays below 23,600, the market may seek liquidity at 23,000 or even 22,800.
If price reclaims 23,600, a move towards 24,000 is possible.
4H Chart (Mid-Timeframe Confirmation)
Bearish Market Structure: Price is forming lower highs and recently had a Change of Character (ChoCH) to the downside.
Key Levels to Watch:
23,600 OB & FVG: Market is rejecting this area.
23,200-23,250 (Liquidity Area): Price is building liquidity below.
22,900 (FVG & Key Support): If price breaks down, this will be a magnet.
Strong Resistance at 23,600: If price gets here, it could be a sell opportunity.
📌 Prediction:
A potential short trade if price retraces back to 23,500-23,600 (OB) with targets at 23,200 & 22,900.
If 23,200 holds, a bounce to 23,500 is possible.
1H Chart (Execution Level)
Price Action Observations:
Liquidity Sweep at PDH: Market took out buy-side liquidity and is now retracing.
FVG Below 23,200: This is a draw on liquidity.
PWL (Previous Week’s Low) at 23,150-23,200: This could act as support before further downside.
📌 Trade Idea (Bearish Setup)
Entry: Sell near 23,500-23,600 (OB & FVG Zone).
Stop Loss: Above 23,650 (Above liquidity zone).
Take Profit Targets:
TP1: 23,200 (First liquidity pool).
TP2: 22,900 (FVG fill & support area).
🔹 Alternative Bullish Scenario: If price does not break 23,200 and forms bullish structure, a long towards 23,600 can be considered.
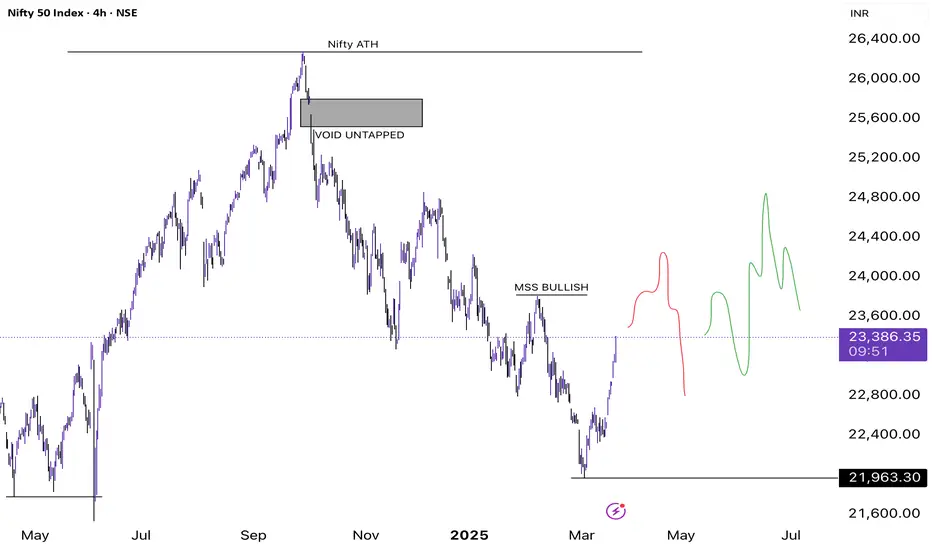
NIFTY 1D Technical Commentary on Market Maker Shifts- Nifty is currently trading at 23,395 up 6.5% from its recent high
- Nifty has still not flipped its structure so enjoying this rally doesn't look right
- Observation: Wait for a market structure shift above 23,828 and a weekly close above, this will help Nifty consume the sellers and make a bullish structure shift
- Two paths drawn signifies these 2 possibilities
- The red path shows we will deviate above the market structure shift trap many bids and long traders post that we will drop straight down
- The green path signifies we will reject straight from the Market Structure shift liquid zone and take out all the inefficiencies created and post that we might see an impulsive wave by trapping more shorts out.
- Everything depends on how the reaction is going to be
NIFTY50 - WHAT IS NEXT?Symbol - NIFTY50
CMP - 23700
The Nifty50 is still trading within a falling channel pattern, which continues to highlight a bearish technical structure. Currently, the index is facing resistance at the upper end of this channel, between 23700 - 23820. Given the ongoing downtrend and resistance levels, there is a strong possibility that Nifty may experience a pullback from these levels.
Nifty is likely to continue trading within this channel, and in the short term, we could see a correction back towards the 23000 - 22800 region. These levels would act as near-term support, as they align with previous lows and key technical levels.
However, if the Nifty breaks above the upper boundary of this channel and manages to sustain above it, the short-term trend could shift from bearish to a more sideways. Such a breakout would indicate a possible consolidation phase, though a shift in trend would require sustained strength above the channel's resistance.
In the event that Nifty undergoes further correction and moves towards the 22500 - 22300 range, this would present an excellent opportunity to buy the dips. At these levels, valuations are expected to become attractive, and investing in strong stocks for the medium to long term could provide solid growth potential as prices at this range could offer significant upside potential.
Thus, while the immediate outlook remains bearish with resistance holding firm, the deeper correction could offer great entry points for investors looking to capitalize on potential market growth over time.
Key resistance levels remain around 23750 - 23900, and support is expected at 22850 - 23000. The 22500 - 22300 region is a crucial area for potential buyers. Traders should stay alert to a possible shift in trend if the upper boundary of the falling channel is broken.

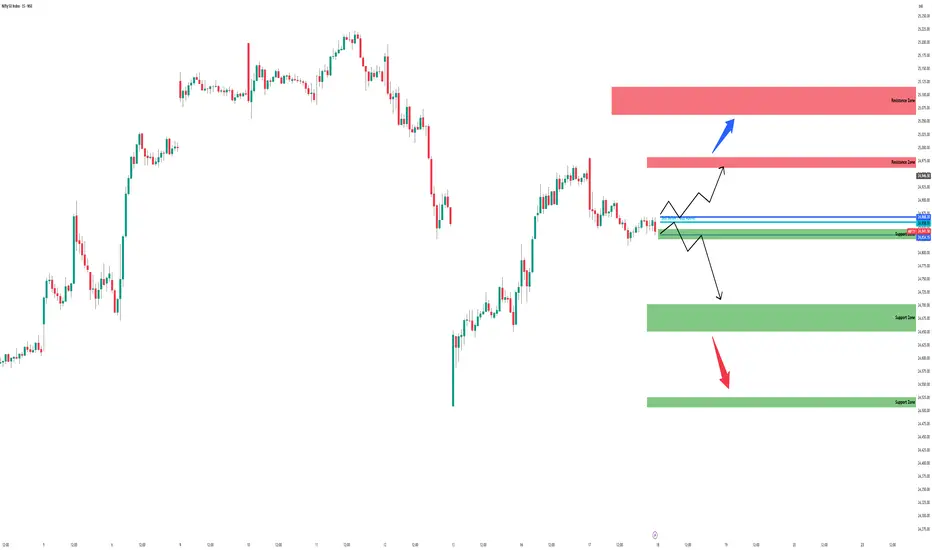
#Nifty50 - 27th November NSE:NIFTY
Chart contains support and resistance levels ( understand how it works 👇🏻)
Support and resistance are key concepts in technical analysis used to identify potential price levels where assets may reverse or stall.
Support:
-Definition: A support level is a price point where buying interest is strong enough to overcome selling pressure, preventing the price from falling further.
- Indicators: Support levels can be identified through historical price data, trend lines, or moving averages.
- Behavior: When a price approaches support, it may bounce back up. If broken, it can become a new resistance level.
Resistance:
- Definition: A resistance level is a price point where selling interest is strong enough to overcome buying pressure, preventing the price from rising further.
- Indicators: Similar to support, resistance levels can be identified through past price action, trend lines, or moving averages.
- Behavior: When the price approaches resistance, it may retreat. If broken, it can turn into a new support level.
Importance:
- Trade Decisions: Traders use these levels to make buy or sell decisions, set stop-loss orders, and identify potential profit targets.
- Market Psychology: Support and resistance levels reflect market sentiment and the balance between supply and demand.
Understanding these concepts can enhance trading strategies and improve decision-making.
Ps note: I'm not SEBI Registere 🙏🏻

Nifty Intraday Trade Setup | 6th DecemberNifty opened with a gap-up and faced rejection near our buy level 24540 in morning, broke sell level 24410 and gave good downfall towards 24295. Both targets were done for sell trade.
After consolidation at lower levels, Nifty gave a sharp up-move and gave 500 points rally from lower levels, made a high at 24857. From day high we again saw 300 points fall in just few mins, today was highly volatile session because of RBI Policy meeting decision tomorrow.
For tomorrow the range the big, trade very cautiously and be alert at higher levels in Nifty. We will look for the sell on rise opportunity.
Expectations: Highly Volatile movement.
Intraday Levels:
Buy Above - 24850
Sell Below - 24550
To motivate us, Please like the idea If you agree with the analysis.
Happy Trading!
InvestPro India

Nifty analysis for 03/12/2024Nifty has been trading in a range for last five trading session and there are possibility of a trend reversal as the chart seems to me.
It is trading around the Hourly EMAs and has closed above it after good fall on Thursday.
If there is a break out of the resistance zone, 24500 can also be breached and new highs around 24730 can be seen.
A base and W pattern formation is there around the low created. Buy on dip can be done once the crucial round number figure is taken out.
Resistance :- 24350, 24500, 24940
Support zone :- 24090-24140
The market is looking strong for the coming days. Market reaching 25k this week or the next can be seen.
Wait for the price action near the levels before entering the market.

FIRST TARGET 27,000"Are you ready to elevate your game and dive into this extraordinary level of experience?"

Nifty staring at 21500 unless it can recover 24550Nifty has formed a second head and shoulder pattern and closed below the neckline today
The target for this pattern is 21500, assuming it doesn't recover to 24550

Nifty50 Crosses Head and Shoulder Pattern, Resistance at 23895Details:
Asset: Nifty50 Index
Breakout Level: Nifty50 crossed the head and shoulder pattern
Current Level: 24472
Potential Resistance: 23895
Stop Loss: Based on risk tolerance or technical analysis
Timeframe: Short-term, dependent on market sentiment and election outcomes
Rationale: Nifty50 has broken through a head and shoulder pattern, a typically bearish indicator. The next significant resistance level appears at 23895. The market may see further downside unless positive developments, such as favorable election results, provide relief.
Market Analysis:
Bearish Pattern: The head and shoulder pattern indicates potential further downside. Nifty50 may continue to decline unless a reversal is triggered by positive news or market catalysts.
Election Impact: Election results could play a crucial role in determining the market’s direction, especially in a sensitive period like this.
Price Target:
Resistance is likely at 23895. If Nifty50 fails to break this level, it may see continued bearish momentum.
Risk Management:
Adjust stop losses based on individual risk tolerance and technical analysis, especially given the uncertainty around political outcomes.
Timeframe:
The timeframe for reaching resistance at 23895 could be short-term, but broader market trends and election outcomes may impact the index's movement.
Risk-Reward Ratio: The setup leans bearish, with the head and shoulder pattern indicating downside risk. Ensure stop-loss levels are adjusted for volatility.
Monitoring the market's response to political and macroeconomic factors will be key for Nifty50's near-term outlook.

NIFTY TOMORROW PREDICTION NIFTY makes Head and shoulder pattern in 1H Time frame ..........if it's breaking the levels then We will see in negetive movement in market...
Nifty 50 has broken through the floor of a rising trend channel in the short term. This indicates a slower rising rate at first, or the start of a more horizontal development. The index has broken a head and shoulders formation. A decisive break, preferably with increasing volume, is considered a confident signal of the start of a falling trend. The index has broken down through support at points 25000. This predicts a further decline. RSI below 30 shows that the momentum of the index is strongly negative in the short term. Investor have steadily reduced the price to sell the index, which indicates increasing pessimism and continued falling prices. However, particularly in big stocks, low RSI may be a sign that the stock is oversold and that there is a chance for a reaction upwards. The index is overall assessed as technically negative for the short term.

Nifty 50 Levels nifty sustains above 25084 then 25141 possible. nifty breaks 24969 then 24912, 24856 levels are possible.
