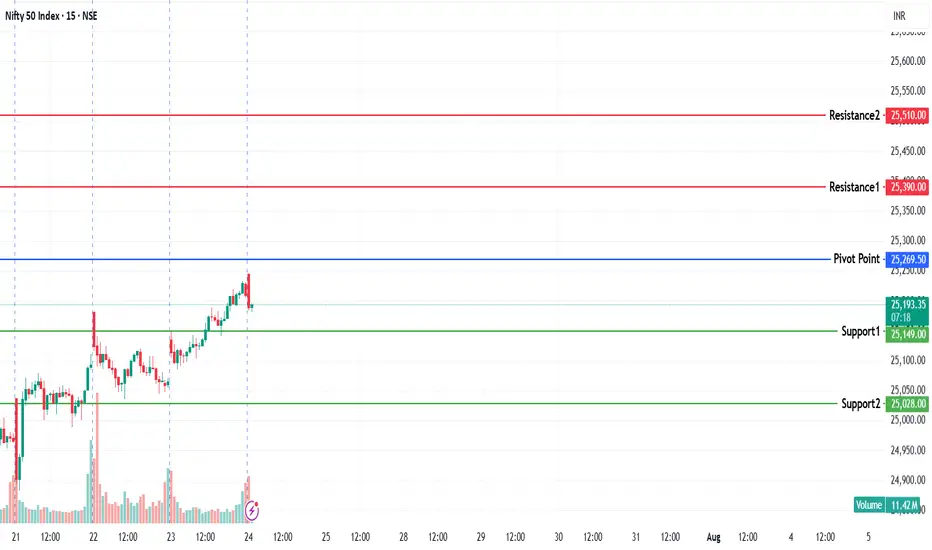
NIFTY KEY LEVELS FOR 24.07.2025NIFTY KEY LEVELS FOR 24.07.2025
If the candle stays above the pivot point, it is considered a bullish bias; if it remains below, it indicates a bearish bias. Price may reverse near Resistance 1 or Support 1. If it moves further, the next potential reversal zone is near Resistance 2 or Support 2. If these levels are also broken, we can expect the trend.
If the range is narrow, the market may become volatile or trend strongly. If the range is wide, the market is more likely to remain sideways
📢 Disclaimer
I am not a SEBI-registered financial adviser.
The information, views, and ideas shared here are purely for educational and informational purposes only. They are not intended as investment advice or a recommendation to buy, sell, or hold any financial instruments.
Please consult with your SEBI-registered financial advisor before making any trading or investment decisions.
Trading and investing in the stock market involves risk, and you should do your own research and analysis. You are solely responsible for any decisions made based on this research.
Niftypriceaction
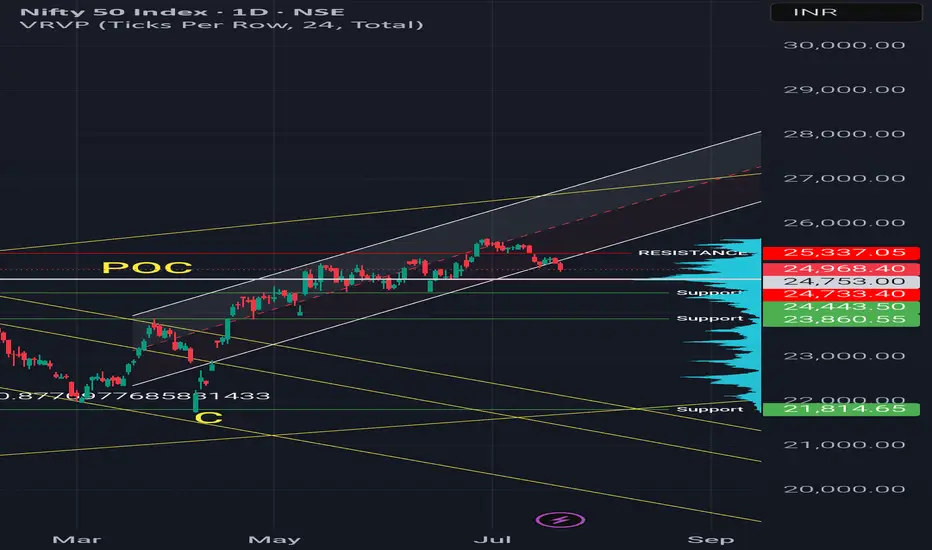
Regression channel breakout - Short term Shift1. Price is out of regression channel — signaling short-term weakness.
2. POC around 24,750 — That is most traded level.
Option Chain Data:
Call writing at 25,300 & 25,500 — clear resistance
But
Yesterday we got positive earnings of ICICI & HDFC Bank.
There is a expectation of pullback as long as nifty is above 24450, long term view is positive
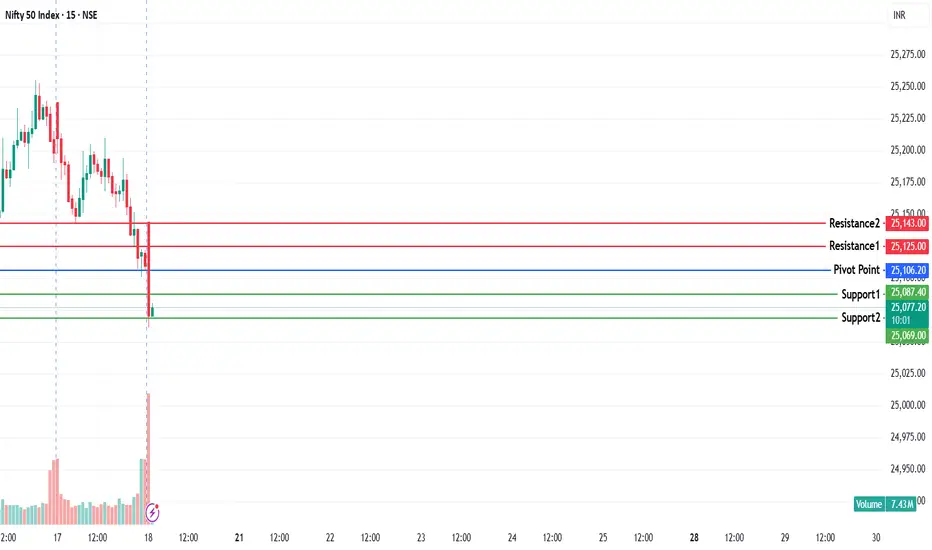
NIFTY KEY LEVELS FOR 18.07.2025NIFTY KEY LEVELS FOR 18.07.2025
If the candle stays above the pivot point, it is considered a bullish bias; if it remains below, it indicates a bearish bias. Price may reverse near Resistance 1 or Support 1. If it moves further, the next potential reversal zone is near Resistance 2 or Support 2. If these levels are also broken, we can expect the trend.
If the range is narrow, the market may become volatile or trend strongly. If the range is wide, the market is more likely to remain sideways
📢 Disclaimer
I am not a SEBI-registered financial adviser.
The information, views, and ideas shared here are purely for educational and informational purposes only. They are not intended as investment advice or a recommendation to buy, sell, or hold any financial instruments.
Please consult with your SEBI-registered financial advisor before making any trading or investment decisions.
Trading and investing in the stock market involves risk, and you should do your own research and analysis. You are solely responsible for any decisions made based on this research.
Weekly bias - Bulls in strong control of pricePrice has taken support from 25400 support zone and seems heading higher towards 26000 resistance.
Tip : Paragraph from Trading in the zone by Mark Douglas
The essence of what it means to be in "the zone" is that your mind and the market are in sync. As a result, you sense what the market is about to do as if there is no separation between yourself and the collective consciousness of everyone else participating in the market. The zone is a mental space where you are doing more than just reading the collective mind, you are also in complete harmony with it.
If this sounds a bit strange to you, ask yourself how it is that a flock of birds or a school of fish can change direction simultaneously. There must be a way in which they are linked to one another. If it is possible for people to become linked in the same way, then there will be times when information from those with whom we are linked can and will bleed through to our
consciousness. Traders who have experienced being tapped into the collective consciousness of the market can anticipate a change in direction just as a bird in the middle of a flock or a fish in the middle of a school will turn at the precise moment that all of the others turn.

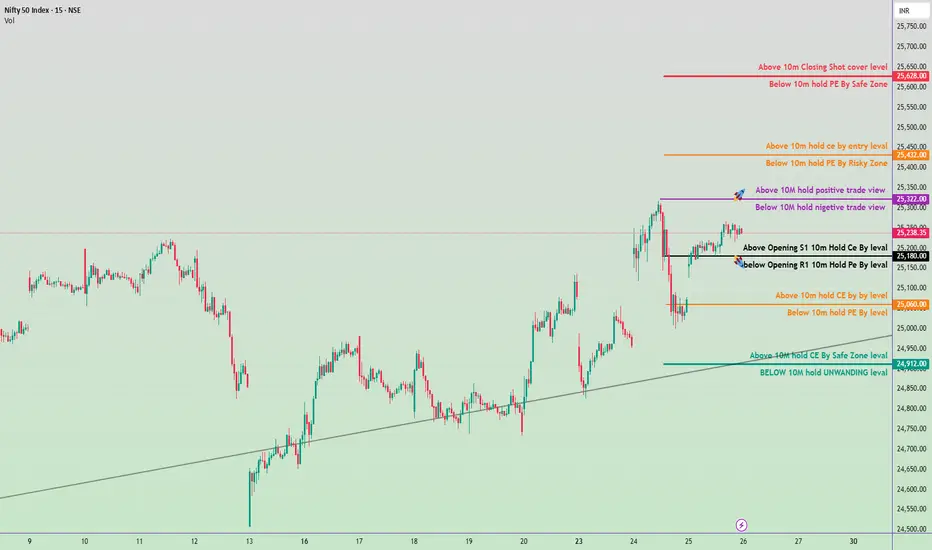
June 26, 2025 Nifty 50 breakout & breakdawon Levals✅ Bullish View Zones:
(Call Option CE Focus)
Above 25,630 – 10m Closing Shot cover level
Above 25,432 – 10m hold CE by Entry level
Above 25,322 – 10M hold: Positive trade view
Above 25,180 – Opening S1 + 10m hold CE by level
Above 25,060 – 10m hold CE by level
Above 24,912 – 10M hold CE by Safe Zone level
❌ Bearish View Zones:
(Put Option PE Focus)
Below 25,630 – 10m hold PE by Safe Zone
Below 25,432 – 10m hold PE by Risky Zone
Below 25,322 – 10M hold: Negative trade view
Below 25,180 – Opening R1 + 10m hold PE by level
Below 25,060 – 10m hold PE by level
Below 24,912 – 10M hold UNWINDING level
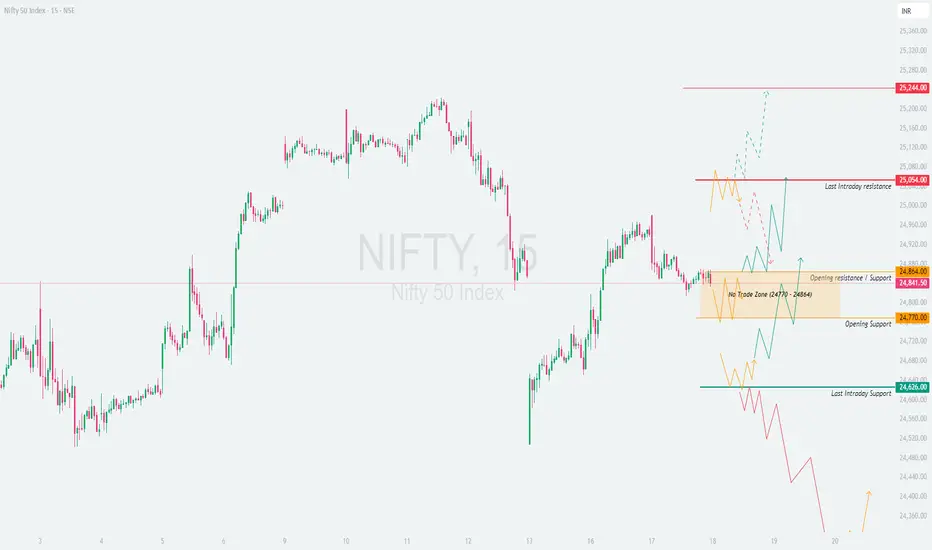
NIFTY : Trading levels for 18-Jun-2025📘 NIFTY TRADING PLAN – 18-Jun-2025
🕒 Chart Timeframe: 15-min | 📍 Previous Close: 24,841.50
📏 Gap Opening Threshold: 100+ points
🔼 GAP-UP OPENING (Above 24,964):
If NIFTY opens above the No Trade Zone (24,864) by more than 100 points, the price will likely test the upper resistance zone near 25,054 (Last Intraday Resistance) .
✅ Plan of Action:
• Avoid chasing right at open. Observe the first 15–30 mins for confirmation above 25,054.
• Sustainable move above 25,054: Look for long trades toward 25,244, with SL below 25,000.
• Rejection at 25,054 zone: Consider short trades only if there’s a clear reversal pattern, targeting back toward 24,864.
• Book profits partially near 25,150 if long, as market may consolidate.
📘 Educational Tip: Sharp gap-ups often face profit booking at resistance zones. Focus on confirmation via strong candles + volume to avoid false moves.
⚖️ FLAT OPENING (Between 24,770 – 24,864):
Flat open near the No Trade Zone (24,770 – 24,864) suggests indecision or potential sideways movement early in the session.
✅ Plan of Action:
• No Trade inside this band until clear breakout or breakdown is seen.
• Break above 24,864: Consider intraday longs toward 25,054, SL below 24,820.
• Break below 24,770: Enter shorts targeting 24,626, with SL above 24,800.
• Avoid trading between 24,770–24,864 during consolidation — it’s where stop losses typically get hit from both sides.
📘 Educational Tip: Trading in the No Trade Zone is like catching a coin toss — instead, let market pick a direction, then follow it with clarity .
🔽 GAP-DOWN OPENING (Below 24,670):
A gap-down below 24,770, especially near or under the Last Intraday Support – 24,626 , brings into play the Buyer’s Support Zone (24,253 – 24,320) .
✅ Plan of Action:
• If opening is near 24,626 and shows breakdown below, ride shorts till 24,420 – 24,320.
• Look for potential reversal setups inside 24,253–24,320 zone for long trades.
• Reclaiming 24,626 with bullish candles could invite short-covering.
• Avoid new shorts inside Buyer’s Zone unless breakdown below 24,253 happens with volume and structure.
📘 Educational Tip: Gaps near support zones give best long risk/reward, but never buy blindly — wait for confirmation candle + sustained buying interest .
🛡 OPTIONS TRADING RISK MANAGEMENT TIPS:
✅ 1. Wait 15–30 mins post-open to avoid false breakouts or reversal traps.
✅ 2. Avoid over-leveraging on gap days — increase accuracy, reduce lot size.
✅ 3. Prefer spreads (Bull Call/Bear Put) if volatility is high to control premium erosion.
✅ 4. Use SL on candle close basis (preferably 15-min), not just trigger wicks.
✅ 5. Exit intraday trades 10–15 mins before close if targets aren't hit to avoid time decay spikes.
📊 SUMMARY – KEY LEVELS TO WATCH:
• 🟢 Bullish Setup:
– Above 24,864 → Target: 25,054 → 25,244
– SL: Below 24,820 (on longs)
• 🔴 Bearish Setup:
– Below 24,770 → Target: 24,626 → 24,320
– Breakdown SL: Above 24,800
• 🟧 No Trade Zone: 24,770 – 24,864 — Let direction confirm
• 🟩 Support Zones: 24,626 / 24,320 / 24,253
• 🟥 Resistance Zones: 25,054 / 25,244
📌 Decision Point: Breakout above 24,864 or below 24,770 decides momentum.
⏱ Watch the first 15-min candle structure for decisive moves.
📢 DISCLAIMER: I am not a SEBI-registered analyst. This trading plan is purely for educational and learning purposes. Please consult your financial advisor before taking any trading or investment decision.
NIFTY
ALWAYS TAKE TRADE WITH CONFIRMATION
Note : Trading in any financial market is very risky. I post ideas for educational purpose only. It is not financial advice. Do not hold us responsible for any potential loss you may incur. Please consult your financial adviser before trading.

Nifty fut price analysisPrice has showed a bullish behavior from a key monthly level and it is heading towards key weekly level of 23500 zone.

Nifty 50 spot 22929.25 by the Daily Chart viewNifty 50 spot 22929.25 by the Daily Chart view
- Just an FYI to note, for the current status of the Nifty 50 Index Daily Closure
- Nifty 50 Index 22775 to 22950 Support Band is yet sustained and nothing more to quote

Nifty 50 23559.95 Daily Chart view - Update on 02-Feb-2025Nifty 50 spot 23559.95 by the Daily Chart view
- Resistance Zone 23900 to 23975 Index level
- Resistance Zone 23375 to 23460 turned to Support Zone still been sustained
- Nifty Daily Chart view of 02-February-2025

Nifty 50 spot 23482.15 by the Daily Chart viewNifty 50 spot 23482.15 by the Daily Chart view
- Nifty 50 Index 22775 to 22950 Support Band is yet sustained
- Resistance Zone 23375 to 23460 to turn in as a probable Support Zone

Nifty 50 spot 24556.00 by Hourly Chart viewNifty 50 spot 24556.00 by Hourly Chart view
- Intermediate Support Zone 24475 to 24525
- Resistance Zone 24750 to 24885 Price Band may become a Support Zone
- The Next Support Zone seen at 24300 to 24375 Price Band acting as H&S neckline
- Resistance Zone 24750 to 24885 Price Band needs to be crossed, closure sustained above it for continued upwards bullish transition

Nifty 50 spot 24556.00 by Hourly Chart viewNifty 50 spot 24556.00 by Hourly Chart view
- Resistance Zone 24750 to 24885 Price Band
- Intermediate Support Zone 24475 to 24525 Trading Band
- Next Support Zone 24300 to 24375 Price acting H&S neckline

Nifty 50 spot 24672.50 by Hourly Chart viewNifty 50 spot 24672.50 by Hourly Chart view
- Resistance Zone 24750 to 24875 Price Band
- Support Zone 24300 to 24375 Price acting H&S neckline

Nifty Intraday Levels | 28-NOV-2024Nifty Options Scalping
1️⃣ Zones to Watch:
👉Green Zone: Institutional support
👉Red Zone: Institutional resistance
👉Gap: 100-200 points between zones
👉Zone Creation: Based on pivot points and Fibonacci
👉Chart: Use Nifty futures chart for reference
2️⃣ Trade Execution:
👉Order Flow: Triggers trades
👉Timeframes: 1-min & 5-min for scalping
👉Risk-Reward: 1:2 (Risk 1 to gain 2)
👉Strike Price: ATM or slightly ITM options
👉Position Sizing: Adjust to risk tolerance
3️⃣ Rules:
👉9:15 AM Sharp: Ready for market open
👉Risk Management: Top priority
👉Quick Trades: "Morning breakfast" scalps
👉Stop-Loss: 10 points
#ThankU For Checking Out Our IDEA , We Hope U Liked IT 📌
🙏 FOLLOW for more content!
👍 LIKE if you found it useful!
✍️ COMMENT below with your thoughts and feedback

#NIFTY Intraday Support and Resistance Levels -29/07/2024Nifty will be gap up opening in today's session. After opening nifty sustain above 24890 level and then possible upside rally up to 25010 level in today's session. in case nifty trades below 24830 level then the downside target can go up to the 24710 level.

#NIFTY Intraday Support and Resistance Levels -24/07/2024Nifty will be gap down opening in today's session. After opening nifty start trading Below 24450 level and then possible downside rally up to 24330 in today's session. in case nifty trades Above 24500 level then the upside target can go up to the 24620 level.

#NIFTY Intraday Support and Resistance Levels -18/07/2024Nifty will be gap up opening in today's session. After opening nifty sustain above 24630 level and then possible upside rally up to 24750 level in today's session. in case nifty trades below 24580 level then the downside target can go up to the 24460 level.

#NIFTY Intraday Support and Resistance Levels -25/06/2024Nifty will be gap up opening in today's session. After opening nifty sustain above 23570 level and then possible upside rally up to 23690 level in today's session. in case nifty trades below 23530 level then the downside target can go up to the 23420 level.

#NIFTY Intraday Support and Resistance Levels -21/06/2024Nifty will be gap up opening in today's session. After opening nifty sustain above 23610 level and then possible upside rally up to 23730 level in today's session. in case nifty trades below 23560 level then the downside target can go up to the 23440 level.

#NIFTY Intraday Support and Resistance Levels -12/06/2024Nifty will be gap up opening in today's session. After opening nifty sustain above 23290 level and then possible upside rally up to 23410 level in today's session. in case nifty trades below 23240 level then the downside target can go up to the 23120 level.

#NIFTY Intraday Support and Resistance Levels -05/06/2024Nifty will be gap up opening in today's session. After opening nifty sustain above 22010 level and then possible upside rally up to 22130 level in today's session. in case nifty trades below 21950 level then the downside target can go up to the 21830 level.

#NIFTY Intraday Support and Resistance Levels -30/05/2024Nifty will be gap down opening in today's session. After opening nifty start trading Below 22670 level and then possible downside rally up to 22550 in today's session. in case nifty trades Above 22730 level then the upside target can go up to the 22850 level.
