Nifty AnalysisThis is Nifty Analysis for Thursday 22nd Aug 2025.
Nifty formed a red candle but formed higher high and higher low formation on Weekly Expiry on Thursday. Nifty is up by 0.13%.
Trade Strategy 1:
Enter Long position (Call Option) after retracement confirmation around 61.8% and Wednesday close - around 25,050. Stoploss just below 25,000.
Target 1 just below previous day high 25,150. This gives 1 is to 1.7 risk reward ratio.
Target 2 around 25,200. This gives 1 is to 2.7 risk reward ratio.
Safe traders may consider Trailing Stoploss after 1 is to 1 risk reward ratio is achieved.
Note - This is for educational purposes only and not a trade recommendation. I am not SEBI registered. Kindly do your own research before doing any financial transaction.
Niftypriceactionanalysis

Nifty AnalysisThis is Nifty Analysis for Thursday 21st Aug 2025. Its Weekly Expiry day and may be volatile. Option buyers need to be cautious and safe traders may avoid this day.
Nifty formed a bullish candle and moved up by 0.28% on Wednesday. Nifty is above short term EMAs in Daily timeframe, but is around resistance and psychological level 25,000. This strategy is a risky one.
Trade Strategy 1: Enter Long position (Call Option) after retracement confirmation around previous day low - around 24,930. Stoploss just below 24,850. Target 1 just below previous day close 25,038. This gives 1 is to 1.5 risk reward ratio. Target 2 around previous day high 25,088. This gives 1 is to 2 risk reward ratio.
Safe traders may consider Trailing Stoploss after 1 is to 1 risk reward ratio is achieved.
Note - This is for educational purposes only and not a trade recommendation. I am not SEBI registered. Kindly do your own research before doing any financial transaction.

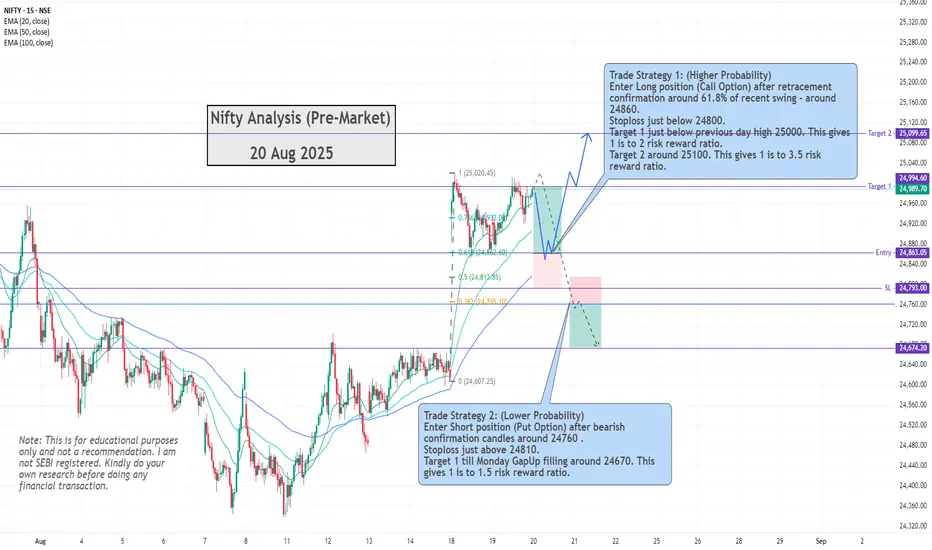
Nifty AnalysisThis is Nifty Analysis for Wednesday 20th Aug 2025.
Nifty formed a bullish candle and moved up by 0.4% on Tuesday. Nifty is above short term EMAs in Daily timeframe, but is near immediate resistance and psychological level 25,000. Though short term Technicals indicate bullishness, wait for a pullback and enter trade. These 2 strategies may work best for Tuesday.
Trade Strategy 1: (Higher Probability)
Enter Long position (Call Option) after retracement confirmation around 61.8% of recent swing - around 24,860. Stoploss just below 24,800. Target 1 just below previous day high 25,000. This gives 1 is to 2 risk reward ratio. Target 2 is around 25100. This gives 1 is to 3.5 risk reward ratio.
Trade Strategy 2: (Lower Probability)
Enter Short position (Put Option) after bearish confirmation candles around 24,760 . Stoploss just above 24,810. Target 1 till Monday Gap Up filling around 24,670. This gives 1 is to 1.5 risk reward ratio.
Safe traders may consider Trailing Stoploss after 1 is to 1 risk reward ratio is achieved.
Note: This is for educational purposes only and not a trade recommendation. I am not SEBI registered. Kindly do your own research before doing any financial transaction.
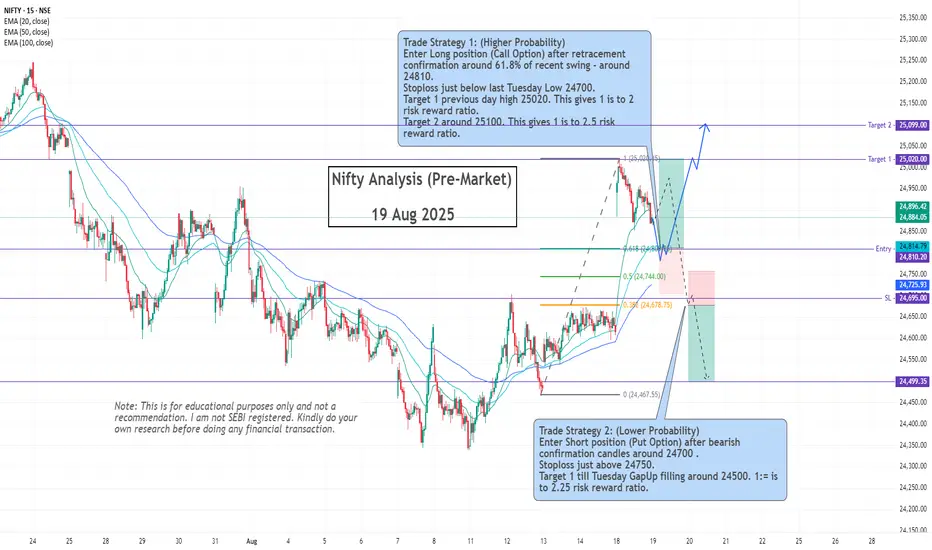
Nifty AnalysisThis is Nifty Analysis for Tuesday 19th Aug 2025.
Nifty opened Gap Up and moved up by 1% on Monday due to the new events (GST, Rating Upgrade). Nifty formed a red candle but has higher high and higher Low formation. It is above short term EMAs in Daily timeframe.
These 2 strategies may work best for Tuesday.
Trade Strategy 1: (Higher Probability)
Enter Long position (Call Option) after retracement confirmation around 61.8% of recent swing - around 24,810. Stoploss just below last Tuesday Low 24,700.
Target 1 previous day high 25,020. This gives 1 is to 2 risk reward ratio. Target 2 around 25,100. This gives 1 is to 2.5 risk reward ratio.
Trade Strategy 2: (Lower Probability)
Enter Short position (Put Option) after bearish confirmation candles around 24,700 . Stoploss just above 24,750. Target 1 till Tuesday Gap Up filling around 24,500. This gives 1 is to 2.25 risk reward ratio.
Safe traders may consider Trailing Stoploss after 1 is to 1 risk reward ratio is achieved.
Note: This is for educational purposes only and not a trade recommendation. I am not SEBI registered. Kindly do your own research before doing any financial transaction.
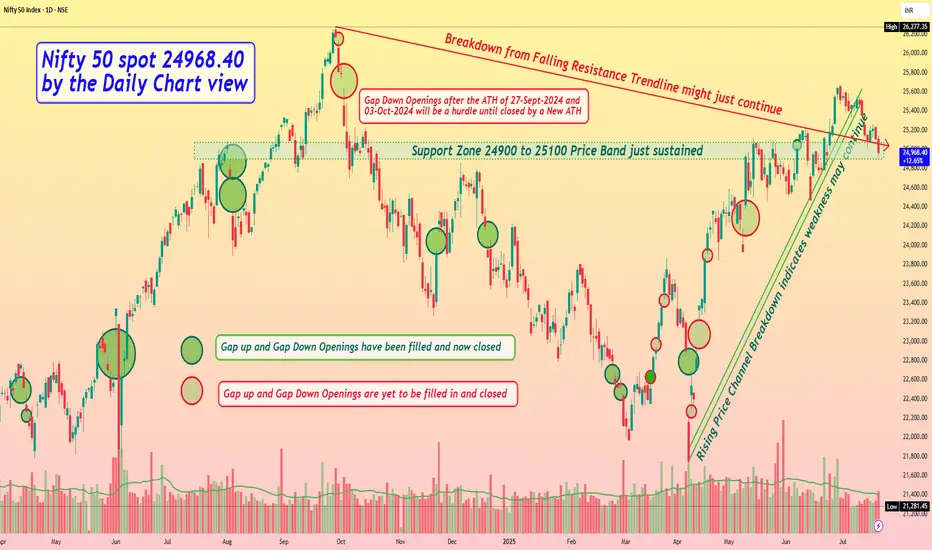
Nifty 50 spot 24968.40 by the Daily Chart view - Weekly updateNifty 50 spot 24968.40 by the Daily Chart view - Weekly update
- Support Zone 24900 to 25100 Price Band just sustained
- Next Support Zone seen at 24325 to 24500 of the Nifty Index
- Breakdown from Falling Resistance Trendline might just continue
- Rising Price Channel Breakdown indicates weakness might continue
- Resistance Zone 25250 to 25400 then ATH 26277.35 of Nifty Index levels
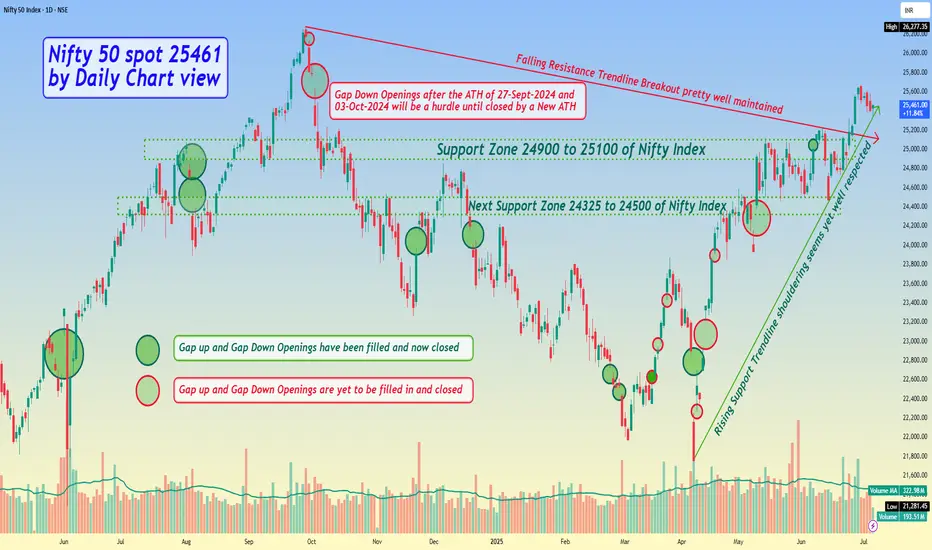
Nifty 50 spot 25461 by Daily Chart view - Weekly updateNifty 50 spot 25461 by Daily Chart view - Weekly update
- Support Zone 24900 to 25100 of Nifty Index
- Next Support Zone 24325 to 24500 of Nifty Index
- Resistance Zone 25860 to 26035 then ATH 26277.35 of Nifty Index levels
- Nifty Index retraced by unwarranted events and to a good extent by profit booking
- Nifty Index is shying away to sustain any upside towards 26000 and falling down flat face
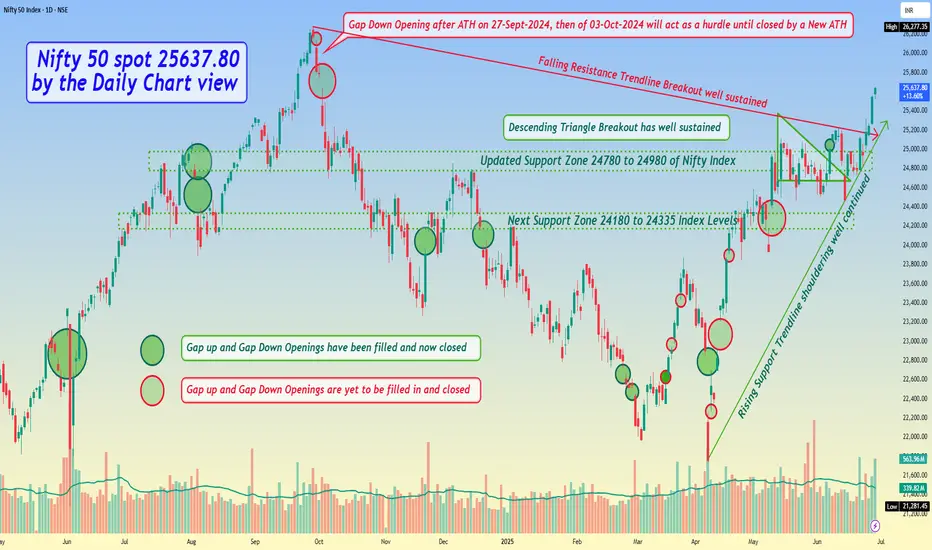
Nifty 50 spot 25637.80 by the Daily Chart view - Weekly update*Nifty 50 spot 25637.80 by the Daily Chart view - Weekly update*
- Descending Triangle Breakout has well sustained
- Immediate Support Zone 25125 to 25335 of Nifty Index
- Next updated Support Zone 24780 to 24980 of Nifty Index
- And then next Support Zone 24180 to 24335 of Nifty Index Levels
- Resistance Zone seen at 25860 to 26035 and then ATH 26277.35 of Nifty 50 Index levels
- Rising Support Trendline shouldering well continued and Falling Resistance Trendline Breakout well sustained
- *Gap Down Opening after ATH on 27-Sept-2024, then of 03-Oct-2024 will act as a hurdle until closed by a New ATH*
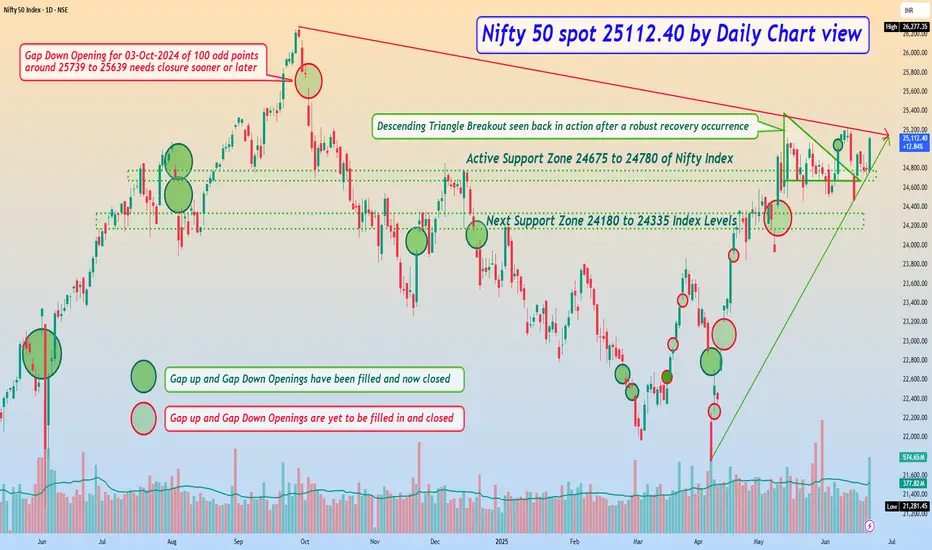
Nifty 50 spot 25112.40 by Daily Chart view - Weekly update*Nifty 50 spot 25112.40 by Daily Chart view - Weekly update*
- Active Support Zone 24675 to 24780 of Nifty Index
- Next Support Zone 24180 to 24335 of Nifty Index Levels
- Resistance Zone seen at 25200 to 25335 of Nifty 50 Index Levels
- Descending Triangle Breakout seen back in action after a robust recovery occurrence
- *Rising Support Trendline seems to have come into active mode but yet needs a stronghold*
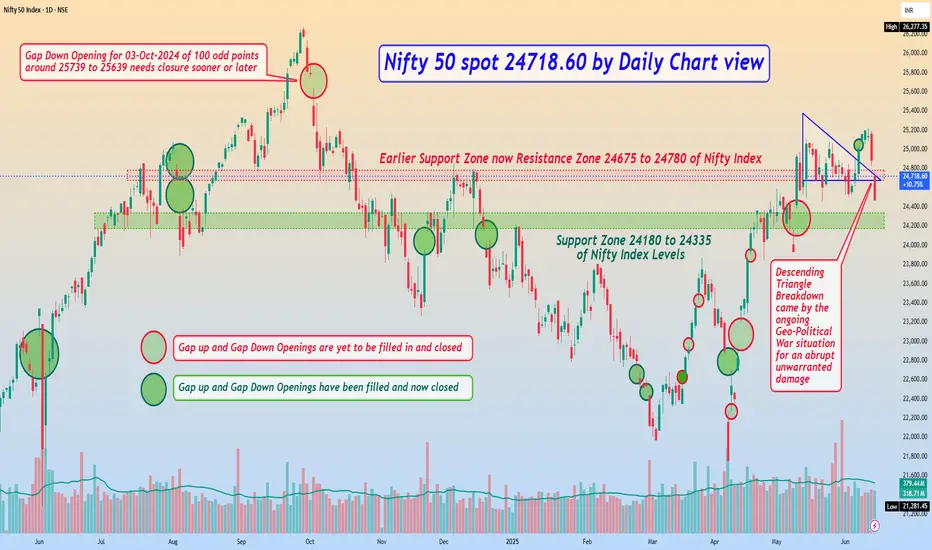
Nifty 50 spot 24718.60 by Daily Chart view - Weekly UpdateNifty 50 spot 24718.60 by Daily Chart view - Weekly Update
- Support Zone 24180 to 24335 of Nifty Index Levels
- Earlier Support Zone now Resistance Zone 24675 to 24780 of Nifty Index
- Descending Triangle Breakdown came by the ongoing Geo-Political War situation for an abrupt unwarranted damage
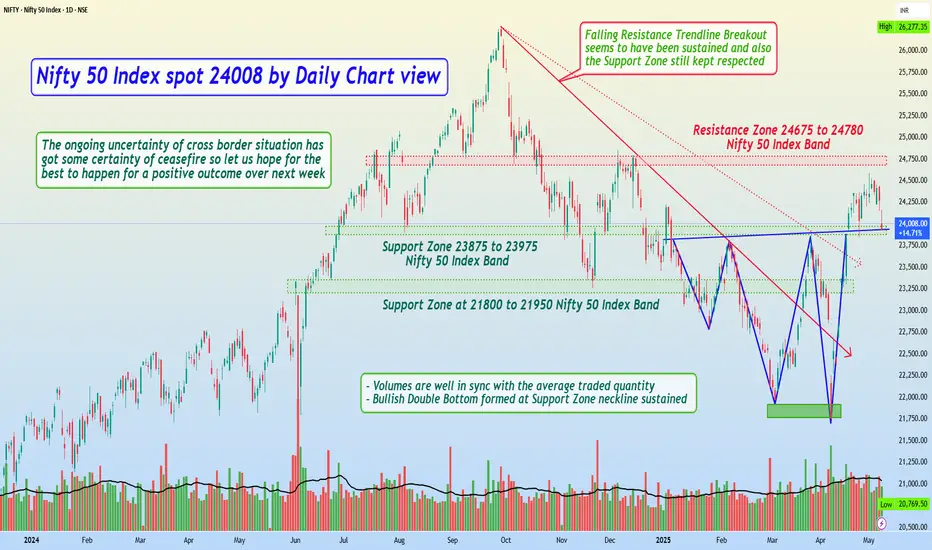
Nifty 50 Index spot 24008 by Daily Chart viewNifty 50 Index spot 24008 by Daily Chart view
- Resistance Zone 24675 to 24780 Nifty 50 Index Band
- Nifty is at Support Zone 23875 to 23975 Nifty 50 Index Band
- *Nifty having sustained above the Support Zone is bound to a bounce back by the cross border mellowed down situation*
- *The ongoing uncertainty of cross border situation has got some certainty of ceasefire so let us hope for the best to happen for a positive outcome over next week*
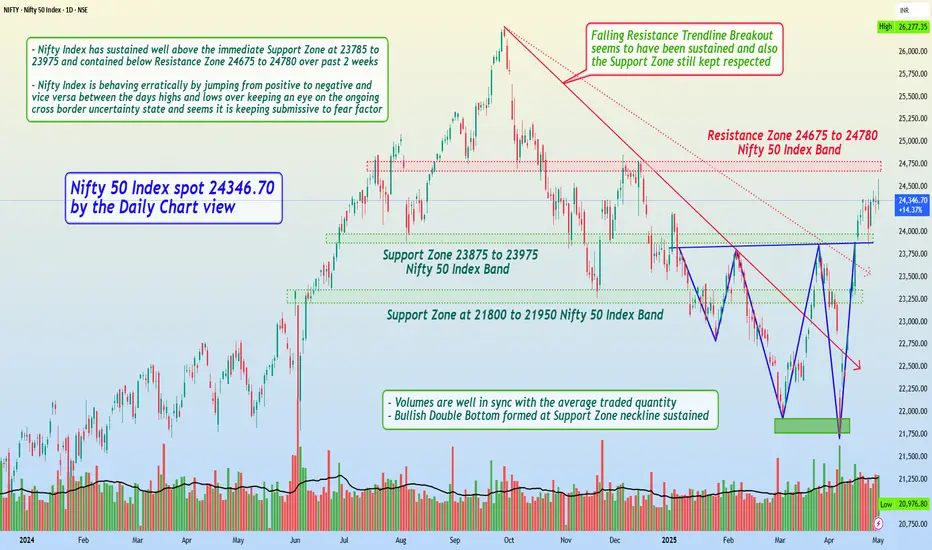
Nifty 50 Index spot 24346.70 by Daily Chart view - Weekly UpdateNifty 50 Index spot 24346.70 by the Daily Chart view
- Support Zone 23875 to 23975 Nifty 50 Index Band
- Resistance Zone 24675 to 24780 Nifty 50 Index Band
- Volumes are well in sync with the average traded quantity
- Nifty Index has sustained well above the immediate Support Zone at 23785 to 23975 and contained below Resistance Zone 24675 to 24780 over past 2 weeks
- Nifty Index is behaving erratically by jumping from positive to negative and vice versa between the days highs and lows over keeping an eye on the ongoing cross border uncertainty state and seems it is keeping submissive to fear factor
- Let us hope for the best to happen for a positive outcome over the coming days/weeks and foresee Nifty 50 Index to gradually and steadily progress towards the current ATH 26277.35 for a New ATH, in line with the Bank Nifty Index strides
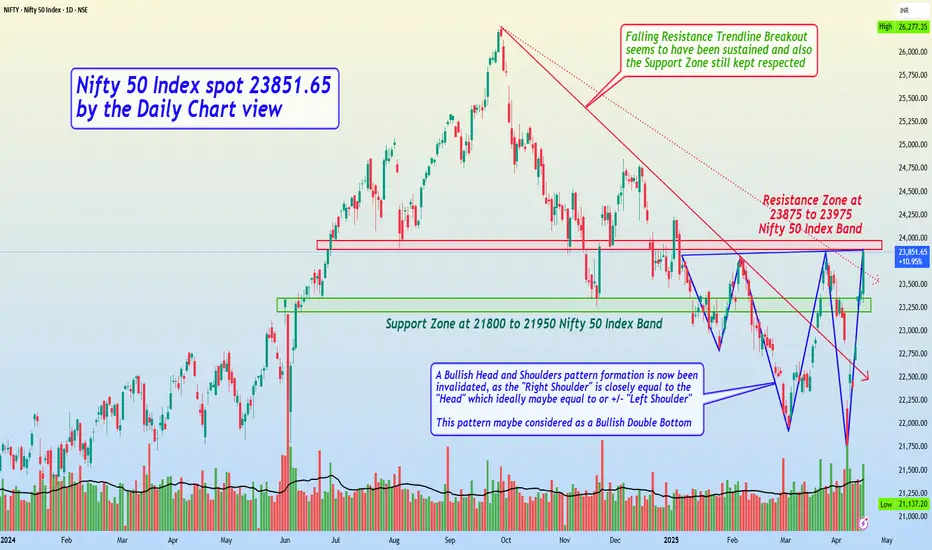
Nifty 50 Index spot 23851.65 by Daily Chart view - Weekly UpdateNifty 50 Index spot 23851.65 by the Daily Chart view - Weekly Update
* Support Zone at 21800 to 21950 Nifty 50 Index Band
* Resistance Zone at 23875 to 23975 Nifty 50 Index Band
* A Bullish Head and Shoulders pattern formation is now been invalidated, as the "Right Shoulder" is closely equal to the "Head" which ideally maybe equal to or +/- "Left Shoulder". This pattern maybe considered as a Bullish Double Bottom
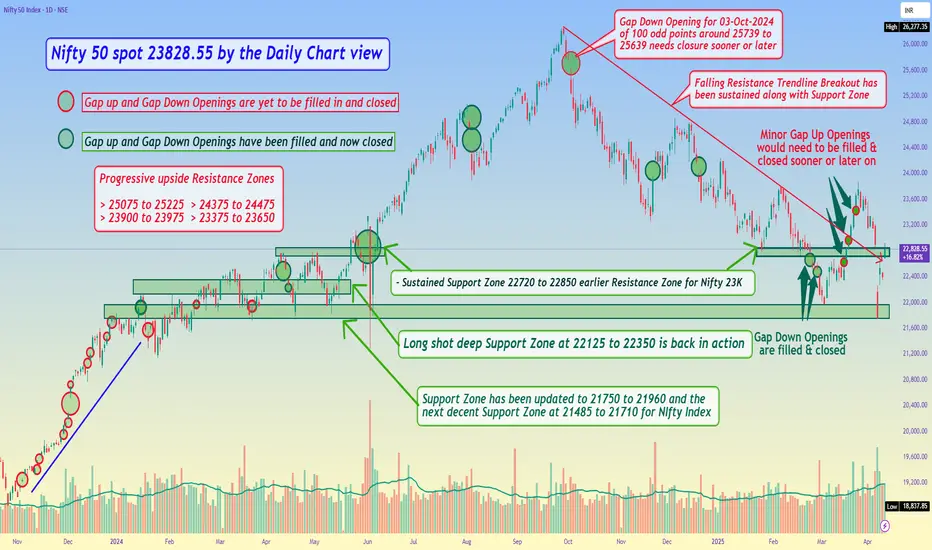
Nifty 50 spot 23828.55 by the Daily Chart view - Weekly UpdateNifty 50 spot 23828.55 by the Daily Chart view - Weekly Update
- Volumes attempting to sustain in sync with avg traded quantity
- Sustained Support Zone 22720 to 22850 earlier Resistance Zone for Nifty 23K
- Progressive indicative Resistance Zones seen at 25075 to 25225 > 24375 to 24475 > 23900 to 23975 > 23375 to 23650
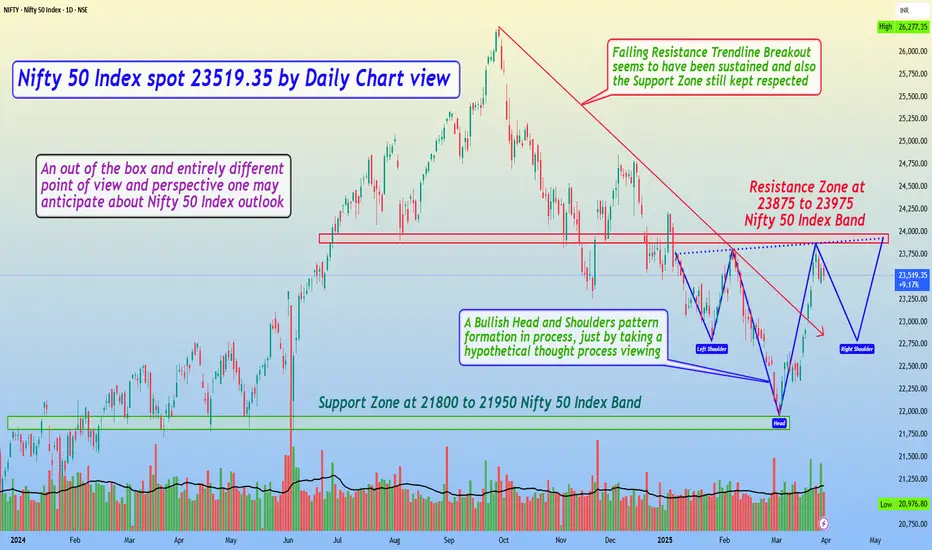
Nifty 50 Index spot 23519.35 by Daily Chart view - Weekly updateNifty 50 Index spot 23519.35 by Daily Chart view - Weekly update
- Support Zone at 21800 to 21950 Nifty 50 Index Band
- Resistance Zone at 23875 to 23975 Nifty 50 Index Band
- Falling Resistance Trendline Breakout seems to have been sustained and also Support Zone still kept respected
- A Bullish Head and Shoulders pattern formation in process, just by taking a hypothetical thought process viewing
- An out of the box and entirely different point of view and perspective one may anticipate about Nifty 50 Index outlook
- Going by this Hypothetical H&S probability for the Nifty 50 Index Chart, we may anticipate good fire crackers to observe
- As such this is just a high level technical chart pattern formation and the Market are always Supreme to work in their own ways
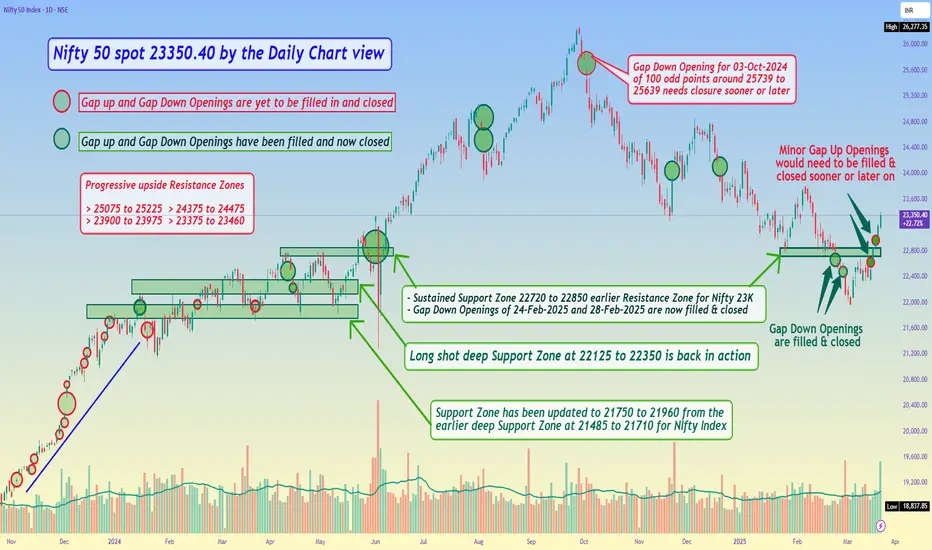
Nifty 50 spot 23350.40 by the Daily Chart view - Weekly updateNifty 50 spot 23350.40 by the Daily Chart view - Weekly update
- Sustained Support Zone 22720 to 22850 earlier Resistance Zone for Nifty 23K
- Minor Gap Up Openings around above Support Zone would need to be filled & closed sooner or later on
- Next set of Resistance Zones seen at indicative Nifty 50 Index levels of 23375 to 23460 and 23900 to 23975
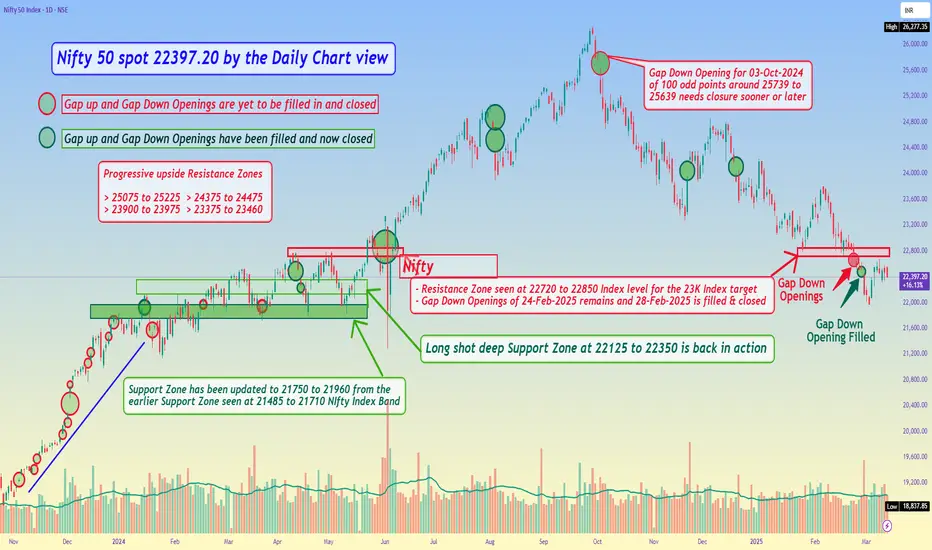
Nifty 50 spot 22397.20 by the Daily Chart view - Weekly updateNifty 50 spot 22397.20 by the Daily Chart view - Weekly update
- Resistance Zone seen at 22720 to 22850 Index level for the 23K Index target
- Gap Down Openings of 24-Feb-2025 remains and 28-Feb-2025 is filled & closed
- Long shot deep inline Support Zone seen at 22125 to 22350 is now back in action
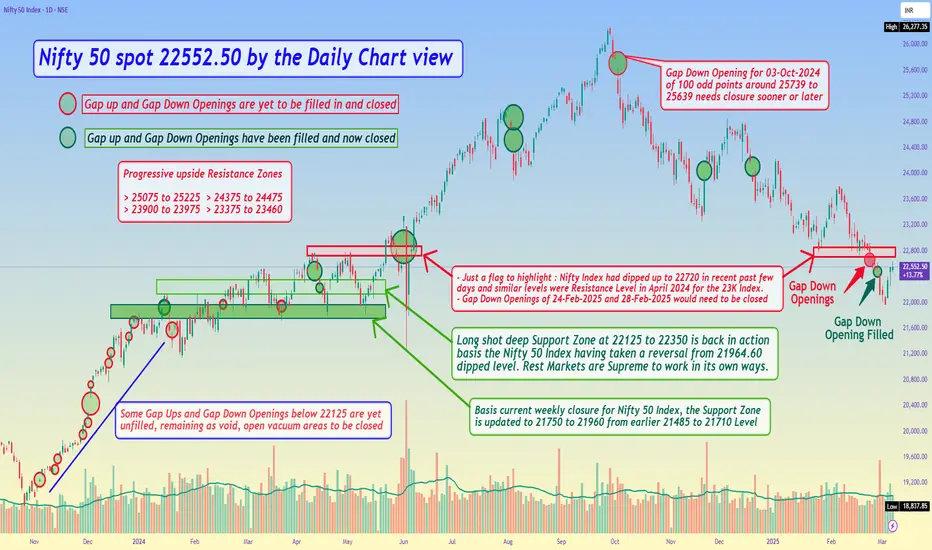
Nifty 50 spot 22552.50 by the Daily Chart view - Weekly Update*Nifty 50 spot 22552.50 by the Daily Chart view - Weekly Update*
- Gap Down Opening of 28th February, 2025 is now filled and has been closed
- Basis current weekly closure for Nifty 50 Index, the Support Zone is updated to 21750 to 21960 from earlier 21485 to 21710 Level
- Long shot deep Support Zone at 22125 to 22350 is back in action basis the Nifty 50 Index having taken a reversal from 21964.60 dipped level.
- Rest Markets are Supreme and work in their own ways. We can at most anticipate, expect and look forward for the best to happen by our assumptions
Nifty 50 Index 22124.70 by Daily Chart view: Different ViewpointNifty 50 Index 22124.70 by the Daily Chart view - Different Viewpoint
A different point of view for the Nifty 50 Index Technical Chart Setup Analysis. This is solely and purely my personal perspective for the Bearish Head & Shoulders pattern's. I will be happy to welcome and get your fine line pointers for the improvement on the Technical Analysis for this Chart Setup. Thank you in advance to One and All.
The 1st H&S Bottom is broken down and now need to look forward, if ..... Nifty 50 Index touches the 2nd H&S Bottom or takes an early reversal ..... Hope for the best to happen and keeping fingers crossed. God Bless All.

Nifty 50 spot 22124.70 by the Daily Chart viewJust sharing an update in continuation over the last week Nifty 50 Index chart data reading.
Nifty 50 spot 22124.70 by the Daily Chart view
- Next Support Zone at 21485 to 21710 Level
- Gap Down Openings of 24-Feb-2025 and 28-Feb-2025 would need to be closed

Nifty 50 spot 22795.90 by the Daily Chart viewNifty 50 spot 22795.90 by the Daily Chart view
- Nifty 50 Index 22775 to 22950 Support Band is yet sustained
- Long shot deep Support Zone seen at 22125 to 22350 which for now seems bit (un)likely by current technical chart status setup
- Just a flag to highlight : Nifty Index had dipped up to 22720 in recent past few days and similar levels was Resistance Level in April 2024 for 23K Index target
- Few of the Gap Ups and Gap Down openings, yet are remaining to get closed and filled in below the Old Long Shot Support Zone at 22125 to 22350 for Nifty Index levels

Nifty 50 Index spot 22929.25 by Monthly Chart viewNifty 50 Index spot 22929.25 by Monthly Chart view
- Nifty 50 Index trending along the Rising Support Trendline 4th time over since March 2020.
- Support point starting March 2020, next in March 2023 followed in Nov 2023 and now in Feb 2025.
- *What can we anticipate and can we hope for some upside reversal from here ????*
