Nifty near all time highSee trading any instrument during all time high or all time low is extremely hard.
You require experience and knowledge of the instrument to trade such conditions.
Nifty is usually very quick to retrace or fall from the top, especially all time high, if it wants to reverse the trend.
Currently we are witnessing Nifty in accumulation phase, so we can say Nifty is trying to go even higher.
Got confirmation we need a close above our demand zone, otherwise any more fall in prices will only create confusion about position, in that scenario avoid trading and wait for clarity.
Niftysetup

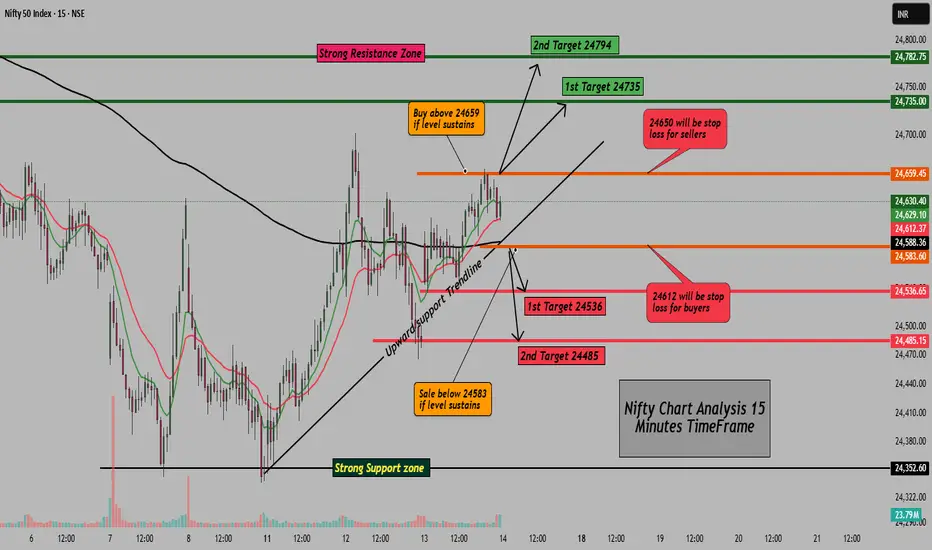
Nifty Intraday Analysis, Key Levels & Trade Plan for 14 Aug 2025Good Morning Traders,
Yesterday, Nifty maintained a bullish tone throughout the session, respecting the upward support trendline and closing near the higher levels. Price action stayed above key psychological support zones, hinting at buying interest on dips. Resistance near the 24,660 area acted as a hurdle, and today’s session will decide whether bulls can take control for higher targets or sellers will step in at resistance.
Important Levels for Nifty (15-Minutes Timeframe):
Intraday Support Zone: 24,583 – 24,536
Intraday Resistance Zone: 24,659 – 24,735
Buy Setup:
Buy above 24,659 if the level sustains for at least 15 minutes .
Targets: 24,735 / 24,794
Stop Loss: 24,612
Sell Setup:
Sell below 24,583 if the level sustains for at least 15 minutes .
Targets: 24,536 / 24,485
Stop Loss: 24,650
Trend Bias: Neutral-to-bullish above 200 EMA; bearish bias if price sustains below it .
Note: Levels are for reference. When a trade setup forms, I will update it in the live market, stay tuned .
Disclaimer: This analysis is for educational purposes only. Please do your own research or consult a financial advisor before trading .
Monday,June 24 Nifty 50 Intraday Trade Plan & kye leves
🔴 Resistance Zones:
25,138 – Crucial Resistance (Above 10M hold = Positive Trade View)
Break & sustain above = bullish continuation
25,330 – Above 10M hold CE by entry level
25,390+ – Closing short-cover zone
🟡 Neutral Zone:
25,100 to 24,970
Sideways/volatility zone between positive and negative trade views
🔵 Support Zones:
24,970 – Opening S1 Hold CE By Level (Important support)
24,740 – 10M hold CE By Level (Demand zone)
24,538 – Safe Zone for CE holding
📌 Trade Plan:
🔼 Bullish Scenario:
If sustains above 25,138 → expect rally towards 25,330 and 25,390+
Entry near 25,110–25,138 zone (on retest) with SL below 25,070
🔽 Bearish Scenario:
If price breaks below 24,970 → watch for decline towards 24,740 and then 24,538
Entry on breakdown with SL above 25,000
🧠 Sentiment Strategy:
Above 25,138 = bullish bias (Buy on dips)
Below 25,100 = neutral
Below 24,970 = bearish sentiment builds up

Nifty 16th may directionAny kind of gap down
less than 1%, will see a
chance for me to buy and
take it higher
I have been stating 25234 for very long
IT WILL GET HIT

6th May 2025 Nifty 50 Prediction #Nifty50 #option trading
🚀 If you like my trading plan and levels, don't forget to boost the post
99% working trading plan (Opning Possibility Flat )
👉Gap up open 24518 above & 15m hold after positive trade target 24628, 24880+
👉Gap up open 24518 below 15 m not break upside after nigetive trade target 24360,
👉Gap down open 24360 above 15m hold after positive trade target 24518, 24880
👉Gap down open 24360 below 15 m not break upside after nigetive trade target 24238,
👉 Gap down open Trade NIFTY NIFTY 08 MAY 24400 CALL 82 @
👉 Gap up open Trade NIFTY 08 MAY 24500 PUT 78@
💫big gapdown open 24238 above 1st positive trade view
💫big Gapup opening 24628 below 1st nigetive trade view
📌 Trade plan for education purpose I'm not responsible your trade
More education follow social media and boost my idea
📌 koi bhi trade leval se 20 point ke sl ke bhina karan nahi hi
📌 koi trade app activate tabhi karana hota hi level pe 2 candle uper ya niche closing aati hai to
📌 leval par Ane pe turant trade plan na kare ...
📌 Full risk apaki hi hi meri na

Asian Session High-Low+India Market Opening Reaction–Must Know!
Hello Traders!
Most traders focus only on the Indian market’s open without realizing the hidden power of the Asian session highs and lows . The reaction around these levels during our market opening can provide a fantastic intraday setup! Today, I’ll show you how to use Asian session levels combined with Indian market open to catch clean trades .
Why Asian High-Low Levels Matter
Pre-Defined Support/Resistance:
Asian session high and low create important reference points even before India opens.
Liquidity Pools:
Big players often place orders around these zones — making them natural traps or breakout points.
Clear Bias for the Day:
Price reaction at these levels can hint whether the day will trend or stay sideways.
The Setup – Step-by-Step Guide
Step 1 – Mark Asian Session High & Low
→ Asian session = from 5:00 AM to 9:15 AM IST
→ Plot horizontal lines at the highest and lowest points.
Step 2 – Observe Price Behavior Near These Levels After India Opens
→ Rejection = Reverse (trade against breakout)
→ Break + Retest = Trend Continuation
Step 3 – Entry, Stop Loss & Target
→ Entry: After confirmation candle (like engulfing, pin bar) at Asian High-Low
→ SL: Few points beyond the high/low
→ Target: 1:2 or next major support/resistance zone
When to Avoid This Setup
Major Gap Up or Gap Down Days:
If the market opens far away from Asian levels, ignore.
High Volatility News Days:
Big news flow (RBI policy, US inflation data) can invalidate early session reactions.
Rahul’s Tip
“First 15-30 minutes after open are critical.” Patience is key — let the market show you if Asian High/Low will hold or break!
Conclusion
By combining Asian session highs and lows with opening reactions , you can trade with a plan instead of guessing. This setup works beautifully for Nifty, BankNifty, and major stocks with decent liquidity.
Have you ever tried tracking Asian session levels? Let’s discuss in the comments below!
If you found this post valuable, don't forget to LIKE and FOLLOW !
I regularly share real-world trading setups, actionable strategies, and learning-focused content — all from real trading experience, not theory. Stay connected if you're serious about growing as a trader!

Straddle Selling in Sideways Market – Full Risk-Reward Strategy!Hello Traders!
Sideways market eating your premiums? Don’t worry — this is where option sellers shine the brightest. One of the most reliable setups in a consolidating market is the Short Straddle Strategy . Today, I’ll break down exactly how to deploy a straddle in a range-bound market , along with proper risk-reward planning, adjustments, and exit rules .
What is a Short Straddle?
You sell both a Call (CE) and a Put (PE) at the same strike price (ATM) .
Ideal for low volatility , range-bound days where you expect limited movement in either direction.
The maximum profit is earned when the index or stock stays near the strike price till expiry or exit.
When to Use This Strategy
CPR Narrow + Inside Previous Day Range → Indicates consolidation
VIX Falling or Low (Below 13–14): → Lower volatility supports premium decay
No Major Events or News Expected: → Avoid directional shocks
OI Buildup at ATM Strike: → Signals strong range expectation
Risk-Reward Setup & Management
Entry Time: Ideal between 9:45–10:15 AM after range is confirmed.
Stop Loss: Set a combined premium SL of 25–30% or exit on sharp one-sided breakout.
Adjustments: If breakout starts, shift legs (convert into strangle) or buy hedge OTM options.
Exit Time: Usually 1:1.5 RR is achievable by 12:30–2:30 PM on calm days.
Rahul’s Tip
“Straddle selling is not about predicting direction — it’s about predicting no direction.” Respect the structure. If price stays inside the trap, you win by default.
Conclusion
The Short Straddle Setup is perfect for range-bound conditions, especially in Bank Nifty or Nifty. With clear entry, SL, and adjustment rules , you can earn steady returns from time decay — but only if you stay disciplined.
Do you use straddles? What’s your favorite expiry day setup? Drop it in the comments below!

Weak New Year By Nifty Expecting Nifty to trade into the gap ( Volume imbalance) and then continue its sell off... bias is short till 23600.. Major view 23265 until it gets changed

Nifty Long 24500 | Hourly View | Elliott waves Nifty now in wave C as shown in chart.
Right now wave 3 of c which should go min 24447 then with some halt final move towards 24551 min as of now.
Expecting some pullback and halt near 24500 before giving next move direction. Final destination is 24900-25000 for this move.

Nifty View Hourly | Next movesNifty 50 as we expected rotated between 24000-24500. Today it went to 24000.
Case 1: abc of B in progress and b completed near demand zone. As shown in red. Now reversal of c can come.
Reversal candles with RSI signals can confirm.
Case 2: abc of B completed already at a and Now C in progress. As shown in blue lines B to C.
Below 23900 can confirm further drop towards 23500 and maybe to 22900.
Disclaimer: Not a buy, sell recommendation. Only for educational/ entertainment purpose.

Nifty Analysis for 21-22 Nov Based on elliott wave forecasting on hourly chart we are in either wave iv or v of y of wxy correction. Which gives two possible scenarios as given in chart
Green : we are wave iv with a and b completed and c can continue in future. Possible trade given in green box.
Red: we are wave iii of iv and go like red arrow, trade given in red box.
This is for educational purpose and not an advice/recommendation to buy or sell. Do your research before trading. Happy Trading.

Long Setup in Choice InternationalAn On Neck Chart Pattern Breakout happened on the Weekly Time frame of NSE:CHOICEIN
Price Action is well supported by the volume.
The stock is currently in uptrend making higher highs and higher lows.
One can add this stock into their stocks to buy list.
Initiate the long trade only according to the levels mentioned.
Stop loss will be on a Weekly closing basis.
Trend Analysis :- UP Trend
Chart Pattern :- Bullish On-Neck Chart Pattern
Technical Indicator :- Positive MACD Crossover

nifty short idea Hello
As we can see that TERA GHAR JAYEGA pattern are seeing if breakdown happen then we can the good risk reward trade (that's new like diamind pattern )
P.s = only for watch, not a trading advice

NIFTY50 INTRA-DAY LEVELS FOR TOMORROW, 15 DECEMBERNSE:NIFTY
Time Frame: 15Mint
ABOVE 21200 Possible Rise Till 21280+, 21300+, 21400++
BELOW 21160 Possible Fall Till 21120+, 21060+, 21020++
Strong Support Of 50DAY EMA.
PLEASE DO FOLLOW IF YOU LIKE OUR ANALYSIS.

NIFTY CHART LEVELSHello friends as you already enjoye our last Banknifty levels
These are levels which are marked on NIFTY INDEX.
Thanks
For education purpose only.

Simple Trade Setup | NIFTY | 18-04-2023 [INTRADAY]NSE:NIFTY
Flip zone: : This zone is such a zone which will work as resistance if price is below it. And it will work as support if price is trading above it.
Resistance zone: This zone will mainly work as resistance. Once price sustain above it then it is considered as breakout.
Support zone: This zone will mainly work as support. Once price sustain below it then it is considered as breakdown.
All other levels between zones are such a level that you can scalp from it , book partial/full profit and also use it as trailing SL.
Good trade setup with good Risk reward will be only if we enter from any of zone.
-------------------------------------
Trade Setup for 18-04-2023
Most of all the levels and zones remains same as per previous.
1) Don't Jump in to trade at the beginning of the market. Let it get settle for 15-20min first and judge the price action.
2) Everything is mentioned on the chart. I hope it is easy to understand.
3) All the levels will work as support, resistance, entry and exit w.r.t price action near that level.
4) Avoid gap up or gap down chase. Wait and trade between levels.
Please refer below chart for levels.
Hope I made it easy to understand it.
Do comment your doubt or suggestion.
Note: Trade with Strict SL. It may or may not hit all the levels. So one can book profit / loss at respective level considering how price action works near that level.

Nifty strong breakout above 17700Nifty is trading near breakout zone. Breaking above 17700 can lead this strong up trend till 18100.
On the flip side 17500 will act as a strong support zone.


Nifty 50 SETUPNifty50 is in very volatile phase....It suggest that Demand & Supply is uncertain or Buyers & sellers are still confused.

NIFTY ANALYSIS FOR 19/JAN/2023
As on today 18/Jan - Nifty was trading within 45 points range 18180 - 18137 lvl from 11.20 to 3.30.
Dow is -391.76 (-1.14%) as of 3.30pm. Dow is falling & Nifty is going up, we can expect some big moves in Nifty in the coming days.
Kindly trade with less quantities with strict SL in the current market condition.
This is just my view of NIFTY. Do your own analysis and trade!.

Nifty50 Intraday setupNifty all the levels are on the chart for educational levels.
Valid for 12/10/2022

Nifty-23/09/2022-LevelsHello Traders,
Welcome to SriTrader5121
Nifty-23/09/2022-Levels
If market open as a GAP-UP and moves to UP-Side then BUY with the
Support of PDH and SELL with the Rejection of S@1.
(or)
If market open as a GAP-UP and moves to DOWN-Side then BUY with the
Support of PDL and SELL with the Rejection of PDL.

NIFTY 07 SEPTEMBER 2022Demand & Supply Zones and levels for Nifty 50, Kindly follow the levels for best R:R.
