NIFTY Faces Pressure: Can 24,300 Hold?NIFTY has turned weak after falling around 2.5% on the weekly chart. The index has made a double top near 26,250, which usually means the market is finding it hard to move higher from that area.
On the weekly chart, the candles look bearish. NIFTY is currently holding near an important support around 25,000 (50 EMA). If this level breaks, the market may move lower towards 24,300 and even 23,900.
On the daily chart, NIFTY is trading below all major moving averages (20, 50, 100 & 200 EMA). In the past, whenever NIFTY stayed below these averages, it usually corrected further. Right now, there is no strong support before 24,600.
On the monthly chart, a double top is visible again, showing weakness at higher levels. However, there is decent support near 24,300–24,240, which is also close to the monthly 20 EMA.
Momentum is also weakening. RSI is showing bearish divergence on weekly and monthly charts, which suggests upside strength is fading.
Resistance Levels :- 25,200 – 25,300, 25,500, 26,250
Support Levels :- 24,987, 24,600, 24,300 – 24,240, 23,900
Overall View
As long as NIFTY stays below 25,500, the trend remains weak. Market direction will become clearer near the 24,300 support zone.
Niftyshort

NIFTY 50 | Bullish Structure vs Bearish Candles — What Next?Pure Price Action & Volume Study
Index: NIFTY 50
Timeframe: Weekly
Method: Price Action + Volume
🔍 Market Structure
On the weekly timeframe, NIFTY 50 continues to form a VCP (Volatility Contraction Pattern) — a structurally bullish setup that generally supports higher prices once resolved correctly.
However, recent candle behaviour introduces a clear warning sign.
🕯️ Candlestick + Volume Analysis
The last two weekly candles are Hanging Man formations. Both candles printed with identical weekly volumes (~1.23B). Hanging Man is a reversal pattern when it appears near resistance
Important clarity:
Hanging Man ≠ Hammer
Hammer forms near support (bullish)
Hanging Man forms near resistance (potential weakness)
This suggests supply entering the market despite a bullish broader structure.
⚖️ How to Read the Conflict
Chart pattern: Bullish (VCP intact)
Candlestick signal: Bearish (Hanging Man + matching volume)
When structure and candles diverge, markets often choose sideways or corrective price action before the next directional move.
📉 Probable Price Path
There is a reasonable probability of:
A move back toward 25,700 (low of the recent weekly candle)
Or a deeper retracement into the nearest weekly support zone around 25,300
This pullback could help form a small rounding base, strengthening the existing VCP before another attempt toward 26,000
📊 Bias & Key Levels
View: Bearish → Sideways
Bullish only if:
Price breaks and sustains above ATH 26,325
Preferably with a strong weekly body candle, not a wick-based breakout
Until that happens, upside remains unconfirmed.
🧠 Final Thought
This is a classic “structure vs signal” situation:
Bullish patterns need bearish candles to get resolved first.
Patience is part of price action.
⚠️ Disclaimer:
This analysis is for educational purposes only. Not a trading or investment recommendation. Markets are risky—always manage risk and position size carefully.
👍 If this idea added value, boost it, follow for more pure price-action studies, and comment with the next stock or index you’d like analysed.

NIFTY 50There's a high possibility, NIFTY could test below white line or 24770 within 17th Nov 2025 .
Disclaimer:
It's a personal view not a financial advice and I assume no responsibility and liability whatever outcome arises.

“Nifty 50 Intraday Key Levels | Buy & Sell Zones 10th Oct 2025”“Want to learn more? Like this post and follow me!”
25390 🔴 Above 10m closing Shot Cover Level
Strong resistance — short covering likely above this.
25288 🟠 Below 10m hold PE By level /
Above 10m hold CE by level
25218 🟣 Above 10M hold positive trade view
Below 10M hold negative trade view
Sentiment deciding level — crucial for trend direction.
25090 ⚫ Above Opening S1 10m Hold CE By level
Bullish entry level — CE hold area.
25018 🟠 Below Opening R1 10m Hold PE By level
Below 10m hold PE By Risky Zone Weak zone — PE may strengthen below this.
24920🟢 Above 10M hold CE By Safe Zone level
Safe bullish zone — CE can be held confidently above.
24,4920 🔵 BELOW 10M hold UNWINDING level
Breakdown zone — unwinding or heavy selling possible below.

“Nifty 50 Intraday Key Levels | Buy & Sell Zones” 6th Oct 2025Key Levels for Tomorrow:
25,120 → Above 10m closing Short Cover Level (CE Safe Zone)
Below 10m hold PE (Risky Zone)
25,023 → Above 10m hold CE (Entry Level)
Below 10m hold PE (Risky Zone)
24930 → Above 10m hold → Positive Trade View
Below 10m hold → Negative Trade View
24,820 → Above Opening S1 hold CE (Buy Level)
Below Opening R1 hold PE (Sell Level)
24,690 → Above 10m hold CE (Buy Level)
Below 10m hold PE (Sell Level)
24,590 → Above 10m hold CE (Safe Zone)
Below 10m hold UNWINDING Level

“Nifty 50 Intraday Key Levels | Buy & Sell Zones” 3rd Oct 2025“Want to learn more? Like this post and follow me!”
25,073 → Above 10m closing Shot Cover Level
25,070 → Below 10m hold PE By Safe Zone
24,988 → Above 10m hold CE By Entry Level
24,980 → Below 10m hold PE By Risky Zone
24,888 → Above 10m hold Positive Trade View
24,790 → Above Opening S1 hold CE / Below Opening R1 hold PE
24,690 → Above 10m hold CE By Level / Below 10m hold PE By Level
24,590 → Above 10m hold CE By Safe Zone
24,580 → Below 10m hold Unwinding Level

“Nifty 50 Key Levels & Trade Zones – 29th Sept 2025”“Follow me and like this post for more learning tips!”
24,870 → Above 10m closing Shot Cover Level
24,870 → Below 10m hold PE By Safe Zone
24,778 → Above 10m hold CE By Entry Level
24,770 → Below 10m hold PE By Risky Zone
24,718 → Above 10m hold Positive Trade View
24,718 → Below 10m hold Negative Trade View
24,620 → Above Opening S1 10m hold CE By Level
24,620 → Below Opening R1 10m hold PE By Level
24,520 → Above 10m hold CE By Level
24,520 → Below 10m hold PE By Level
24,418 → Above 10m hold CE By Safe Zone Level
24,418 → Below 10m hold Unwinding Level

“Nifty 50 Key Levels & Trade Zones – 25th Sept 2025”
“Follow me and like this post for more learning tips!”
25,380 → Above 10m closing → Short Cover Level (CE Safe Zone)
25,233 → Above 10m hold CE (Entry Level)
/ Below 10m hold PE (Risky Zone)
25,133 → Above 10m hold → Positive Trade View
/ Below 10m hold → Negative Trade View
24,980 → Above Opening S1 hold CE (Buy Level)
/ Below Opening R1 hold PE (Sell Level)
24,870 → Above 10m hold CE (Buy Level)
/ Below 10m hold PE (Sell Level)
24,730 → Above 10m hold CE (Safe Zone)
/ Below 10m hold UNWINDING Level

18 sep 2025 support–resistance trading plan Key Levels
25,518 → Above 10m Closing Short Cover Level
(If sustained above, short covering possible)
25,500 Zone → Below 10m Hold PE Safe Zone
25,420 → Above 10m Hold CE Entry Level
Below 10m Hold PE Risky Zone
25,333 → Above 10m Hold Positive Trade View
Below 10m Hold Negative Trade View
25,270 → Above Opening S1 10m Hold CE Buy Level
Below Opening R1 10m Hold PE Buy Level
25,170 → Above 10m Hold CE Buy Level
Below 10m Hold PE Buy Level
25,070 – 25,060 →
25,070 = Above 10m Hold CE Safe Zone
25,060 = Below 10m Hold UNWINDING Level

#Nifty may see fall on Monday?Nifty appears to be in its minuette wave 4 and may resume its downtrend move on September 1 to complete wave 5.

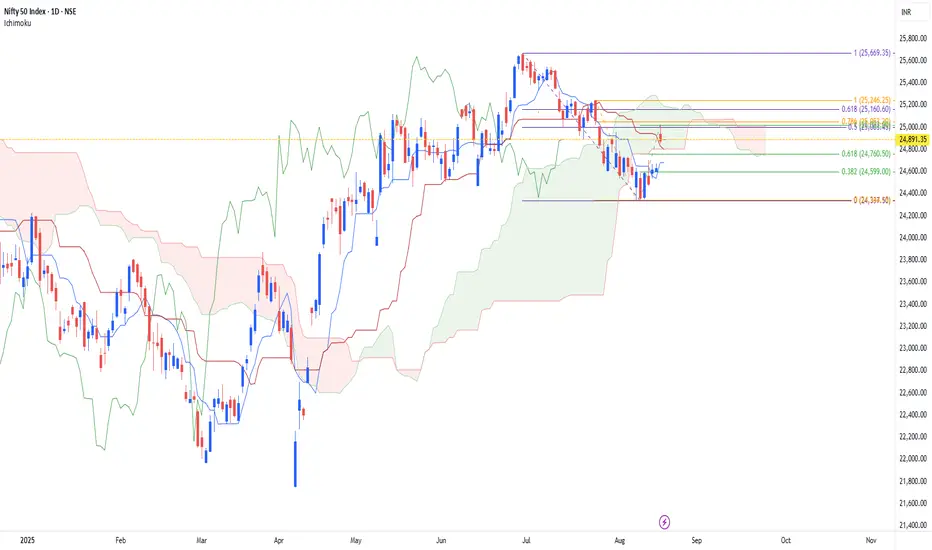
Nifty Short Entry Based on TRIPLE CROWN Theory
combining specific Fibo Retracement level, identified areas that can be used to go short in NIFTY
range to go short is - 25160 to 25000, which got triggered yesterday,
let us go for short till yesterday's high is not breached
target will be 24760 and 24600 and then 24340
stop can be placed 25000
this trade is purely based on entry when the price falls in TCZ (The Triple Crown Zone), which is price zone based on FIBO RETRACEMENT LEVELS IN A SPECIFIC ORDER
note :-
more then entering the trade
it will be more interesting to understand this theory and its impact if price stays in TCS zone today and how it reacts here on
stay tuned
have a good day to all
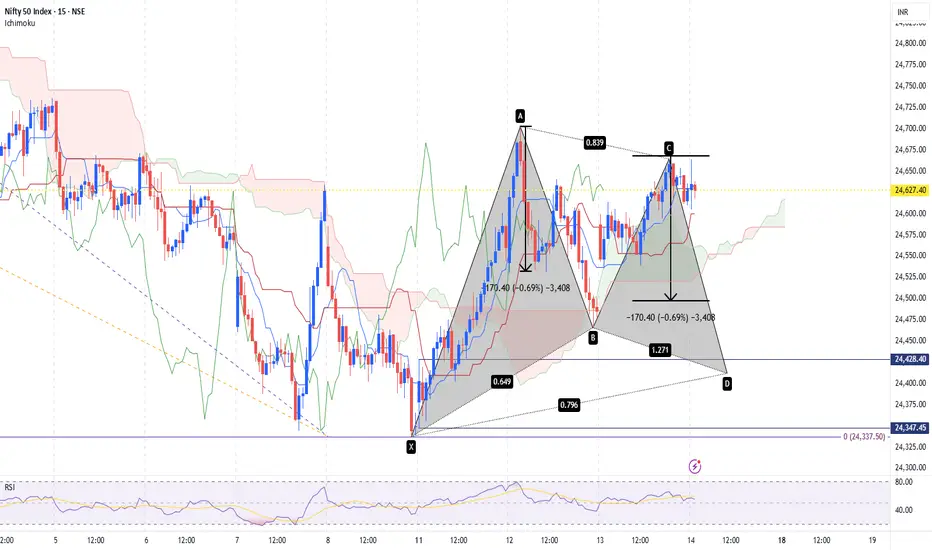
Nifty Viewusing Two Step Fibo strategy, gartley in other words
combining with symmetric price concept
eyeing for 2 target levels
1 - 24500
2 - 24400
lets wait n watch price action
August 13, 2025 trading plan prediction for tomorrow24,728 –
Above: 10m closing → Short Cover Zone.
Below: 10m hold PE → Safe Zone for Puts.
24,628 –
Above: 10m hold CE → Entry Level for Calls.
Below: 10m hold PE → Risky Zone for Puts.
24,528 –
Above: Positive trade bias.
Below: Negative trade bias.
24,428 –
Above Opening S1: 10m hold CE → Bullish bias.
Below Opening R1: 10m hold PE → Bearish bias.
24,330 –
Above: 10m hold CE → Buy Level for Calls.
Below: 10m hold PE → Sell Level for Puts.
24,210 –
Above: 10m hold CE → Safe Zone for Calls.
Below: 10m hold → Unwinding Level.
24,173 –
Day UP Fibonacci Support 0.382.

12 August 2025 Nifty50 brekout and Breakdown leval
📊 Key Levels & Trade View
24,690 –
Above 10m close: Short Cover Level (CE bullish momentum)
Below 10m: Hold PE in safe zone.
24,523 –
Above 10m: CE buy (entry level)
Below 10m: PE hold (risky zone).
24,423 –
Above 10m: Positive trade view.
Below 10m: Negative trade view.
24,310 –
Above Opening S1: Hold CE.
Below Opening R1: Hold PE.
24,173 (Fib 0.382 Support) –
Watch for reversal or breakdown.
24,110 –
Above 10m: CE buy level.
Below 10m: PE buy level.
23,990 –
Above 10m: CE safe zone level.
Below 10m: Unwinding zone (bearish).
23,711 (Fib 0.5 Support) –
Strong support; breakdown could extend selling.
💡 Trading Bias for Today
Bullish above 24,423 with targets 24,523 → 24,690.
Bearish below 24,310 with targets 24,173 → 24,110 → 23,990.
Avoid trading in between 24,310–24,423 unless there’s strong momentum

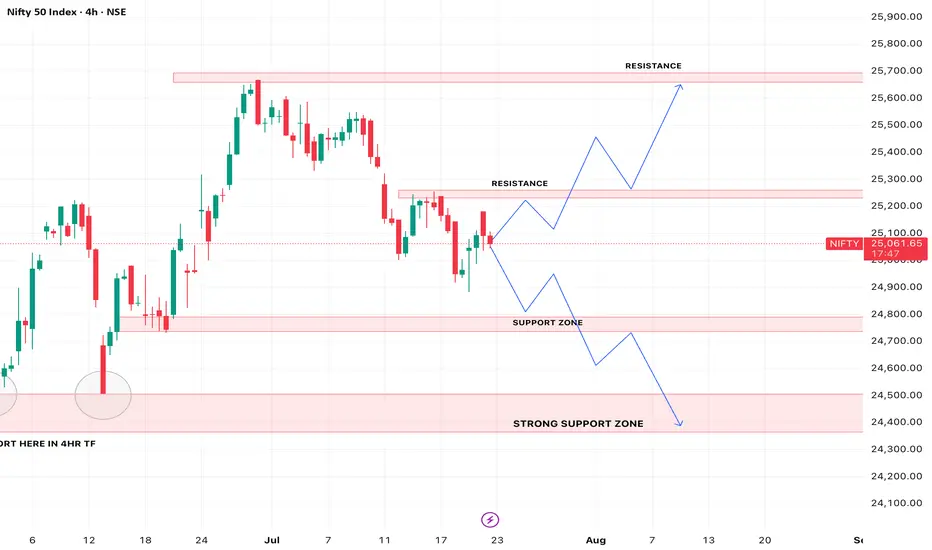
NIfty50 analysis for 23/07/2025nifty has been in a bearish trend over the past week and recently faced a strong rejection from the 25180–25200 zone, which aligns with a key resistance level on the daily time frame. price action suggests a possible retracement toward the 24780–24800 support zone. this area holds significance as a potential demand zone. it’s crucial to observe price behavior around this level — a strong reaction here could offer clues for the next directional move. wait for confirmation before taking any fresh positions.
Bank nifty correction start now?Bank Nifty
Current Price: 56,791.95 (Spot)
Bank Nifty has reversed lower from the resistance trendline, confirming selling pressure near higher levels.
A Dark Cloud Cover candlestick pattern combined with an emerging M-top formation indicates potential short-term bearish sentiment.
It can short here or any bounce use as shorting opportunity for target 56,056
Major resistance is 57,400-57,700
The index is forming a rising wedge pattern, a bearish structure suggesting potential for deeper correction if key support levels are breached.
Key Support Levels:
Immediate support is identified at 56,056 (trendline support).
A decisive close below 56,056 may accelerate selling pressure, opening downside targets toward: 55,342 , 53,908

NIFTY
ALWAYS TAKE TRADE WITH CONFIRMATION
Note : Trading in any financial market is very risky. I post ideas for educational purpose only. It is not financial advice. Do not hold us responsible for any potential loss you may incur. Please consult your financial adviser before trading.

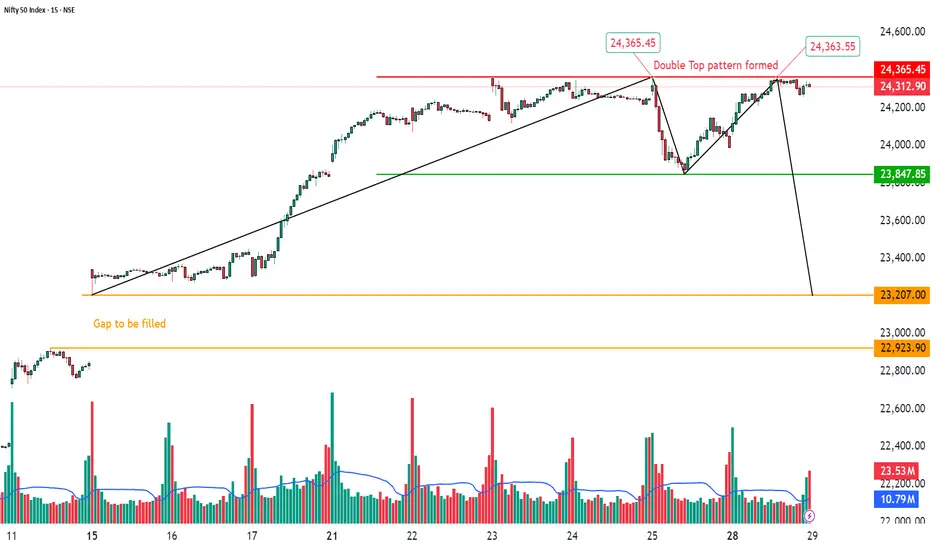
Double Top Pattern Formation with Gap Below | 15-Min Chart🏦 NIFTY 50 INDEX – Double Top Pattern Formation with Gap Below | 15-Min Chart
📅 Date: April 28, 2025
📈 Timeframe: 15-Minute
🔍 Index: Nifty 50 (NSE)
📌 Technical Overview:
Nifty 50 has formed a Double Top pattern on the 15-minute chart around the 24,365 zone, a classic bearish reversal structure.
The price faced rejection at the previous high, signaling caution. Immediate support lies at 23,847, and a breakdown below this level could open downside momentum toward the gap area visible on the chart.
🧩 Chart Pattern:
Double Top identified at 24,365 levels (marked in red).
Neckline support positioned at 23,847 (green line).
A black trendline breakdown already visible, strengthening bearish bias.
Below 23,847, focus shifts to the gap fill zone between 23,207 and 22,923 (orange highlighted).
🔍 Key Price Levels:
Resistance: 24,365
Immediate Support: 23,847
Gap Zone Support: 23,207–22,923
CMP: 24,312.90
A clear breakdown below 23,847 could accelerate the fall toward the gap area.
📊 Volume Analysis:
Increasing selling volume observed near the second top.
The breakout attempt was met with significant volume resistance, hinting at supply dominance.
🧠 Observational Bias:
As long as Nifty stays below 24,365 and breaches 23,847 decisively, bears may remain in control. Traders should watch for either a gap fill attempt or a possible bounce if price retests 23,847 from below.
NIFTY IS SELL ON RISE ONLY | SELL ZONE 22600 - 22800Dear Traders,
The Nifty index is currently approaching a key resistance level at 23,600 - 23650 and another level is 23800, presenting a potential sell-on-rise opportunity. We suggest considering a position in the 23750 Put Option (expiry: April Month), based on the movement of the Nifty spot level.
Target Levels: ₹23,350, ₹23,250, ₹23,150
Stop Loss (SL): ₹23,920
Wishing you successful trading.
Best regards,
OptionsDaddy Research Team

Nifty50 If a hourly candle sustains or Close below white trend line then it could test 22490 -- 22505 within 11th March .
Disclaimer :
It's a personal view not a financial advice and I assume no responsibility and liability whatever outcome arises.

Nifty Downtrend Movement upto 23200Symbol Nifty
Timeframe 15 min
Analysis Breakout from the channel. Down trend movement .Target expect is 23200
We hope our analysis is adding value to your trading journey.
Please note: Published ideas are for educational purposes only. Trade at your own risk.
Also, please respect the risk - stop loss (SL) should not be more than 2% of the capital.
DISCLAIMER: We are not SEBI registered. All the ideas posted in this channel are solely for educational purposes."

NIFTY 50 - BEARISH TREND WITH RESISTANCE ZONES AHEADSymbol - NIFTY50
CMP 23260
The Nifty50 is currently in a downtrend and is trading within a falling wedge pattern, indicating potential for a bearish move in the near future. At present, the index is trading at a resistance zone, specifically between 23260-23300, with additional resistance zones positioned further upwards. Given these technical factors, there is a strong expectation for a sell-off from the current levels. The downside targets are expected to be around the lows that were formed a few days back, which are near the 22800 level and possibly lower.
From a broader perspective, the Nifty50's technical structure suggests that further downward movement is likely as the price faces resistance and struggles to break above key levels. Therefore, traders should be cautious of any bullish reversal in the immediate term and instead focus on potential downside targets.
Key resistance levels to watch are near 23260-23300, with additional resistance higher up. Support is anticipated at the 22900-22830 level and below. Given the current pattern and resistance zone, a short-term bearish outlook seems more probable, with a potential continuation of the downtrend.

Nifty bearish viewhello, viewers.
As we can see the 1 day swing high low and applied fib. retracement, as 1st fib. ret market retrace 0.5 level which indicates the low breaking probability for new low.
And in 2nd new swing high low as per fib.ret. law 2nd swing golden ratio and 0.5 level also break low. which will indicates thee market will make new low at fib. support if low breaks then new support will be draw at chart which is of 1.382 and 1.50 of 2nd fib retracement.
disclaimer = Everything drawn at chart, trade at your own risk.
