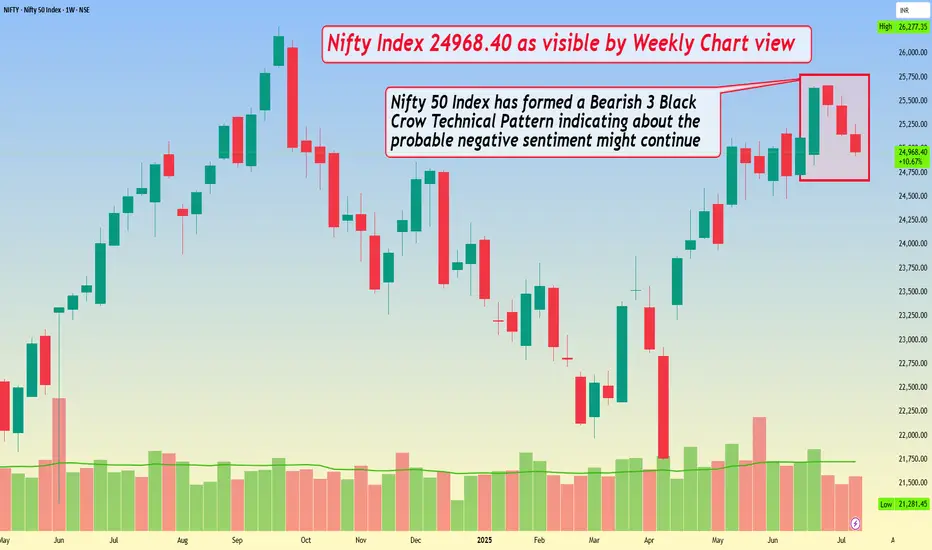
Nifty Index 24968.40 as visible by Weekly Chart viewNifty Index 24968.40 as visible by Weekly Chart view
- Nifty 50 Index has formed a Bearish 3 Black Crow Technical Pattern indicating about the probable negative sentiment might continue
- Nifty is also closely forming a sliding Bearish Double Top from ATH 26277.35 to current top 25669.35, which again syncs with the negative sentiment trend trajectory
Niftytechnicalanalsyis
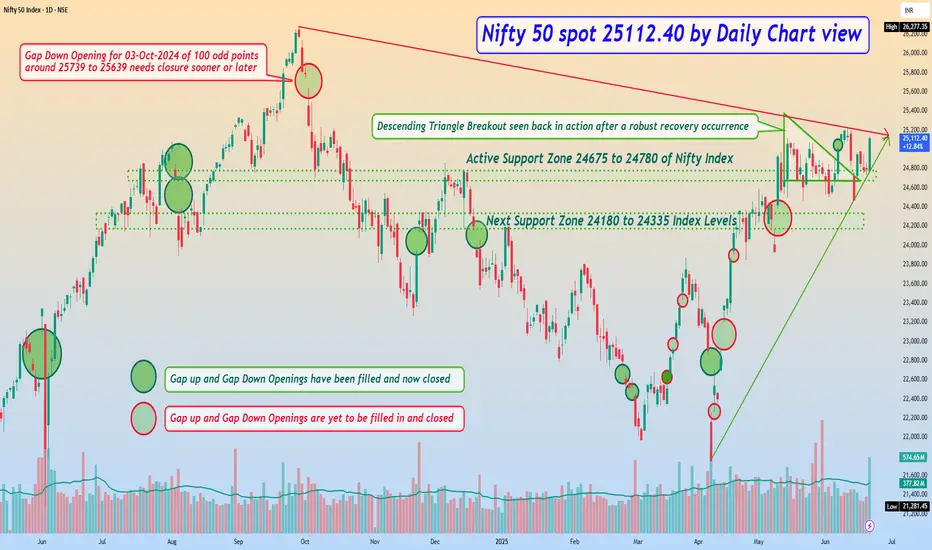
Nifty 50 spot 24112.40 by Daily Chart view - Weekly update**Nifty 50 spot 24112.40 by Daily Chart view - Weekly update*
- Active Support Zone 24675 to 24780 of Nifty Index
- Next Support Zone 24180 to 24335 of Nifty Index Levels
- Resistance Zone seen at 25200 to 25335 of Nifty 50 Index Levels
- Descending Triangle Breakout seen back in action after a robust recovery occurrence
- *Rising Support Trendline seems to have come into active mode but yet needs a stronghold*
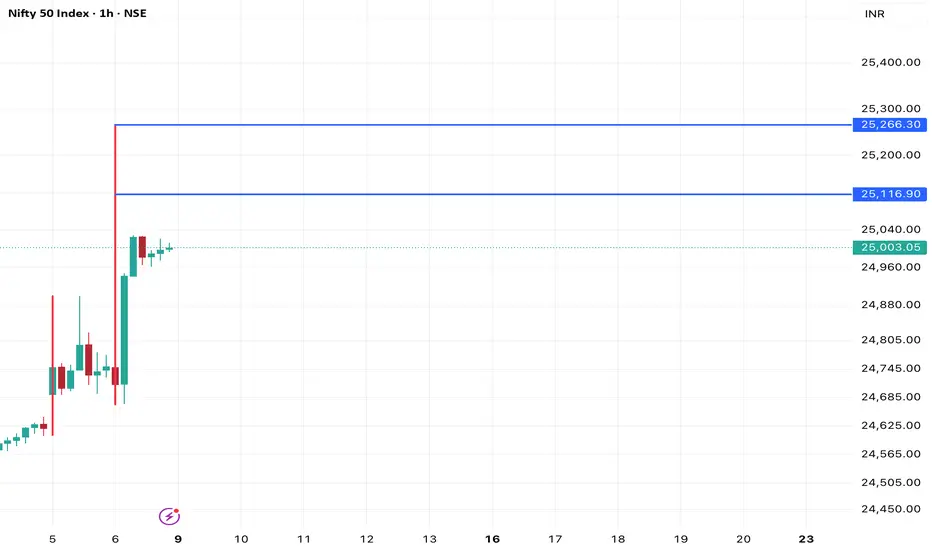
Nifty | Weekly Analysis June 9-13 2025Hi,
I am sharing view on nifty movement for coming week, it can create HH and HL formation and next possible retracement levels are 25117 and 25266.
Disclaimer: This is only for educational purpose.
Thanks
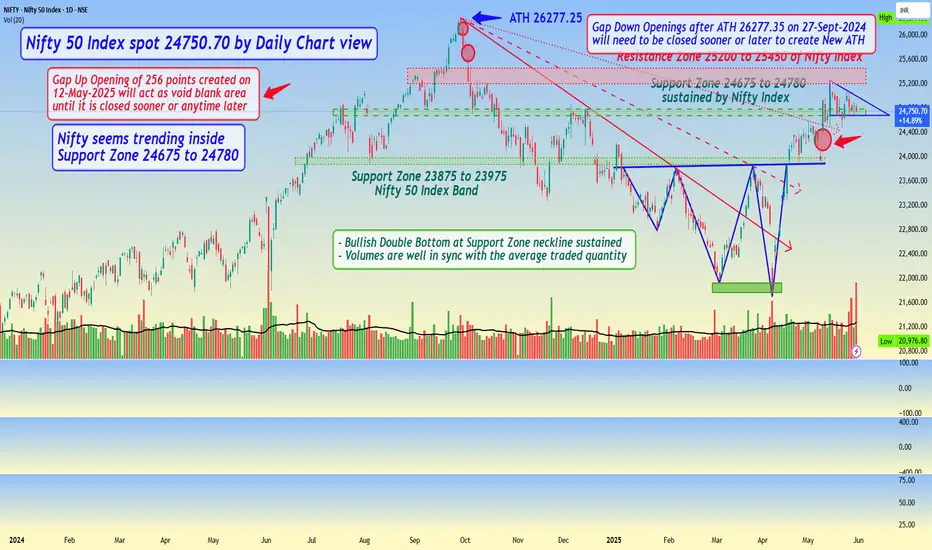
Nifty 50 Index spot 24750.70 by Daily Chart view - Weekly UpdateNifty 50 Index spot 24750.70 by Daily Chart view - Weekly Update
- Resistance Zone 25200 to 25450 of Nifty Index
- Support Zone 24675 to 24780 sustained by Nifty Index
- Nifty seems stuck within Descending Triangle pattern above Support Zone, needs to breakout from it for fresh upside
- Gap Up Opening of 256 points created on 12-May-2025 will act as void blank area until it is closed sooner or anytime later
- Gap Down Openings made after the ATH 26277.35 on 27-Sept-2024 will need to be closed sooner or later to create New ATH
Breakout Building Up from Falling Wedge PatternIndex: Nifty 50
Timeframe: 15-minute
Date: 21st May 2025
Price Action Insight
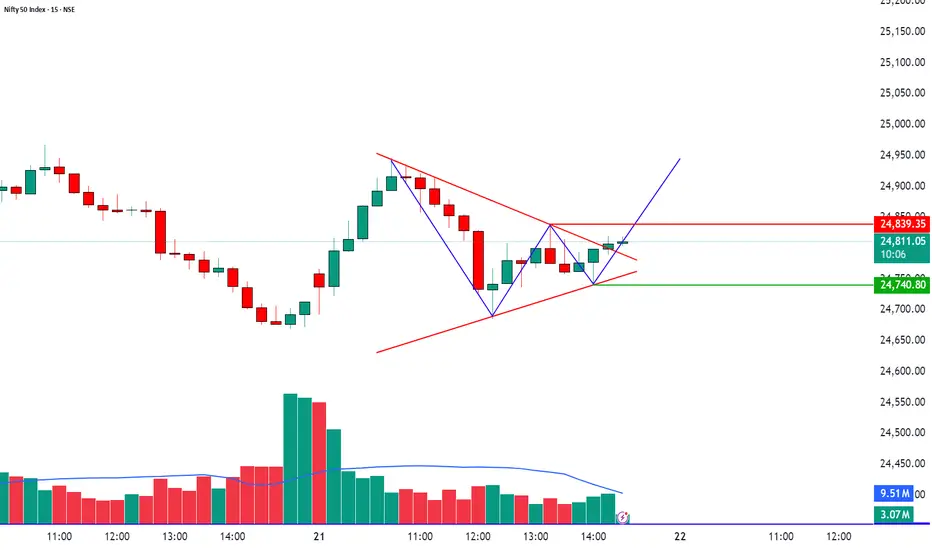
After a strong sell-off, NIFTY 50 formed a solid V-shaped recovery, followed by a series of higher lows, indicating a shift in momentum from sellers to buyers. Price is now consolidating near a key resistance level at 24,839.35, suggesting a potential breakout or rejection setup.
Chart Patterns in Focus
Falling Wedge (Bullish Reversal)
Breakout occurred after price compressed into the wedge.
A textbook reversal pattern signaling buying interest returning.
Bullish Flag / Pennant Formation
Post-wedge breakout, price is consolidating in a narrow range (flag).
Typically seen as a continuation pattern before another bullish leg.
Trendline Support
Price is holding above an ascending trendline, forming higher lows, reinforcing bullish bias.
Volume Analysis
Volume spiked during the wedge breakout – confirming buyer participation.
Current consolidation shows declining volume, indicating a possible volume expansion ahead.
Watch for a volume surge during breakout or breakdown for trade confirmation.
Educational Insight: How to Read This Setup
Why this matters for traders:
A falling wedge + bullish flag is a high-conviction combo.
Volume contraction during consolidation is healthy and often precedes explosive moves.
Price rejecting or sustaining above resistance gives traders directional edge.
Always wait for confirmation with price action + volume to avoid fakeouts.
Trade Scenarios
✅ Bullish Scenario (Long Trade)
Entry: Above 24,839.35
Target Zones: 24,900 / 24,950
Stop-Loss: Below 24,740.80 (below consolidation and trendline support)
Confirmation: Breakout candle with above-average volume
❌ Bearish Scenario (Short Trade)
Entry: Below 24,740.80
Target Zones: 24,650 / 24,580
Stop-Loss: Above 24,839.35
Confirmation: Breakdown from trendline support + rise in selling volume
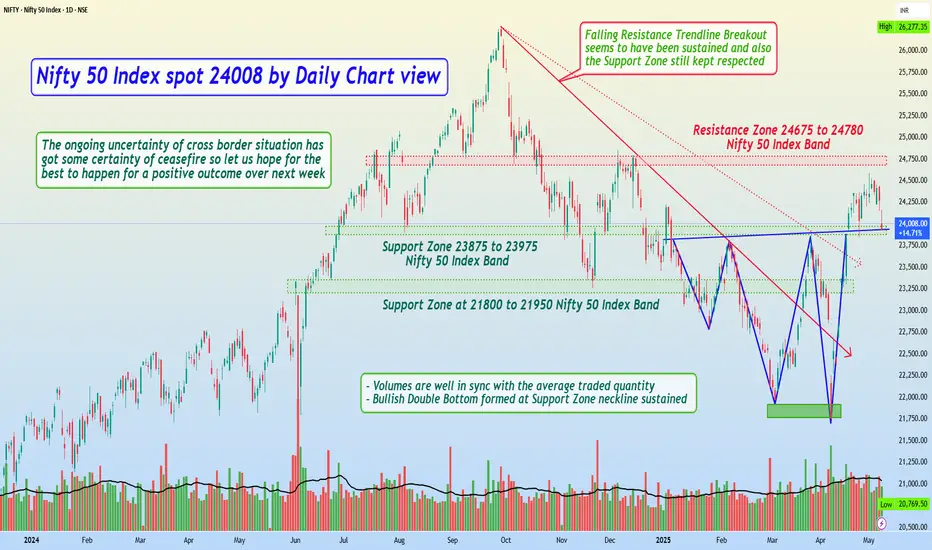
Nifty 50 Index spot 24008 by Daily Chart viewNifty 50 Index spot 24008 by Daily Chart view
- Resistance Zone 24675 to 24780 Nifty 50 Index Band
- Nifty is at Support Zone 23875 to 23975 Nifty 50 Index Band
- *Nifty having sustained above the Support Zone is bound to a bounce back by the cross border mellowed down situation*
- *The ongoing uncertainty of cross border situation has got some certainty of ceasefire so let us hope for the best to happen for a positive outcome over next week*
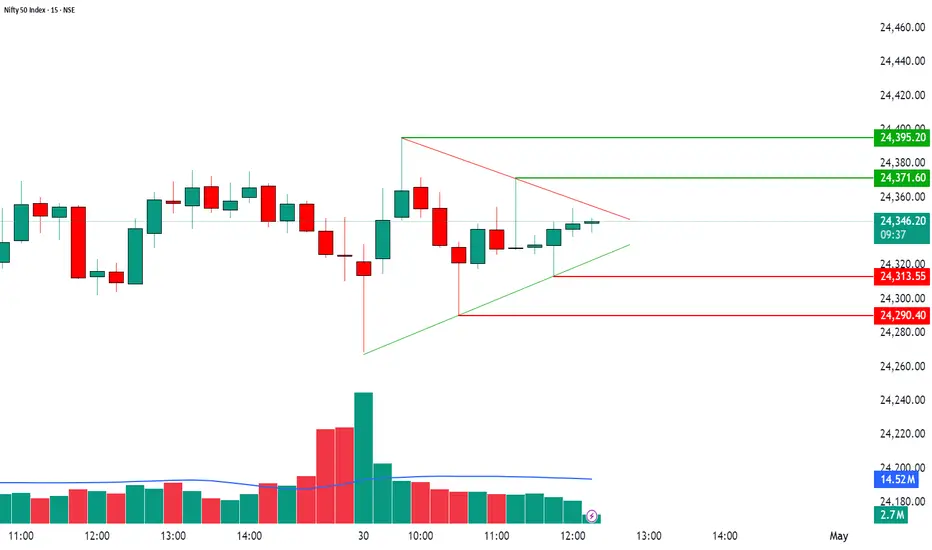
Setup – Watch This Triangle Breakout! 🔺 Nifty50 Triangle Breakout – Big Move Loading? 📊
📆 30th April | 15-Minute Chart
Nifty is tightly squeezed inside a symmetrical triangle, and a breakout or breakdown looks imminent!
🔍 Levels to Watch:
📈 Breakout Above: 24,371.60 → Possible Level: 24,395.20+
📉 Breakdown Below: 24,313.55 → Possible Level: 24,290.40-
📊 Volume is compressing – this usually signals a powerful move ahead.
Wait for clear candle confirmation with volume before entering. 🔔
💬 Patience pays. Trade the breakout, not the noise!
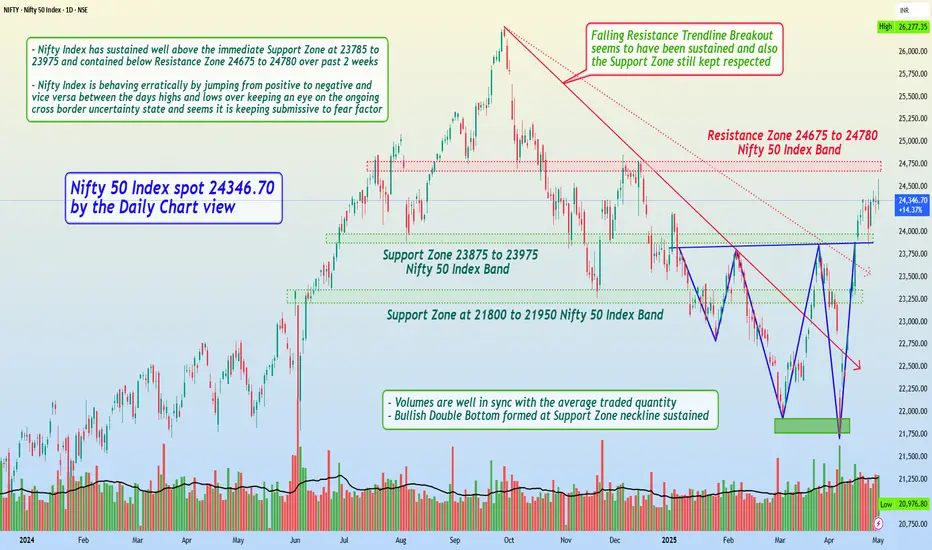
Nifty 50 Index spot 24346.70 by Daily Chart view - Weekly UpdateNifty 50 Index spot 24346.70 by the Daily Chart view
- Support Zone 23875 to 23975 Nifty 50 Index Band
- Resistance Zone 24675 to 24780 Nifty 50 Index Band
- Volumes are well in sync with the average traded quantity
- Nifty Index has sustained well above the immediate Support Zone at 23785 to 23975 and contained below Resistance Zone 24675 to 24780 over past 2 weeks
- Nifty Index is behaving erratically by jumping from positive to negative and vice versa between the days highs and lows over keeping an eye on the ongoing cross border uncertainty state and seems it is keeping submissive to fear factor
- Let us hope for the best to happen for a positive outcome over the coming days/weeks and foresee Nifty 50 Index to gradually and steadily progress towards the current ATH 26277.35 for a New ATH, in line with the Bank Nifty Index strides
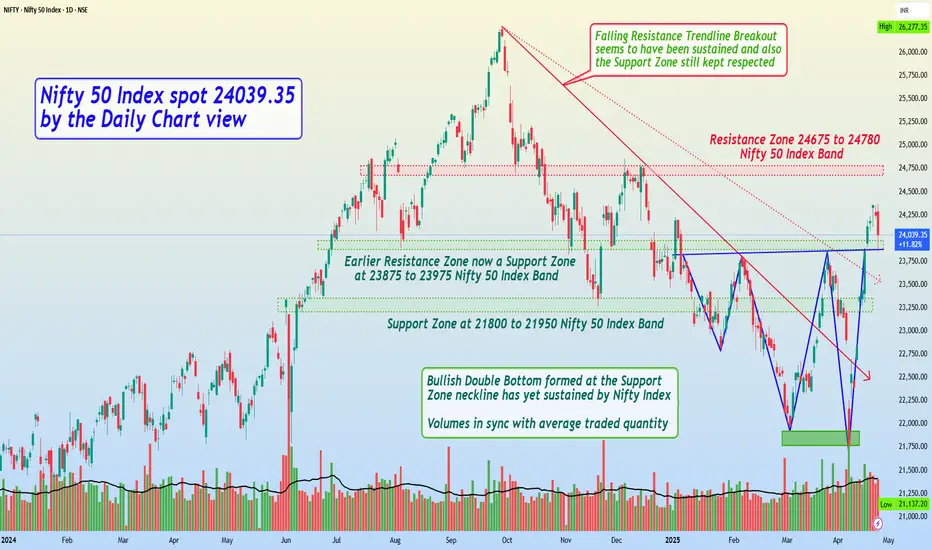
Nifty 50 Index spot 24039.35 by Daily Chart view - Weekly UpdateNifty 50 Index spot 24039.35 by the Daily Chart view - Weekly Update
- Resistance Zone 24675 to 24780 Nifty 50 Index Band
- Volumes are in good sync with the average traded quantity
- Both the Falling Resistance Trendlines have been decently maintained todate
- Earlier Resistance Zone now a Support Zone at 23875 to 23975 Nifty 50 Index Band
- Bullish Double Bottom formed at the Support Zone neckline has yet sustained by Nifty Index
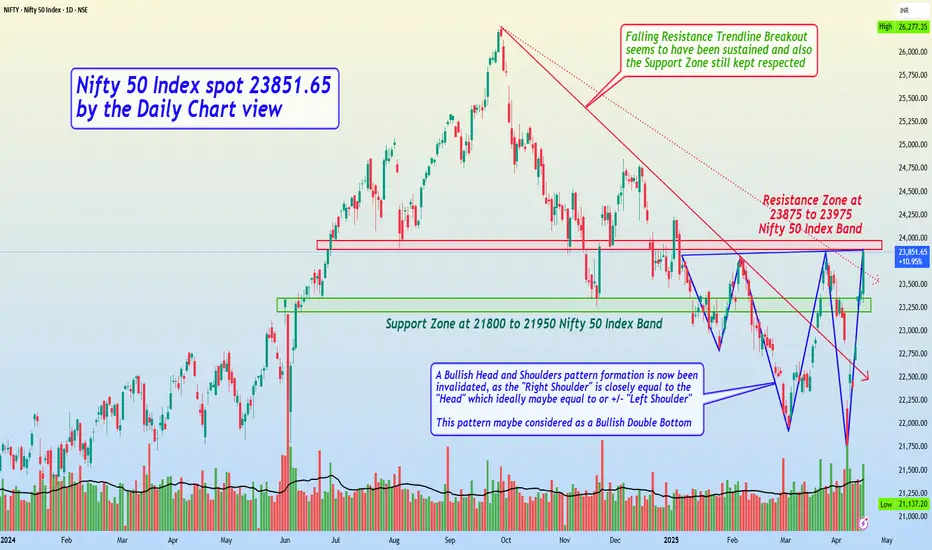
Nifty 50 Index spot 23851.65 by Daily Chart view - Weekly UpdateNifty 50 Index spot 23851.65 by the Daily Chart view - Weekly Update
* Support Zone at 21800 to 21950 Nifty 50 Index Band
* Resistance Zone at 23875 to 23975 Nifty 50 Index Band
* A Bullish Head and Shoulders pattern formation is now been invalidated, as the "Right Shoulder" is closely equal to the "Head" which ideally maybe equal to or +/- "Left Shoulder". This pattern maybe considered as a Bullish Double Bottom
Nifty 50 Index spot 22904.45 by Daily Chart viewNifty 50 Index spot 22904.45 by Daily Chart view
- Resistance Zone at 23875 to 23975 for Nifty 50 Index Band
- Can we expect the Right Shoulder depth act as a Support base alike of the Left Shoulder depth near 22700 to 22800 ???
- If the Right Shoulder gets sustained, a Support base in sync with the Left Shoulder of the Bullish Head & Shoulder pattern may get activated
- Let us hope for the best to happen expecting some fresh breather over the next week basis the fact that, the Markets are always Supreme to look up to ......

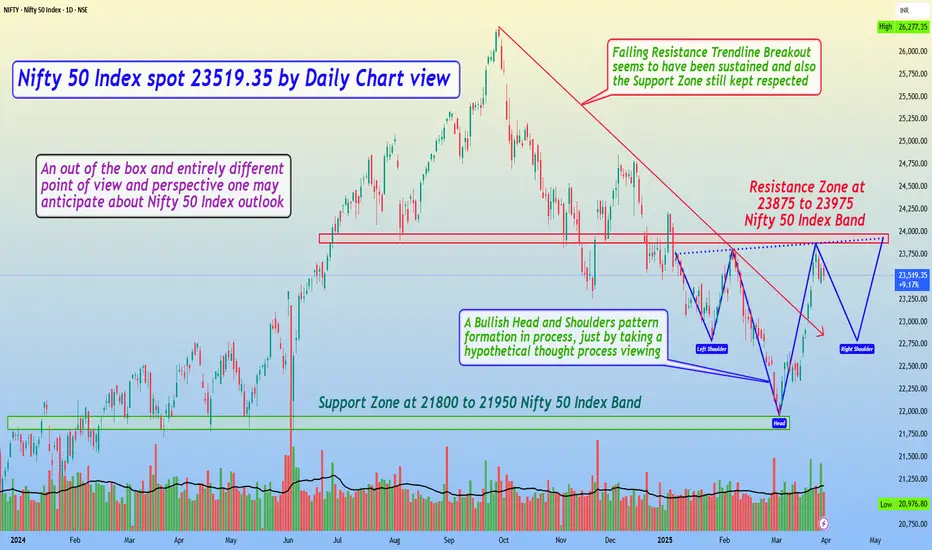
Nifty 50 Index spot 23519.35 by Daily Chart view - Weekly updateNifty 50 Index spot 23519.35 by Daily Chart view - Weekly update
- Support Zone at 21800 to 21950 Nifty 50 Index Band
- Resistance Zone at 23875 to 23975 Nifty 50 Index Band
- Falling Resistance Trendline Breakout seems to have been sustained and also Support Zone still kept respected
- A Bullish Head and Shoulders pattern formation in process, just by taking a hypothetical thought process viewing
- An out of the box and entirely different point of view and perspective one may anticipate about Nifty 50 Index outlook
- Going by this Hypothetical H&S probability for the Nifty 50 Index Chart, we may anticipate good fire crackers to observe
- As such this is just a high level technical chart pattern formation and the Market are always Supreme to work in their own ways
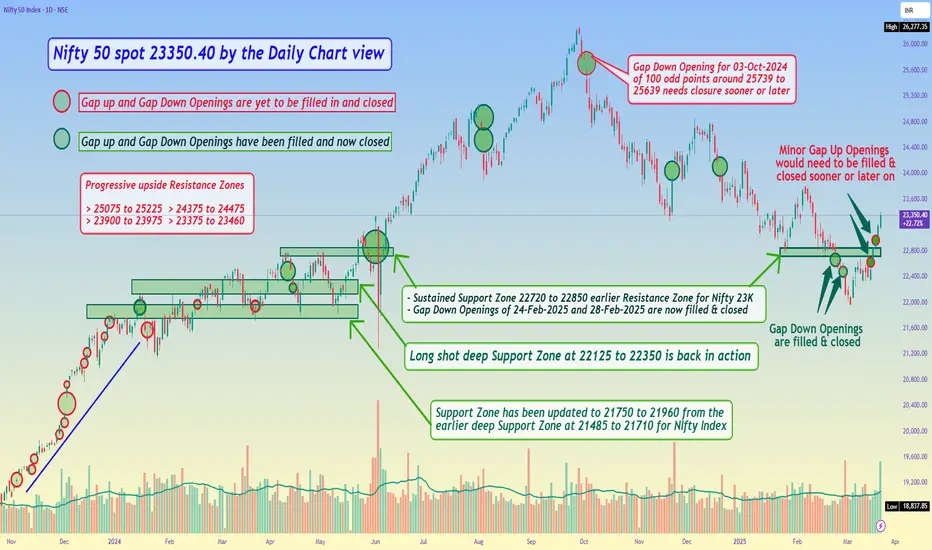
Nifty 50 spot 23350.40 by the Daily Chart view - Weekly updateNifty 50 spot 23350.40 by the Daily Chart view - Weekly update
- Sustained Support Zone 22720 to 22850 earlier Resistance Zone for Nifty 23K
- Minor Gap Up Openings around above Support Zone would need to be filled & closed sooner or later on
- Next set of Resistance Zones seen at indicative Nifty 50 Index levels of 23375 to 23460 and 23900 to 23975
Nifty 50 Index 22124.70 by Daily Chart view: Different ViewpointNifty 50 Index 22124.70 by the Daily Chart view - Different Viewpoint
A different point of view for the Nifty 50 Index Technical Chart Setup Analysis. This is solely and purely my personal perspective for the Bearish Head & Shoulders pattern's. I will be happy to welcome and get your fine line pointers for the improvement on the Technical Analysis for this Chart Setup. Thank you in advance to One and All.
The 1st H&S Bottom is broken down and now need to look forward, if ..... Nifty 50 Index touches the 2nd H&S Bottom or takes an early reversal ..... Hope for the best to happen and keeping fingers crossed. God Bless All.

Nifty 50 spot 22124.70 by the Daily Chart viewJust sharing an update in continuation over the last week Nifty 50 Index chart data reading.
Nifty 50 spot 22124.70 by the Daily Chart view
- Next Support Zone at 21485 to 21710 Level
- Gap Down Openings of 24-Feb-2025 and 28-Feb-2025 would need to be closed

Nifty 50 spot 22795.90 by the Daily Chart viewNifty 50 spot 22795.90 by the Daily Chart view
- Nifty 50 Index 22775 to 22950 Support Band is yet sustained
- Long shot deep Support Zone seen at 22125 to 22350 which for now seems bit (un)likely by current technical chart status setup
- Just a flag to highlight : Nifty Index had dipped up to 22720 in recent past few days and similar levels was Resistance Level in April 2024 for 23K Index target
- Few of the Gap Ups and Gap Down openings, yet are remaining to get closed and filled in below the Old Long Shot Support Zone at 22125 to 22350 for Nifty Index levels

Nifty 50 spot 22929.25 by the Daily Chart viewNifty 50 spot 22929.25 by the Daily Chart view
- Just an FYI to note, for the current status of the Nifty 50 Index Daily Closure
- Nifty 50 Index 22775 to 22950 Support Band is yet sustained and nothing more to quote

Nifty 50 spot 22985.25 by the Daily Chart viewNifty 50 spot 22985.25 by the Daily Chart view
- Sustained Support Zone for Nifty 50 Index 22775 to 22950 levels
- Will the Support Zone pass the 2nd retest after 1st test done on 27-January-2025
- Let's hope for the best to happen and look forward to see how things unfold going ahead

Nifty 50 23559.95 Daily Chart view - Update on 02-Feb-2025Nifty 50 spot 23559.95 by the Daily Chart view
- Resistance Zone 23900 to 23975 Index level
- Resistance Zone 23375 to 23460 turned to Support Zone still been sustained
- Nifty Daily Chart view of 02-February-2025

Nifty Trade Setup & Commentary - Nifty is currently trading at 24,148
- Nifty overall structure is at a very crucial point where we have a make or break structure
- Important zone and area to watch for bulls will be 23,813 and if this gets breached or if we see a weekly closing below this I expect Nifty to free fall till 23,200 and then 21,285
- Nifty Demand and POI Zones: 21,285 and 23,200
- Nifty Supply Zones: 25,200
- If Nifty goes upto 25,200 and shows a relief rally dont consider or assume the bull run is back because we need to flip that zone and wait for nifty to make a weekly close above 25,200 if order to turn bullish again

Nifty Levels Update For Option Day Trading 01 Dec 2022 Nifty One Hour Chart Analysis For Intraday Trading
Nifty Down Side Targets
First Support Zone For Nifty - 18680 -18668
Second Support Zone For Nifty –18601 - 18609
Third Support Zone For Nifty – 18555-18544
Nifty Up Side Targets
First Resistance Zone For Nifty - 18780 -18768 ( Nifty Made new All Time High Today )
Importent Signal from Nifty Option Chain
PCR ratio as per Option Chain Analysis – 1.62 ( Bullish )
Max Pain As per Option Chain Analysis – 18700
Major Support as Per Nifty Open Interest Analysis - 18600 & 18500
Major Resistance as Per Nifty Open Interest Analysis - 18800 & 18900

Nifty Trade Plan for 22 AUG 2022Nifty Trade Plan for 22 AUG 2022
Nifty is bullishly biased for the day with a solid bullish closing and managed to close above key resistance level of 16600.
Expecting a gap up opening in Nifty around R1 resistance levels.
If R1/Bullish Break Out is taken on opening 15-30 min we can possibly expect T1/T2 Targets today.
In case if R1/Bullish Breakout is not taken out on opening then we can possibly expect Nifty to be retest Bullish Reversal Zone and then bounce back on upside.
Any compromised of CPR we can possibly expect S1 and then PDL.

Nifty Trade Setup for 19 JULY 2022Nifty Trade Setup for 19 JULY 2022
Nifty expected to have a gap down opening around S1 Support levels.
Any rejection from S1 support levels we can anticipate Nifty to test out PDL & then may be Virgin CPR levels of yesterday.
In case if S1 support holds good then we can anticipate Nifty to be in a range and might test again PDH.
Also do watch out the linked video.
