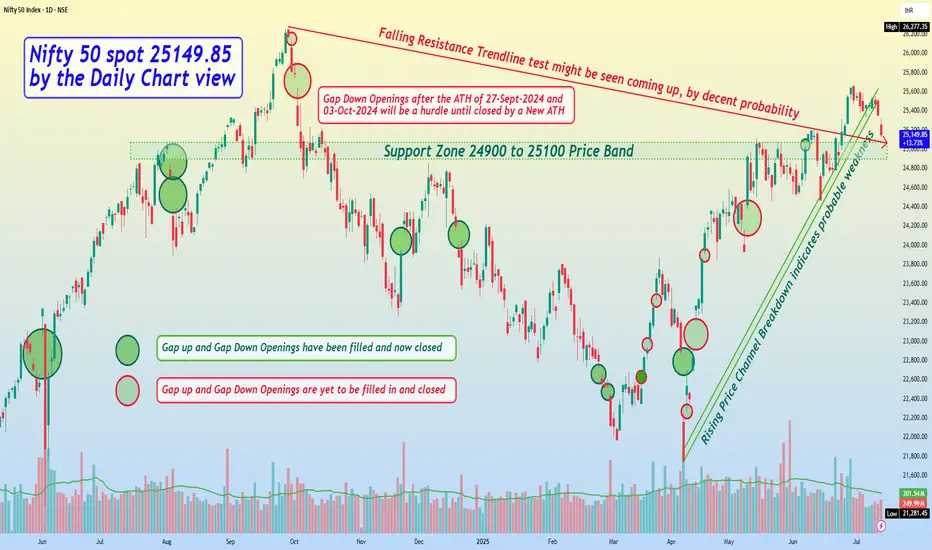
Nifty 50 spot 25149.85 by the Daily Chart view - Weekly updateNifty 50 spot 25149.85 by the Daily Chart view - Weekly update
- Support Zone 24900 to 25100 Price Band, yet sustained
- Next Support Zone seen at 24325 to 24500 of the Nifty Index
- Resistance Zone 25860 to 26035 then ATH 26277.35 of Nifty Index levels
- Rising Price Channel Breakdown indicates probable weakness to see following
- Falling Resistance Trendline test might be seen coming up, by decent probability
- Nifty Index keeping within self drawn limits and shying away at each attempt towards 26000
Niftytechnicalanalysis
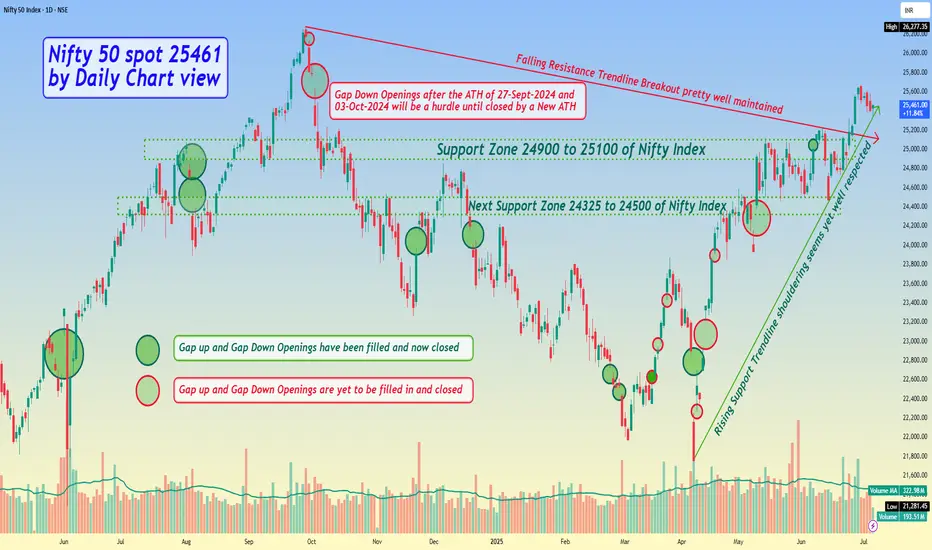
Nifty 50 spot 25461 by Daily Chart view - Weekly updateNifty 50 spot 25461 by Daily Chart view - Weekly update
- Support Zone 24900 to 25100 of Nifty Index
- Next Support Zone 24325 to 24500 of Nifty Index
- Resistance Zone 25860 to 26035 then ATH 26277.35 of Nifty Index levels
- Nifty Index retraced by unwarranted events and to a good extent by profit booking
- Nifty Index is shying away to sustain any upside towards 26000 and falling down flat face
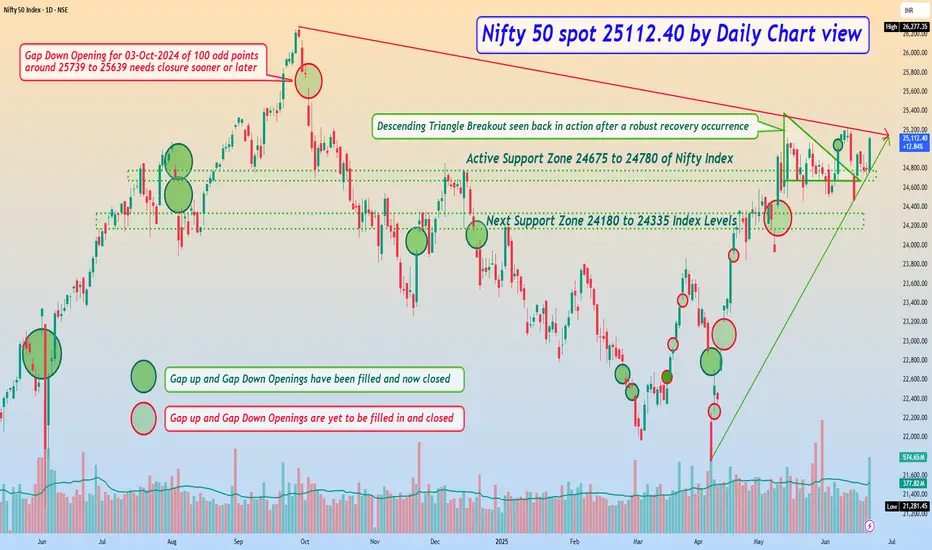
Nifty 50 spot 25112.40 by Daily Chart view - Weekly update*Nifty 50 spot 25112.40 by Daily Chart view - Weekly update*
- Active Support Zone 24675 to 24780 of Nifty Index
- Next Support Zone 24180 to 24335 of Nifty Index Levels
- Resistance Zone seen at 25200 to 25335 of Nifty 50 Index Levels
- Descending Triangle Breakout seen back in action after a robust recovery occurrence
- *Rising Support Trendline seems to have come into active mode but yet needs a stronghold*
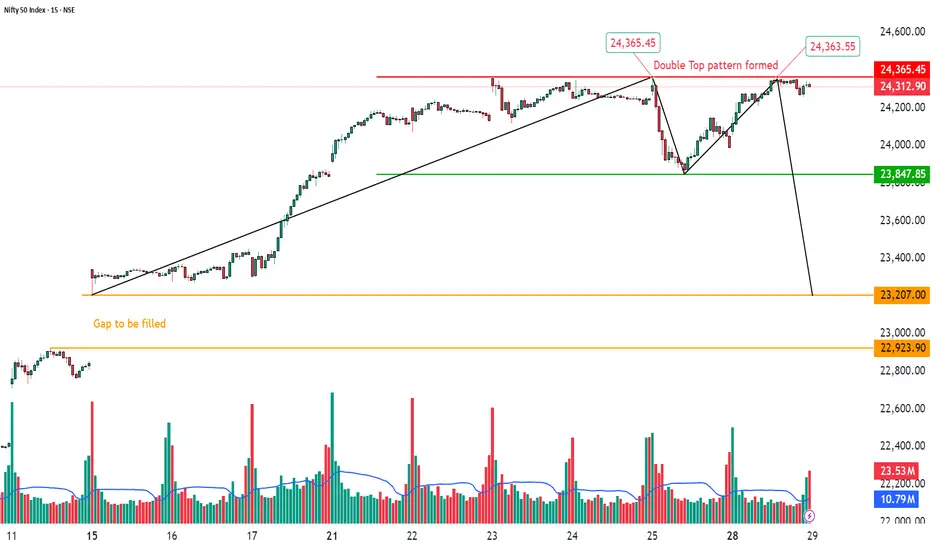
Double Top Pattern Formation with Gap Below | 15-Min Chart🏦 NIFTY 50 INDEX – Double Top Pattern Formation with Gap Below | 15-Min Chart
📅 Date: April 28, 2025
📈 Timeframe: 15-Minute
🔍 Index: Nifty 50 (NSE)
📌 Technical Overview:
Nifty 50 has formed a Double Top pattern on the 15-minute chart around the 24,365 zone, a classic bearish reversal structure.
The price faced rejection at the previous high, signaling caution. Immediate support lies at 23,847, and a breakdown below this level could open downside momentum toward the gap area visible on the chart.
🧩 Chart Pattern:
Double Top identified at 24,365 levels (marked in red).
Neckline support positioned at 23,847 (green line).
A black trendline breakdown already visible, strengthening bearish bias.
Below 23,847, focus shifts to the gap fill zone between 23,207 and 22,923 (orange highlighted).
🔍 Key Price Levels:
Resistance: 24,365
Immediate Support: 23,847
Gap Zone Support: 23,207–22,923
CMP: 24,312.90
A clear breakdown below 23,847 could accelerate the fall toward the gap area.
📊 Volume Analysis:
Increasing selling volume observed near the second top.
The breakout attempt was met with significant volume resistance, hinting at supply dominance.
🧠 Observational Bias:
As long as Nifty stays below 24,365 and breaches 23,847 decisively, bears may remain in control. Traders should watch for either a gap fill attempt or a possible bounce if price retests 23,847 from below.
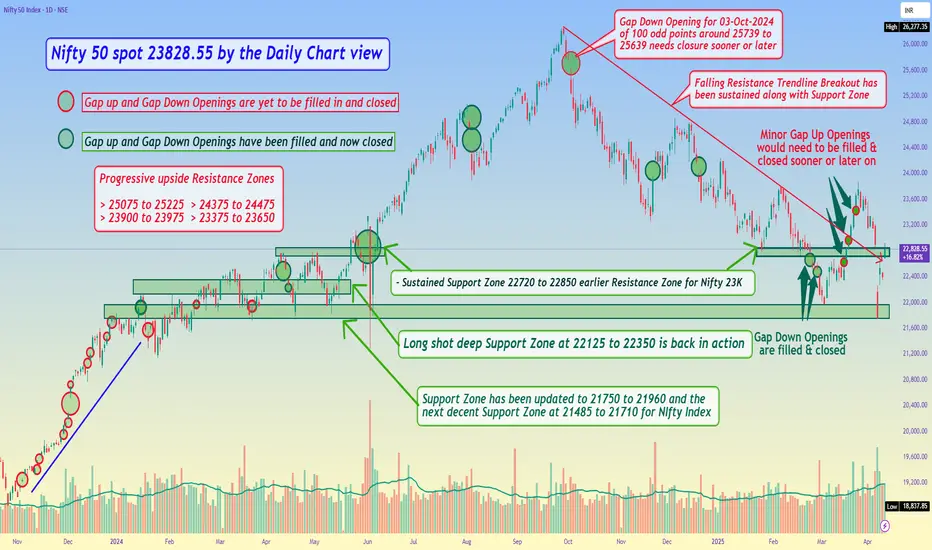
Nifty 50 spot 23828.55 by the Daily Chart view - Weekly UpdateNifty 50 spot 23828.55 by the Daily Chart view - Weekly Update
- Volumes attempting to sustain in sync with avg traded quantity
- Sustained Support Zone 22720 to 22850 earlier Resistance Zone for Nifty 23K
- Progressive indicative Resistance Zones seen at 25075 to 25225 > 24375 to 24475 > 23900 to 23975 > 23375 to 23650
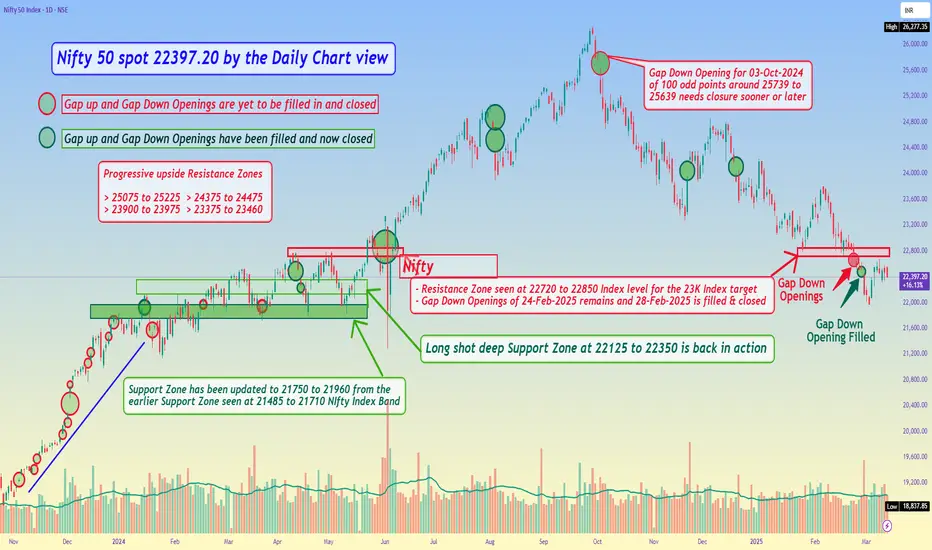
Nifty 50 spot 22397.20 by the Daily Chart view - Weekly updateNifty 50 spot 22397.20 by the Daily Chart view - Weekly update
- Resistance Zone seen at 22720 to 22850 Index level for the 23K Index target
- Gap Down Openings of 24-Feb-2025 remains and 28-Feb-2025 is filled & closed
- Long shot deep inline Support Zone seen at 22125 to 22350 is now back in action
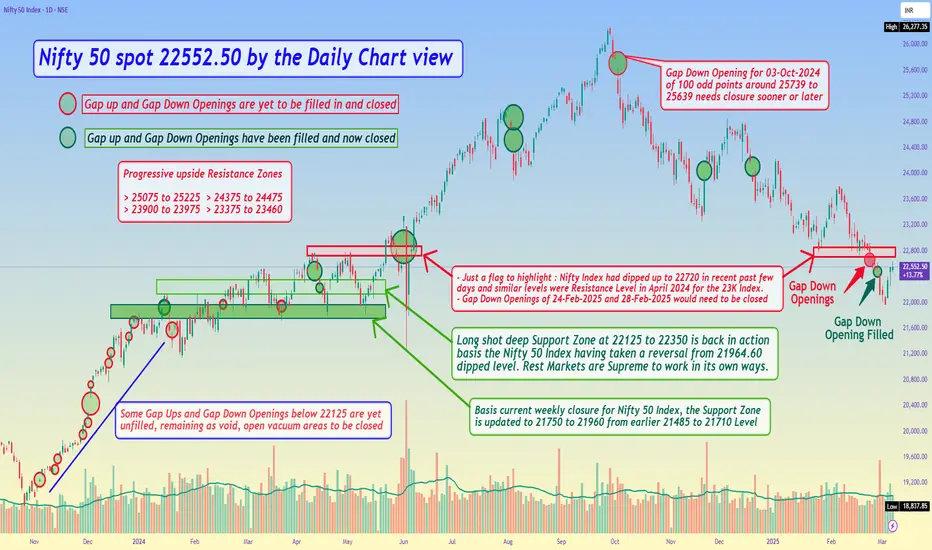
Nifty 50 spot 22552.50 by the Daily Chart view - Weekly Update*Nifty 50 spot 22552.50 by the Daily Chart view - Weekly Update*
- Gap Down Opening of 28th February, 2025 is now filled and has been closed
- Basis current weekly closure for Nifty 50 Index, the Support Zone is updated to 21750 to 21960 from earlier 21485 to 21710 Level
- Long shot deep Support Zone at 22125 to 22350 is back in action basis the Nifty 50 Index having taken a reversal from 21964.60 dipped level.
- Rest Markets are Supreme and work in their own ways. We can at most anticipate, expect and look forward for the best to happen by our assumptions
Nifty 50 Index spot 22929.25 by Monthly Chart viewNifty 50 Index spot 22929.25 by Monthly Chart view
- Nifty 50 Index trending along the Rising Support Trendline 4th time over since March 2020.
- Support point starting March 2020, next in March 2023 followed in Nov 2023 and now in Feb 2025.
- *What can we anticipate and can we hope for some upside reversal from here ????*

Nifty 50 spot 23520.00 by Daily Chart viewNifty 50 spot 23520.00 by Daily Chart view
- Just sharing my views on Nifty 50 Index basis the technical setup of the Daily Chart View

Nifty Daily Levels Update For Option Day TradingNifty Trading idea with Trading Strategy | Nifty Prediction 2022
Nifty Possible Trade for Tomorrow
When to Buy Call Option in Nifty –
Trade Entry – If Nifty Sustain Above Support (15360 ) You Can Buy ATM call Option –
Trade Target – For upside First Target for Nifty is 15450 and Second Target is 15530
Trade Stoploss – If any 30 min candle Closes Below 15330 or max . 20 Points
When to Buy Put Option in Nifty –
Trade Entry – If Nifty Sustain below 15330 or Closes any one Hour Candle below 15330
Trade Target – For Down side Tomorrow First Target for Nifty is 15200 and second target is 15000
Trade Stoploss – If any 30 min candle Closes Below 15360 or max . 20 Points –

Nifty Level Upadate for Trading | END OF DAY CHART ANALYSISBuy signal if any One 30 min Candle Closes Above - 17360 Stoploss - 17335 Target As per Chart
Buy Put if market sustain Below 17335 - Stoploss - 17360 Target As per Chart
For More Details Search in Google - Trading with Manoj Shinde 27485
