NIFTY - Trading levels and Plan for 29-Jan-2026📊 NIFTY Trading Plan for 29-Jan-2026
(Educational & Level-Based | For Index Options Traders)
Market Principle to Remember:
Price reacts at zones where maximum traders are trapped, hedged, or emotionally committed.
Our job is not prediction — it is structured reaction 🧠📈
🟢 Scenario 1: GAP UP Opening (100+ Points) 🚀
Market Psychology:
A big gap-up often comes from overnight short covering or positive global cues. Retail traders chase breakouts emotionally, while smart money waits to sell premium or buy only after acceptance.
📌 Trading Plan:
🔹 Avoid buying immediately at market open
🔹 Let the first 15–30 minutes define direction
🔹 Mark opening range high & VWAP
🔹 Bullish bias only if price sustains above VWAP
🔹 Look for pullback + hold before Call buying
🔹 Prefer Bull Call Spread if IV is elevated
🔹 If price shows rejection near resistance, expect gap-fill or consolidation
🔹 Consider Bear Call Spread near strong resistance
🔍 Educational Insight:
Gap-up buyers are usually emotional. If price fails to sustain, institutions sell into strength, leading to sharp reversals.
🟡 Scenario 2: FLAT / RANGE Opening 😐
Market Psychology:
A flat open signals indecision. Big players wait for retail participation before initiating the real move.
📌 Trading Plan:
🔹 Mark Previous Day High (PDH) & Low (PDL)
🔹 First 30 minutes define the battle zone
🔹 Breakout with volume suggests directional move
🔹 Weak breakout often turns into a false trap
🔹 Use Straddle / Strangle near range boundaries
🔹 Deploy Iron Condor if price stays range-bound
🔹 Enter directional trade only after close + retest
🔍 Educational Insight:
Markets punish impatience. Flat opens reward traders who wait for confirmation, not anticipation.
🔴 Scenario 3: GAP DOWN Opening (100+ Points) 📉
Market Psychology:
Gap-down opens trigger panic selling. Weak hands exit early, while smart money waits for selling exhaustion.
📌 Trading Plan:
🔹 Do not sell Puts immediately at open
🔹 Observe opening candle size and volume spike
🔹 Watch how price behaves near key support zones
🔹 If support holds, expect a pullback or bounce
🔹 Buy Calls only after higher-low formation
🔹 If support breaks with volume, expect trend day down
🔹 Buy Puts on pullback toward resistance
🔹 Prefer Bear Put Spread for controlled risk
🔹 Use Call Credit Spread near resistance
🔍 Educational Insight:
Most gap-down moves start with fear but continue only when institutional selling confirms.
⚠️ Risk Management Tips for Options Traders 🛡️
🔹 Risk only 1–2% of total capital per trade
🔹 Avoid revenge trading after stop-loss hits
🔹 No fresh trades after 2:30 PM
🔹 Avoid naked option selling on event-driven days
🔹 Always check IV, Theta decay, and liquidity
🔹 Maintain minimum risk–reward of 1:2
🔹 Journal every trade — process > profits
🧠 Summary & Conclusion ✨
🔹 Gap openings offer opportunity but demand discipline
🔹 Structured trading beats emotional decisions
🔹 Price acceptance matters more than candle color
🔹 Options trading is a probability game, not prediction
🔹 Consistency comes from process, patience, and risk control
Trade like a risk manager first, trader second 💼📊
📜 Disclaimer ⚠️
This trading plan is shared strictly for educational purposes only.
I am not a SEBI registered analyst.
Trading in the stock market involves risk.
Please consult a certified financial advisor before taking any trades.
Niftytomorrow

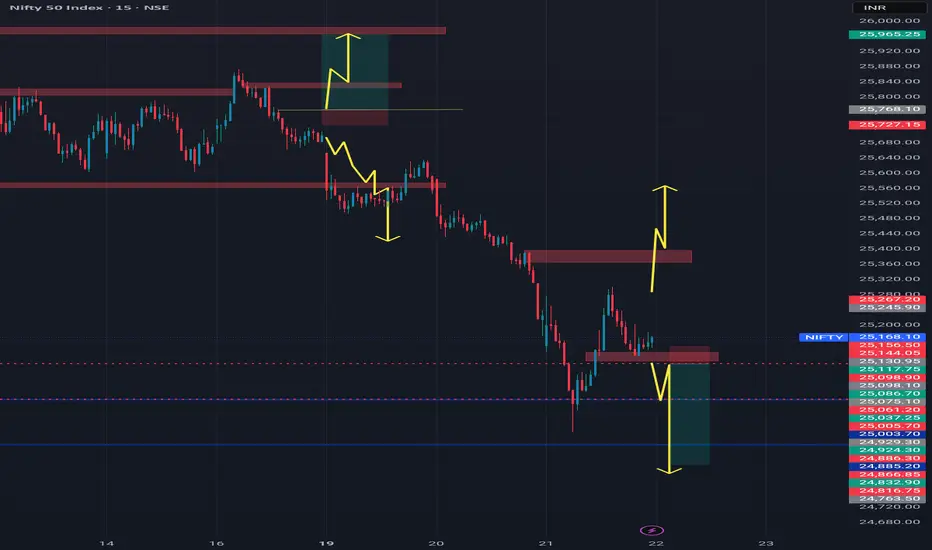
NIFTY : Trading levels and Plan for 22-Jan-2026
Timeframe: 15-minute
Gap Considered: 100+ points
Market Context: Sharp sell-off followed by a relief bounce; index is still below key resistance, indicating pullback within a broader corrective structure.
🔼 SCENARIO 1: GAP UP OPENING (100+ points) 🚀
If NIFTY opens above 25,316, it signals continuation of short-covering from lower levels.
The 25,316–25,370 zone will act as the first supply area.
Sustained 15-min close above 25,370 can open upside toward:
• 25,499 – 25,537 (Last Intraday Resistance zone)
Above 25,537, momentum extension toward 25,600+ is possible, but only with strong volume.
Failure to sustain above 25,316 = trap zone → expect pullback.
📌 Educational Note:
Gap-up markets after a fall often face supply. Prefer buy-on-dips rather than chasing green candles.
📌 Options Thought:
• Bull Call Spread (risk-defined)
• Avoid naked CE buying at resistance
• Book partial profits early 📈
➡️ SCENARIO 2: FLAT / RANGE OPENING ⚖️
If NIFTY opens inside 25,228 – 25,316, the market is likely to stay balanced and choppy initially.
This zone acts as Opening Support / Resistance + No-Trade Zone.
False breakouts are highly probable.
Upside confirmation only above 25,370.
Downside weakness resumes below 25,228.
Wait for a 15-min close outside the zone before acting.
📌 Educational Note:
Flat opens after volatile sessions usually mean time correction, not price correction.
📌 Options Thought:
• Theta strategies (Iron Fly / Short Strangle) only with SL
• Avoid aggressive directional bets
• Reduce quantity ⏳
🔽 SCENARIO 3: GAP DOWN OPENING (100+ points) 📉
If NIFTY opens below 25,228, sellers remain in control.
Immediate support lies near 25,109.
Breakdown below 25,109 exposes:
• 25,000 (Last Intraday Support – psychological level)
Below 25,000, selling pressure can accelerate.
Any bounce toward 25,228–25,316 should be treated as sell-on-rise.
📌 Educational Note:
In gap-down scenarios, capital protection is priority — trend is your friend.
📌 Options Thought:
• Bear Put Spread preferred over naked PE
• Avoid PE selling in trending markets
• Trail SL aggressively 📉
🧠 Risk Management Tips for Options Trading 🛡️
Risk only 1–2% of capital per trade.
Expiry proximity = faster premium decay.
Use spreads to manage volatility risk.
No confirmation candle = no trade.
Avoid overtrading in no-trade zones.
📌 Summary & Conclusion ✨
NIFTY is in a pullback phase within a broader corrective structure.
📍 25,228–25,316 remains the key decision zone.
📍 Strength only above 25,370 → 25,537.
📍 Weakness continues below 25,228 → 25,000.
Patience and level-based trading will be crucial today.
⚠️ Disclaimer
This analysis is for educational purposes only.
I am not a SEBI registered analyst.
Markets are uncertain and I may be wrong.
Please consult your financial advisor before trading.

NiftyNifty has attempted multiple recoveries after the fall, consistently taking support near the 25100 level. If the index opens with a gap down below 25100 and forms a strong bearish candle, a further downside move towards 24750 can be expected. A bullish move is likely only after a decisive break above 25400. Until then price action remain sideways within the 25300-25100 range.
NIFTY : Trading levels and Plan for 21-Jan-2025📘 NIFTY Trading Plan – 21 Jan 2026
Timeframe: 15-minute
Gap Considered: 100+ points
Market Context: Strong sell-off followed by base formation; market trading near a decision / no-trade zone after sharp momentum move
🔼 SCENARIO 1: GAP UP OPENING (100+ points) 🚀
If NIFTY opens above 25,316, it indicates short-covering after the recent decline.
Immediate hurdle lies at 25,388 – 25,415 (Opening / Last Intraday Resistance).
Sustained 15-min close above 25,415 is required for bullish continuation.
Upside targets to watch:
• 25,485
• 25,540+ (only if momentum expands)
Any rejection from resistance with weak candles = profit-booking zone.
Avoid aggressive long entries exactly at resistance; wait for pullback & hold.
📌 Options Thought (Gap Up):
• Prefer Bull Call Spread instead of naked CE
• Book partial profits near resistance zones
• Trail SL aggressively 📈
➡️ SCENARIO 2: FLAT / RANGE OPENING ⚖️
If NIFTY opens inside 25,227 – 25,316, market is likely to remain range-bound initially.
This entire zone acts as a NO TRADE / Balance Zone.
Expect whipsaws and false breakouts.
Upside trade triggers only above 25,415.
Downside pressure resumes below 25,227.
Patience is key — let price show intent first.
📌 Options Thought (Flat Market):
• Ideal environment for Theta-based strategies ⏳
• Short strangle / Iron Condor only with strict SL
• Avoid overtrading inside the range
🔽 SCENARIO 3: GAP DOWN OPENING (100+ points) 📉
If NIFTY opens below 25,227, bears remain in control.
First important support lies at 25,043 (Last Intraday Support).
A bounce is possible, but trend remains weak below 25,316.
Breakdown below 25,043 opens downside toward:
• 24,900 – 24,890 (Major Buyer / Trend Reversal Zone)
Avoid bottom-fishing unless strong reversal structure forms.
📌 Options Thought (Gap Down):
• Prefer Bear Put Spread or directional PE with tight SL
• Avoid selling PE in trending markets
• Focus on quick scalps & disciplined exits 📉
🧠 Risk Management Tips for Options Trading 🛡️
Risk only 1–2% capital per trade.
Avoid revenge trading after SL.
Expiry proximity = faster decay & sharper moves.
Use spreads to control volatility risk.
No confirmation = no trade.
📌 Summary & Conclusion ✨
NIFTY is currently trading near a key balance zone after a sharp fall.
📍 25,227 – 25,316 remains the critical decision area.
📍 Strength only above 25,415 with acceptance.
📍 Weakness continues below 25,227, with eyes on 25,043 → 24,900.
Trade light, respect levels, and let the market confirm direction.
⚠️ Disclaimer
This analysis is for educational purposes only.
I am not a SEBI registered analyst.
Markets are uncertain and I may be wrong.
Please consult your financial advisor before trading.

NIFTY : Trading levels and Plan for 19-Jan-2026📘 NIFTY Trading Plan – 19 Jan 2026
Timeframe: 15-minute
Gap Consideration: 100+ points
Market Context: Range expansion attempt after corrective swings, key balance area in focus
🔼 SCENARIO 1: GAP UP OPENING (100+ points) 🚀
If NIFTY opens above 25,780, it indicates bullish intent with short-covering.
Immediate hurdle lies at 25,915–25,945 (Last Intraday Resistance zone).
Sustained 15-min close above 25,945 can trigger upside extension.
Next upside projection comes near 26,044.
Expect volatility and profit booking near resistance zones.
Fresh longs only on pullback + hold above resistance.
📌 Options Strategy (Gap Up):
• Bull Call Spread (ATM Buy + OTM Sell)
• Avoid aggressive naked CE near resistance
• Trail profits aggressively 📈
➡️ SCENARIO 2: FLAT / RANGE OPENING ⚖️
If NIFTY opens within 25,660–25,738, expect a no-trade / chop zone.
This zone is marked as Opening Support–Resistance.
Market likely to trap both buyers and sellers initially.
Upside trade only above 25,780 with confirmation.
Downside bias activates below 25,560.
Best suited for option sellers if IV permits.
📌 Options Strategy (Flat Market):
• Short Strangle / Iron Fly (experienced traders only)
• Focus on theta decay ⏳
• Avoid directional bias inside range
🔽 SCENARIO 3: GAP DOWN OPENING (100+ points) 📉
If NIFTY opens below 25,560, selling pressure may resume.
First support zone is 25,530–25,567 (Opening / Last Intraday Support).
Minor bounce possible, but trend remains weak below resistance.
Breakdown below 25,530 opens downside towards:
• 25,423
Avoid bottom fishing without confirmation candle.
📌 Options Strategy (Gap Down):
• Bear Put Spread preferred
• Avoid selling PE in trending downside
• Quick scalps only, book fast 📉
🧠 Risk Management Tips for Options Trading 🛡️
Risk only 1–2% of capital per trade.
Expiry proximity = faster decay & sharper moves.
Prefer spreads over naked buying.
One trade = one idea. No revenge trading.
Always wait for 15-min structure confirmation.
📌 Summary & Conclusion ✨
NIFTY is trading near a critical balance zone.
📍 25,660–25,738 remains the decision-making range.
📍 Break above 25,945 may revive bullish momentum.
📍 Below 25,530, downside risk increases sharply.
Trade light, respect levels, and let the market confirm direction.
⚠️ Disclaimer
This content is for educational purposes only.
I am not a SEBI registered analyst.
Markets are uncertain, and I can be wrong.
Please consult your financial advisor before trading.

NIFTY : TRADING LEVELS AND PLAN FOR 16-JAN-2025Timeframe: 15-minute ⏱️
Gap Criteria: 100+ points ⚡
Market Structure: Pullback after a sharp sell-off, with price testing an important intraday equilibrium zone ⚖️
Scenario 1: Gap-Up Opening (100+ points) 🚀
If NIFTY opens above the 25,740–25,780 zone, it would indicate continuation of the recovery along with short covering activity 📈.
The first price reaction is expected near 25,816 (last intraday resistance). Sustained trading above 25,816 can open upside potential towards 25,921 and further towards 26,005, which is a major supply zone 🧱. Given the prevailing broader downtrend, profit booking is likely near higher levels 💼. Aggressive long positions should only be considered after a strong 15-minute candle close above the resistance area ✅.
Options Strategy for Gap-Up 🧾:
A bull call spread is preferred by buying an ATM call and selling an OTM call 🟢. Avoid taking naked call positions near 25,921 and above ⚠️. Trail stop losses aggressively to protect gains 🔒📈.
Scenario 2: Flat or Range-Bound Opening ⚖️
If NIFTY opens between 25,660 and 25,740, the market is expected to remain range-bound with higher chances of option premium decay ⏳.
This zone will act as an opening support and resistance area 🧭. The index may consolidate before revealing a clear direction 🔄. Long trades should only be initiated if price sustains above 25,816 with confirmation 🟢. A short bias can be considered only if there is a decisive breakdown below 25,558 🔴.
Options Strategy for Flat Market 🧾:
Experienced traders may consider short strangle or iron fly strategies 🕸️. Focus should remain on quick theta capture ⏳, and profits should be booked early rather than waiting until end of the day ⌛.
Scenario 3: Gap-Down Opening (100+ points) 📉
If NIFTY opens below 25,558, selling pressure is likely to resume 🔻.
Immediate support is placed in the 25,516–25,489 zone, which is the last intraday support area 🛑. A bounce from this region may offer only a short-term pullback opportunity 🔄. If the index breaks below 25,489, further downside towards 25,358 becomes possible ⬇️. Bottom-fishing should be strictly avoided without strong confirmation 🚫🎣.
Options Strategy for Gap-Down 🧾:
A bear put spread is preferred instead of naked put buying 🔴. Avoid selling put options in trending markets ⚠️. Quick profit booking is recommended due to higher volatility 💨.
Risk Management Tips for Options Trading 🛡️:
Risk only 1–2% of total capital per trade 🎯. During expiry week, price movements are faster, so exits should also be quicker ⚡. Spread strategies are preferred to manage theta decay and implied volatility risk 📉📊. Avoid revenge trading after a stop loss 🚫😤. Always wait for the first 15-minute market structure to form before initiating any position ⏱️.
Summary and Conclusion ✨:
NIFTY is currently positioned at a critical equilibrium zone after a sharp correction ⚖️. The 25,740–25,816 range remains the key bullish trigger 🟢, while 25,558 is the crucial make-or-break support 🔴. Trades should be executed strictly on confirmation, allowing the market to clearly indicate direction 👀📈.
Disclaimer ⚠️:
This analysis is shared strictly for educational purposes only 📚. I am not a SEBI-registered analyst. Markets are uncertain, and there is a possibility of being wrong 🤝. Please consult your financial advisor before taking any trade 🧑💼📑.

NIFTY : Trading levels and Plan for 14-Jan-2026📊 NIFTY Trading Plan – 14 Jan 2026
Timeframe: 15-min
Gap Consideration: 100+ points
Market Context: Short-term corrective structure with defined intraday support & resistance
🔼 SCENARIO 1: GAP UP OPENING (100+ points) 🚀
If NIFTY opens above 25,816, it indicates bullish intent toward the previous supply area.
Immediate focus will be on 25,816 (Opening Resistance).
Sustained price action above 25,816 with volume can trigger short-covering.
Upside targets:
• 25,921 (Last Intraday Resistance)
• Partial profit booking recommended near resistance.
Rejection near 25,816–25,921 zone may lead to intraday pullback.
📌 Options Strategy (Gap-Up):
• Bull Call Spread (Buy ATM CE, Sell OTM CE)
• Avoid aggressive naked CE buying near resistance
• Trail stop once premium doubles 📈
➡️ SCENARIO 2: FLAT / RANGE OPENING ⚖️
If NIFTY opens between 25,672 – 25,816, expect consolidation and option decay.
This zone acts as Opening Support/Resistance (No Trade Zone).
Directional trades only after clear breakout or breakdown.
Above 25,816 → bias shifts bullish.
Below 25,672 → selling pressure likely.
📌 Options Strategy (Flat Market):
• Short Strangle / Iron Fly (experienced traders only)
• Focus on theta decay ⏳
• Book profits early, avoid late-day overconfidence
🔽 SCENARIO 3: GAP DOWN OPENING (100+ points) 📉
If NIFTY opens below 25,672, initial sentiment remains weak.
First support to watch: 25,559 (Last Intraday Support).
A bounce from 25,559 can offer a quick pullback trade.
Breakdown below 25,559 opens downside targets:
• 25,483
Avoid counter-trend longs without confirmation.
📌 Options Strategy (Gap-Down):
• Bear Put Spread or ATM PE with strict SL
• Avoid selling PE in trending weakness
• Trail profits aggressively 📉
🧠 Risk Management Tips for Options Traders 🛡️
Risk only 1–2% of capital per trade.
Expiry-week trades demand faster exits.
Prefer spreads over naked options to manage theta & IV risk.
Wait for first 15-min candle structure before committing.
One clean trade > multiple emotional trades.
📌 Summary & Conclusion ✨
NIFTY is trading within a defined intraday range.
📍 25,672–25,816 remains the key decision zone.
Directional clarity will emerge only after acceptance outside this range.
Trade what the market confirms — not what you assume.
⚠️ Disclaimer
This analysis is shared strictly for educational purposes only.
I am not a SEBI-registered analyst.
Markets are uncertain, and I may be wrong.
Please consult your financial advisor before taking any trades.

NIFTY : Trading levels and Plan for 13-Jan-2025
Timeframe: 15-min
Gap Consideration: 100+ points
Market Structure: Pullback after sharp recovery, now approaching key supply zone
🔼 SCENARIO 1: GAP UP OPENING (100+ points) 🚀
If NIFTY opens above 25,923, it indicates a continuation attempt into the previous intraday supply zone.
Initial reaction near 25,923–26,005 is crucial (previous resistance).
Sustainability above 25,923 with volume = bullish acceptance.
Upside targets:
• 26,005 (last intraday resistance)
• 26,075 (upper resistance / supply zone)
Failure to hold above 25,923 may lead to pullback toward the opening range.
📌 Options Strategy (Gap-Up):
• Bull Call Spread (e.g., Buy ATM CE & Sell OTM CE)
• Avoid naked CE buying near resistance
• Partial profit booking recommended near 26,005+
➡️ SCENARIO 2: FLAT / RANGE-BOUND OPENING ⚖️
If NIFTY opens between 25,743 – 25,816, expect range behaviour and option decay.
This zone acts as Opening Support/Resistance + No-Trade Area.
Wait for a clear breakout or breakdown before initiating trades.
Above 25,816 with hold → bullish continuation possible.
Below 25,743 → weakness resumes toward lower supports.
📌 Options Strategy (Flat Market):
• Short Strangle / Iron Fly (only for experienced traders)
• Focus on theta decay, tight SL mandatory
• Book profits early; do not hold till late expiry hours
🔽 SCENARIO 3: GAP DOWN OPENING (100+ points) 📉
If NIFTY opens below 25,743, selling pressure may dominate initially.
First support to watch: 25,640 (last intraday support).
A bounce from 25,640 can give a pullback trade.
Breakdown below 25,640 opens downside targets:
• 25,545
• Further weakness if momentum accelerates
Avoid aggressive longs unless strong reversal confirmation appears.
📌 Options Strategy (Gap-Down):
• Bear Put Spread or ATM PE buy with strict SL
• Avoid selling PE in trending breakdown
• Trail profits aggressively on downside moves
🧠 Risk Management Tips for Options Traders 🛡️
Never risk more than 1–2% of capital per trade.
Expiry trades require faster exits — do not expect positional moves.
Prefer spreads over naked options to control theta & volatility risk.
Trade only after first 15-min structure is clear.
One good trade is enough — overtrading kills edge.
📌 Summary & Conclusion ✨
NIFTY is currently at a decision zone after a sharp pullback recovery.
📍 25,743–25,816 remains the key battle area.
Directional bias will only be clear after acceptance outside this range.
Let price confirm — react, don’t predict.
⚠️ Disclaimer
This analysis is shared strictly for educational purposes only.
I am not a SEBI-registered analyst.
Markets are uncertain, and I may be wrong.
Please consult your financial advisor before taking any trades.

NIFTY : Trading levels and Plan for 12-Jan-2026(Timeframe: 15-min | Gap criteria considered: 100+ points)
🔑 Key Levels (from chart)
Last Intraday Resistance: 25,998
Opening Resistance Zone: 25,742 – 25,816
Spot / Pivot Area: 25,700
Opening Support Zone: 25,592 – 25,647
Last Intraday Support: 25,353
🧠 Market structure note: NIFTY is in a short-term downtrend, but currently showing a relief bounce from demand. Price is approaching an important supply zone, where rejection risk remains high unless acceptance improves.
🟢 1. GAP-UP OPENING (100+ Points)
If NIFTY opens above 25,742, it will be a pullback rally into resistance.
🎓 Educational Insight
Gap-ups in a corrective downtrend often face selling near supply zones. Strength is confirmed only when price holds above resistance, not just spikes.
Plan of Action
Avoid aggressive longs in the first 15 minutes ⏳
Sustain above 25,816 → move toward 25,998
Rejection from 25,742 – 25,816 → pullback toward 25,700
Fresh longs only after retest + higher low
Options idea: Bull Call Spread (ATM buy + OTM sell)
🟡 2. FLAT OPENING
If NIFTY opens near 25,680 – 25,720, expect range-bound and volatile price action.
🎓 Educational Insight
Flat opens near VWAP / pivot after a sell-off usually result in false breakouts. Direction emerges only after range expansion with volume.
Plan of Action
Above 25,742 → upside toward 25,816
Failure above 25,742 → sideways to weak bias
Break below 25,592 → selling toward 25,353
Avoid trades inside the middle range 🚫
Options idea: Iron Fly / Short Strangle with hedge
🔴 3. GAP-DOWN OPENING (100+ Points)
If NIFTY opens below 25,592, bears remain firmly in control.
🎓 Educational Insight
Gap-downs into demand can cause short covering bounces, but continuation happens if price fails to reclaim the opening range.
Plan of Action
First support to watch: 25,592 – 25,647
Weak bounce + rejection → downside toward 25,353
Sustain below 25,353 → further trend continuation
Avoid fresh shorts exactly at support
Options idea: Bear Put Spread / Put Debit Spread
🛡️ Risk Management Tips (Options Trading)
Risk only 1–2% capital per trade 💰
Prefer spreads over naked buying in volatile zones
Book partial profits at resistance/support levels
No averaging against the trend 🚫
Stop trading after 2 consecutive losses 🧠
🧾 Summary & Conclusion
Above 25,816: Relief rally toward 25,998
25,742 – 25,816: Selling / supply zone
Below 25,592: Weakness toward 25,353
Focus on price acceptance, not prediction 🎯
⚠️ Disclaimer
I am not a SEBI-registered analyst. This trading plan is for educational purposes only. Markets are risky, and I may be wrong. Please consult a qualified financial advisor before taking trades.

NIFTY : Trading levels and Plan for 09-Jan-2026
(Timeframe: 15-min | Gap criteria considered: 100+ points)
🔑 Key Levels from Chart
Major Upside Resistance: 26,115
Last Intraday Resistance: 26,032
No-Trade / Supply Zone: 25,839 – 25,932
Opening Support / Pivot: 25,839
Last Intraday Support: 25,741
Lower Support Extension: 25,587
🧠 Market context: NIFTY is in a short-term corrective structure after a strong sell-off. Price is consolidating inside a well-defined no-trade zone, indicating balance before the next directional move.
🟢 1. GAP-UP OPENING (100+ Points)
If NIFTY opens above 25,932, it signals short-covering but into a supply zone.
🎓 Educational Insight
Gap-ups after a decline often face selling pressure near VWAP/supply zones. Sustainable upside requires acceptance above resistance, not just an opening spike.
Plan of Action
Avoid chasing longs in first 15 minutes ⏳
Sustain above 26,032 → upside toward 26,115
Rejection near 26,032 → pullback to 25,932 – 25,839
Fresh longs only on retest + higher low formation
Options idea: Bull Call Spread (ATM buy + OTM sell)
🟡 2. FLAT OPENING
If NIFTY opens inside 25,839 – 25,932, expect range-bound & whipsaw action.
🎓 Educational Insight
Flat opens within supply-demand overlap zones usually lead to false breakouts. Direction emerges only after range expansion with volume.
Plan of Action
Above 25,932 with hold → move toward 26,032
Failure above 25,932 → sideways to negative bias
Break below 25,839 → weakness toward 25,741
Avoid trades in mid-range 🚫
Options idea: Iron Fly / Hedged Short Strangle if volatility drops
🔴 3. GAP-DOWN OPENING (100+ Points)
If NIFTY opens below 25,839, bears remain in control.
🎓 Educational Insight
Gap-downs into prior supports can trigger panic selling, but sharp bounces are also common. Always wait for price confirmation.
Plan of Action
First demand zone: 25,741
Strong rejection from 25,741 → intraday bounce possible
Break & sustain below 25,741 → slide toward 25,587
Avoid fresh shorts exactly at support
Options idea: Bear Put Spread or Put Debit Spread
🛡️ Risk Management Tips (Options Trading)
Risk only 1–2% capital per trade 💰
Prefer spreads over naked buying in volatile zones
Book partial profits near resistance/support
No averaging against trend 🚫
Stop trading after 2 consecutive losses 🧠
🧾 Summary & Conclusion
Above 26,032: Short-term bullish toward 26,115
25,839 – 25,932: No-Trade / Chop Zone
Below 25,839: Weakness toward 25,741 → 25,587
Focus on price acceptance, not prediction 🎯
⚠️ Disclaimer
I am not a SEBI-registered analyst. This analysis is strictly for educational purposes only. Markets involve risk—please consult a certified financial advisor before trading.

NIFTY : Trading plan for 07-Jan-2026
(Timeframe: 15-min | Gap consideration: 100+ points)
Key Levels to Track (from chart)
Upper Resistance / Extension: 26,392
Last Intraday Resistance: 26,320
Opening Resistance (Gap-up case): 26,250
Opening Support / Resistance (Pivot): 26,183 – 26,175
Opening Support (Gap-down case): 26,042 – 26,080
Last Intraday Support: 25,983
Lower Extreme Support: 25,839
🧠 Context: After a strong prior up-move, price corrected and is now hovering near a pivot band (26,183–26,175). Expect whipsaws early; clean direction needs acceptance above/below the pivot.
🟢 1. GAP-UP OPENING (100+ Points)
If NIFTY opens above 26,250, the market signals bullish intent but immediately faces overhead supply.
🎓 Educational Explanation:
Gap-ups near resistance often see early profit booking. Sustainable upside requires price acceptance (holding above levels on a 15-min close), not just a spike.
Plan of Action:
Avoid the first 10–15 mins; let volatility settle.
Sustain above 26,250 → test 26,320 (last intraday resistance).
Acceptance above 26,320 opens path toward 26,392.
Repeated rejection near 26,320 → expect pullback toward 26,250 → 26,183.
Options idea: Bull Call Spread (ATM buy + OTM sell) to reduce theta risk near resistance.
🟡 2. FLAT OPENING
If NIFTY opens inside 26,175–26,250, expect a range-bound start.
🎓 Educational Explanation:
Flat opens inside a pivot zone reflect indecision. Direction emerges only after a range expansion with volume.
Plan of Action:
Above 26,250 → bullish bias toward 26,320.
Failure at 26,250 keeps price rotating within 26,183–26,175.
Break & hold below 26,175 shifts bias toward 26,080 → 26,042.
Wait for 15-min close + volume before committing.
Options idea: Iron Fly / Narrow Strangle (light size) if range persists.
🔴 3. GAP-DOWN OPENING (100+ Points)
If NIFTY opens below 26,175, sentiment turns cautious.
🎓 Educational Explanation:
Gap-downs into support can trigger panic selling, followed by either short covering or continuation. Confirmation matters.
Plan of Action:
First watch zone: 26,080–26,042.
Sustain below 26,042 → downside toward 25,983.
Break of 25,983 increases probability of 25,839.
Strong bullish rejection from 26,080–26,042 may offer intraday bounce longs.
Options idea: Bear Put Spread (avoid naked puts near supports).
⚙️ Risk Management Tips for Options Trading 🛡️
Risk only 1–2% of capital per trade.
Prefer spreads near major levels to manage theta & IV.
Use time-based exits if premium stalls for 15–20 mins.
Book partials early; trail the rest.
No revenge trades after SL.
🧾 Summary & Conclusion
Above 26,250: Bulls active; hurdles at 26,320 → 26,392
26,175–26,250: Choppy pivot → patience pays
Below 26,175: Weakness toward 26,080 → 26,042 → 25,983
Trade reaction at levels, not predictions 🚦
⚠️ Disclaimer
I am not a SEBI-registered analyst. This content is for educational purposes only. Markets involve risk—consult your financial advisor before trading.

NIFTY : Trading levels and Plan for 06-Jan-2026📘 NIFTY Trading Plan for 6-Jan-2026
(Timeframe: 15-min | Gap consideration: 100+ points)
Key Levels to Track (from chart)
Upper Resistance / Extension: 26,483
Last Intraday Resistance Zone: 26,386 – 26,412
Opening Resistance: 26,316
Opening Support / Resistance Zone: 26,202 – 26,244
Lower Support: 26,041
🧠 Market Context: NIFTY has recently shown strong upside momentum, but price is now reacting near a major supply zone. Expect volatility, false breakouts, and profit booking unless levels are clearly accepted.
🟢 1. GAP-UP OPENING (100+ Points)
If NIFTY opens above 26,316, it indicates bullish intent but inside a heavy resistance cluster.
🎓 Educational Explanation:
Gap-ups near resistance often attract smart money selling. True continuation happens only if price accepts above resistance, not just spikes.
Plan of Action:
Avoid trades in the first 10–15 minutes; let volatility settle.
Sustaining above 26,316 keeps price biased toward 26,386–26,412.
Acceptance above 26,412 opens path toward 26,483.
Repeated rejection from 26,386–26,412 signals profit booking / pullback.
Options traders: Prefer Bull Call Spread or ATM Call with trailing SL near resistance.
🟡 2. FLAT OPENING
If NIFTY opens around 26,202–26,316, expect a range-bound and tricky session initially.
🎓 Educational Explanation:
Flat opens inside a broad zone reflect indecision. Direction emerges only after a range expansion.
Plan of Action:
Above 26,316 → bullish bias toward 26,386–26,412.
Failure near 26,316 keeps market sideways.
Break below 26,202 shifts bias toward 26,041.
Wait for 15-min candle close + volume confirmation before entering.
Options traders: Iron Fly / Short Strangle (light quantity) works well if range persists.
🔴 3. GAP-DOWN OPENING (100+ Points)
If NIFTY opens below 26,202, sentiment turns cautious.
🎓 Educational Explanation:
Gap-downs into support often cause panic selling early, followed by either short covering or continuation. Confirmation is key.
Plan of Action:
First level to watch: 26,202–26,244 zone.
Sustaining below 26,202 increases downside probability toward 26,041.
Strong bullish reaction near 26,041 may give intraday bounce trades.
Avoid aggressive shorts near support without confirmation.
Options traders: Prefer Bear Put Spread over naked puts to manage risk.
⚙️ Risk Management Tips for Options Trading 🛡️
Limit risk to 1–2% of capital per trade.
Avoid over-trading near major resistance zones.
Use time-based exits if premium stops moving for 15–20 mins.
Book partial profits early; trail the remainder.
Prefer ATM options or spreads in volatile sessions.
No revenge trades after SL hit.
🧾 Summary & Conclusion
Above 26,316: Bulls active, but expect resistance near 26,386–26,412
Between 26,202–26,316: Choppy zone → patience required
Below 26,202: Weakness toward 26,041 possible
Trade price reaction, not prediction 🚦
Discipline > aggression in resistance-heavy markets.
⚠️ Disclaimer
I am not a SEBI-registered analyst. This analysis is for educational purposes only. Markets involve risk; please consult your financial advisor before taking any trade.

NIFTY : Trading levels and Plan for 05-Jan-2026📘 NIFTY Trading Plan for 5-Jan-2026
(Timeframe: 15-min | Gap consideration: 100+ points)
Key Levels to Track (from chart)
Upper Target / Extension: 26,658
Last Intraday Resistance / Profit Booking Zone: 26,467 – 26,483
Opening Resistance Zone: 26,335 – 26,296
Opening Support: 26,289
Last Intraday Support: 26,237
Lower Support (Extreme): 26,162
🧠 Context: NIFTY is in a strong bullish structure, trading above key supports. However, price is approaching profit-booking zones, so reactions at resistance will decide continuation vs pullback.
🟢 1. GAP-UP OPENING (100+ Points)
If NIFTY opens above 26,335, it signals continuation strength.
🎓 Educational Explanation:
Gap-up openings after a rally often attract early profit booking. True strength is confirmed only if price accepts above resistance and holds.
Plan of Action:
Avoid trading the first 10–15 minutes; let volatility settle.
Holding above 26,335–26,296 keeps bullish momentum intact.
Sustained move above 26,483 opens path toward 26,658.
Sharp rejection from 26,467–26,483 → expect intraday pullback.
Options traders: Prefer ATM / ITM Call buying on retest-and-hold or use Bull Call Spread near resistance.
🟡 2. FLAT OPENING
If NIFTY opens around 26,289–26,335, market enters a decision zone.
🎓 Educational Explanation:
Flat opens indicate temporary balance. Direction emerges only after a range break, otherwise price may chop and decay option premiums.
Plan of Action:
Above 26,335 → bullish bias toward 26,467–26,483.
Failure near 26,335 may lead to sideways movement.
Break below 26,289 increases probability of test toward 26,237.
Trade only on clear breakout or rejection with volume confirmation.
Options traders: Consider non-directional strategies (Iron Fly / Short Strangle) if range persists.
🔴 3. GAP-DOWN OPENING (100+ Points)
If NIFTY opens below 26,289, expect cautious sentiment initially.
🎓 Educational Explanation:
Gap-downs into strong supports often trigger short covering or dip buying. Aggressive shorts near support are risky without confirmation.
Plan of Action:
First support to watch: 26,289.
Acceptance below 26,237 → downside toward 26,162.
Strong bullish candles near 26,237–26,162 may give bounce trades.
Only short if price fails to reclaim supports with weak structure.
Options traders: Prefer Put spreads instead of naked puts to manage risk.
⚙️ Risk Management Tips for Options Trading 🛡️
Risk only 1–2% of total capital per trade.
Avoid chasing breakouts near profit-booking zones.
Use time-based exits if premium stalls for 15–20 minutes.
Book partial profits early; trail the rest.
Avoid over-trading during sideways phases.
Prefer ATM options or spreads over far OTM buying.
🧾 Summary & Conclusion
Above 26,335: Bulls remain in control toward 26,483 → 26,658
Between 26,289–26,335: Market in balance → wait for clarity
Below 26,289: Pullback possible toward 26,237 → 26,162
Focus on price behavior at levels, not excitement 🚦
Discipline and patience will protect profits in a trending market.
⚠️ Disclaimer
I am not a SEBI-registered analyst. This analysis is for educational purposes only. Markets involve risk; please consult your financial advisor before taking any trade.

NIFTY : Trading levels and Plan for 02-Jan-2026(Timeframe: 15-min | Gap consideration: 100+ points)
Key Levels to Track (from chart)
Major Resistance Zone (Daily / ATH area): 26,336 – 26,386
Last Intraday Resistance: 26,288
Opening Resistance Zone: 26,160 – 26,182
Opening Support Zone: 26,089 – 26,098
Last Intraday Support: 26,023
Lower Support (Extreme): 25,945
🧠 Context: NIFTY is trading near an important daily resistance for potential new lifetime highs, hence reactions around resistance zones will be crucial. Expect volatility + traps.
🟢 1. GAP-UP OPENING (100+ Points)
If NIFTY opens above 26,182, it indicates bullish continuation attempt.
🎓 Educational Explanation:
Gap-up opens near higher-timeframe resistance often test buyer strength vs profit booking. Only sustained acceptance above resistance confirms continuation.
Plan of Action:
Avoid trading in first 10–15 minutes to let volatility settle.
Sustaining above 26,160–26,182 → bullish bias remains intact.
Fresh buying confirmation above 26,288 can push price toward 26,336–26,386.
Sharp rejection from 26,336+ zone may trigger intraday pullback.
Options traders: Prefer ATM / ITM Call buying or Bull Call Spread after retest & hold.
🟡 2. FLAT OPENING
If NIFTY opens between 26,100 – 26,160, market enters a balance / decision zone.
🎓 Educational Explanation:
Flat opens usually indicate indecision. Direction is confirmed only after range expansion. Patience is key to avoid whipsaws.
Plan of Action:
Holding above 26,160 keeps upside open toward 26,288.
Failure to cross 26,160–26,182 may result in sideways or pullback.
Breakdown below 26,089 increases probability of move toward 26,023.
Trade only after clear breakout / rejection with volume.
Options traders: Prefer non-directional strategies (Iron Fly / Short Strangle) if range persists.
🔴 3. GAP-DOWN OPENING (100+ Points)
If NIFTY opens below 26,089, early sentiment turns cautious.
🎓 Educational Explanation:
Gap-downs into support zones often see short covering or dip buying. Selling blindly near support increases reversal risk.
Plan of Action:
First support to watch: 26,089–26,098.
Break & acceptance below 26,089 → downside toward 26,023.
Failure to hold 26,023 may drag index to 25,945.
Strong bullish candles near supports may offer bounce trades.
Options traders: Prefer Put spreads instead of naked puts to control risk.
⚙️ Risk Management Tips for Options Trading 🛡️
Risk only 1–2% of capital per trade.
Avoid over-leveraging near all-time-high resistance zones.
Use time-based exits if premium stops moving for 15–20 minutes.
Book partial profits at resistance; don’t aim for extremes.
Avoid revenge trading on false breakouts.
Prefer ATM options or spreads over far OTM buying.
🧾 Summary & Conclusion
Above 26,182: Bulls stay active toward 26,288 → 26,336–26,386
Between 26,089–26,160: Market in balance → wait for confirmation
Below 26,089: Sellers gain control toward 26,023 → 25,945
Trade price reaction at levels, not emotions or headlines 🎯
Patience + discipline will matter more than aggression on such levels.
⚠️ Disclaimer
I am not a SEBI-registered analyst. This analysis is strictly for educational purposes only. Trading in markets involves risk. Please consult your financial advisor before taking any trade.

NIFTY : Trading levels and Plan for 01-Jan-2026📘 NIFTY Trading Plan for 1-Jan-2026
(Timeframe: 15-min | Gap consideration: 100+ points)
Key Levels from Chart
Last Intraday Resistance Zone: 26,336 – 26,386
Opening Resistance Zone: 26,160 – 26,182
Opening Support Zone: 26,057 – 26,083
Last Intraday Support: 26,019
Lower Support (Extreme): 25,944
🔍 Note: Price is approaching an important daily resistance area, so reactions near upper zones are critical for trend continuation.
🟢 1. GAP-UP OPENING (100+ Points)
If NIFTY opens above 26,160, it signals strength carrying forward from the previous session.
🎓 Educational Explanation:
Gap-up openings near higher-timeframe resistance often test buyer conviction. Acceptance above resistance confirms continuation, while rejection usually leads to healthy pullbacks.
Plan of Action:
Avoid trading in the first 10–15 minutes; let volatility settle.
Sustaining above 26,160–26,182 → bullish continuation likely.
Fresh buying confirmation above 26,182 can push price toward 26,336–26,386.
Rejection from 26,336+ may trigger intraday profit booking.
Options traders: Prefer ATM / ITM Calls after retest & hold; avoid chasing far OTM calls.
🟡 2. FLAT OPENING
A flat open around 26,100–26,150 places price inside a decision zone.
🎓 Educational Explanation:
Flat opens reflect temporary balance. The market usually gives one clean directional move after breaking either side of the opening range. Patience avoids whipsaws.
Plan of Action:
Holding above 26,160 keeps bullish bias active.
Failure near 26,160–26,182 may lead to consolidation or pullback.
Breakdown below 26,083 increases downside probability toward 26,019.
Only trade after a clear breakout or rejection with volume support.
🔴 3. GAP-DOWN OPENING (100+ Points)
If NIFTY opens below 26,083, early sentiment turns cautious.
🎓 Educational Explanation:
Gap-downs into support zones often attract short covering or value buying. Selling without confirmation near support increases reversal risk.
Plan of Action:
First support to watch: 26,057–26,083.
Breakdown and acceptance below 26,057 opens downside toward 26,019.
If 26,019 fails, next support lies near 25,944.
Strong bullish candles near supports can give intraday bounce trades.
⚙️ Risk Management Tips for Options Trading 🛡️
Avoid overtrading on the first trading day of the year.
Risk only 1–2% capital per trade.
Use time-based SL (15–20 mins) if premium stops moving.
Prefer ATM options or spreads near resistance zones.
Book partial profits at predefined levels; don’t wait for extremes.
Avoid emotional trades near all-time-high resistance areas.
🧾 Summary & Conclusion
Above 26,182: Bulls stay in control toward 26,336–26,386.
Between 26,083–26,160: Market in balance; wait for confirmation.
Below 26,083: Sellers gain control unless buyers defend 26,019.
Trade reaction at levels, not excitement around new-year moves 🎯.
Discipline + patience = consistency.
⚠️ Disclaimer
I am not a SEBI-registered analyst. This analysis is for educational purposes only. Markets involve risk; please consult your financial advisor before trading.

NIFTY : Trading levels and Plan for 31-Dec-2025NIFTY Trading Plan for 31-Dec-2025
(Timeframe: 15-min | Gap criteria considered: 100+ points)
Key Levels to Track (from chart)
Last Intraday Resistance: 26,159
Opening Resistance: 26,056
Opening Resistance / Support (Pivot Zone): 25,970 – 25,933
Opening Support (Gap-down case): 25,835
Lower Support (Extreme): 25,661
🟢 1. GAP-UP OPENING (100+ Points)
If NIFTY opens above 25,970, price starts above the pivot zone with scope for continuation.
🎓 Educational Explanation:
Gap-up opens show overnight strength, but continuation only comes with acceptance above key resistance. Many gap-ups initially retrace before choosing direction. Patience in the first few minutes improves risk-reward.
Plan of Action:
Avoid the first 10–15 minutes; observe price behaviour above 25,970.
Sustaining above 25,970–26,056 → bullish bias remains intact.
Break and acceptance above 26,056 opens upside toward 26,159.
Rejection near 26,056–26,159 may cause a pullback toward 25,970.
Options traders: Prefer ATM / ITM Calls only after confirmation; avoid chasing spikes.
🟡 2. FLAT OPENING
A flat open around 25,930–25,980 places NIFTY inside the pivot / balance zone.
🎓 Educational Explanation:
Flat openings indicate temporary balance between buyers and sellers. Direction usually emerges after a clear breakout or breakdown of the opening range. Trading inside the zone often leads to whipsaws and premium decay.
Plan of Action:
Sustaining above 25,970 keeps bullish bias toward 26,056 → 26,159.
Failure to cross 25,970 keeps price range-bound.
Breakdown below 25,933 signals weakness toward 25,835.
Look for bullish rejection candles near 25,933–25,970 for bounce trades.
🔴 3. GAP-DOWN OPENING (100+ Points)
If NIFTY opens below 25,933, early sentiment turns cautious to bearish.
🎓 Educational Explanation:
Gap-downs are often emotion-driven. Strong support zones can attract short-covering and value buying, so selling blindly into support increases reversal risk.
Plan of Action:
First support to watch is 25,835 — observe volume and candle structure.
Breakdown and acceptance below 25,835 opens downside toward 25,661.
Strong bullish reversal near 25,661 can lead to a sharp intraday bounce.
Any pullback toward 25,933 after breakdown can be used as sell-on-rise.
⚙️ Risk Management Tips for Options Trading 🛡️
Avoid trading the first 5–10 minutes on gap days.
Don’t buy options at resistance or sell at support without confirmation.
Use a time-based stop-loss (15–20 minutes) if premium stalls.
Risk only 1–2% of total capital per trade.
Prefer ATM options or defined-risk spreads to control theta decay.
Book partial profits near marked resistance/support levels.
🧾 Summary & Conclusion
Above 25,970: Bulls remain active; targets 26,056 → 26,159.
Between 25,933–25,970: Market stays balanced; patience is key.
Below 25,933: Sellers gain control unless buyers defend 25,835 / 25,661.
Trade price behaviour at levels, not predictions or emotions.
Consistency comes from discipline, confirmation, and risk control.
⚠️ Disclaimer
I am not a SEBI-registered analyst. This trading plan is for educational purposes only and should not be considered financial or investment advice. Please consult your financial advisor before taking any trades.

NIFTY : Trading levels and Plan for 30-Dec-2025NIFTY Trading Plan for 30-Dec-2025
(Timeframe: 15-min | Gap criteria considered: 100+ points)
Key Levels to Track (from chart)
Last Intraday Resistance: 26,168.00
Opening Support / Resistance (Pivot): 25,950.00
Opening Support Zone: 25,852 – 25,974
Last Intraday Support: 25,805.00
Lower Support (Extreme): 25,662.45
🟢 1. GAP-UP OPENING (100+ Points)
If NIFTY opens above 25,950, price starts the session near the pivot with scope for a relief bounce.
🎓 Educational Explanation:
Gap-up openings after a decline often invite short-covering first, followed by a test of overhead resistance. Sustainable upside needs acceptance above the pivot; chasing the opening spike usually gives poor R:R.
Plan of Action:
Wait 10–15 minutes to see acceptance above 25,950.
If price holds above 25,950, look for pullback-based long entries.
Upside targets: 26,050 → 26,168 (watch price behaviour near resistance).
Rejection near 26,168 may lead to a pullback toward 25,950.
Options: Prefer ATM / ITM Calls after confirmation; avoid far OTM CE at the open.
🟡 2. FLAT OPENING
A flat open near 25,900–25,980 keeps NIFTY inside the Opening Support / Pivot zone.
🎓 Educational Explanation:
Flat opens indicate balance. Direction generally emerges after a clear break of the opening range. Trading inside the zone without confirmation often results in whipsaws and theta decay.
Plan of Action:
Sustaining above 25,950 keeps bullish bias alive toward 26,050 → 26,168.
Failure to cross 25,950 keeps price range-bound.
Breakdown below 25,852 increases downside risk toward 25,805.
Watch for bullish rejection within 25,852–25,974 for bounce trades.
🔴 3. GAP-DOWN OPENING (100+ Points)
If NIFTY opens below 25,852, early sentiment turns weak.
🎓 Educational Explanation:
Gap-downs are often emotional. Strong demand zones attract short-covering and value buying, so selling blindly into support increases reversal risk.
Plan of Action:
First support to watch is 25,805 — observe candle structure and volume.
Breakdown and acceptance below 25,805 opens downside toward 25,662.45.
Strong bullish reversal signals near 25,662.45 can trigger a sharp intraday bounce.
Any pullback toward 25,852 after breakdown can be used as a selling-on-rise opportunity.
⚙️ Risk Management Tips for Options Trading 🛡️
Avoid trading the first 5–10 minutes on gap days.
Don’t buy options at resistance or sell at support without confirmation.
Use a time-based stop-loss (15–20 minutes) if premium doesn’t move.
Risk only 1–2% of total capital per trade.
Prefer ATM options or defined-risk spreads to manage theta decay.
Book partial profits near marked resistance/support levels.
🧾 Summary & Conclusion
Above 25,950: Bulls attempt recovery; targets 26,050 → 26,168.
Between 25,852–25,950: Market remains balanced; patience required.
Below 25,852: Sellers gain control unless buyers defend 25,805 / 25,662.
Trade price behaviour at levels, not predictions or emotions.
Consistency comes from discipline, confirmation, and risk control.
⚠️ Disclaimer
I am not a SEBI-registered analyst. This trading plan is for educational purposes only and should not be considered financial or investment advice. Please consult your financial advisor before taking any trades.

NIFTY : Trading levels and Plan for 29-Dec-2025📘 NIFTY Trading Plan for 29-Dec-2025
(Chart reference: 15-min | Gap criteria considered: 100+ points)
Key Levels to Track (from chart)
Major Upside Resistance: 26,265.35
Last Intraday Resistance: 26,186.00
Opening Resistance: 26,099.00
Opening Support Zone: 25,979 – 26,040
Last Intraday Support: 25,920.00
Lower Support (Extreme): 25,834.00
🟢 1. GAP-UP OPENING (100+ Points)
If NIFTY opens above 26,099, price will start the session close to a short-term supply area.
🎓 Educational Explanation:
Gap-up openings reflect overnight bullish sentiment, but early profit booking near resistance is common. Strong continuation usually requires acceptance above resistance or a pullback-and-hold. Chasing the opening candle often results in poor risk-reward.
Plan of Action:
Wait for 10–15 minutes to check acceptance above 26,099.
If price sustains above 26,099, look for pullback-based long entries.
Upside targets remain 26,186, followed by 26,265.35 on strong acceptance.
Rejection near 26,186–26,265 may trigger a pullback toward 26,099.
Option buyers should prefer ATM / ITM Calls only after confirmation; avoid chasing far OTM CE.
🟡 2. FLAT OPENING
A flat open near 26,020–26,060 places NIFTY inside the Opening Support Zone (25,979–26,040).
🎓 Educational Explanation:
Flat openings indicate balance between buyers and sellers. Direction usually emerges only after a clear break of the opening range. Trading inside this zone without confirmation often leads to whipsaws and option premium decay.
Plan of Action:
Sustaining above 26,099 shifts bias bullish toward 26,186.
Failure to cross 26,099 keeps the market range-bound or weak.
Breakdown below 25,979 signals weakness toward 25,920.
Watch for bullish rejection candles near 25,979–26,040 for bounce trades.
🔴 3. GAP-DOWN OPENING (100+ Points)
If NIFTY opens below 25,979, early sentiment turns cautious to bearish.
🎓 Educational Explanation:
Gap-down openings are often emotion-driven. However, strong demand zones attract short-covering and value buying. Selling blindly into support increases the probability of getting trapped.
Plan of Action:
First support to watch is 25,920 — observe price behaviour and candle structure.
Breakdown and acceptance below 25,920 opens the downside toward 25,834.
Strong bullish reversal signals near 25,834 may lead to a sharp intraday bounce.
Any pullback toward 25,979 after breakdown can be used as a selling-on-rise opportunity.
⚙️ Risk Management Tips for Options Trading 🛡️
Avoid trading the first 5–10 minutes during gap openings.
Do not buy options at resistance or sell at support without confirmation.
Use a time-based stop-loss (15–20 minutes) if premium doesn’t move.
Risk only 1–2% of total capital per trade.
Prefer ATM options or defined-risk spreads to manage theta decay.
Book partial profits near marked resistance/support zones.
🧾 Summary & Conclusion
Above 26,099: Bulls stay active; targets 26,186 → 26,265.
Between 25,979–26,099: Market remains balanced; patience required.
Below 25,979: Sellers gain control unless buyers defend 25,920 / 25,834.
Focus on price behaviour at predefined levels, not predictions.
Consistency comes from discipline, confirmation, and risk control.
⚠️ Disclaimer
I am not a SEBI-registered analyst. This trading plan is for educational purposes only and should not be considered financial or investment advice. Please consult your financial advisor before taking any trades.

NIFTY : Trading levels and Plan for 26-Dec-2025📘 NIFTY Trading Plan for 26-Dec-2025
(Chart reference: 15-min | Gap criteria considered: 100+ points)
Key Levels to Track (from chart)
Major Upside Resistance: 26,341.10
Last Intraday Resistance: 26,265.00
Opening Resistance: 26,212.00
Opening Support / Resistance (Pivot Zone): 26,099 – 26,141
Last Intraday Support: 26,040.50
Lower Support: 25,920.85
🟢 1. GAP-UP OPENING (100+ Points)
If NIFTY opens above 26,212, price starts the session in a bullish zone but close to overhead supply.
🎓 Educational Explanation:
Gap-up opens indicate positive overnight sentiment. However, when price opens near resistance, early profit-booking is common. Strong trends usually continue only after acceptance above resistance or a clean retest, not on impulsive spikes.
Plan of Action:
If price sustains above 26,212 for 10–15 minutes, look for pullback-based long entries.
First upside hurdle is 26,265 (last intraday resistance).
Acceptance above 26,265 can extend the move toward 26,341.10.
Rejection or exhaustion near 26,265–26,341 may lead to a pullback toward 26,212.
Option buyers should avoid chasing CE at the open; confirmation improves R:R.
🟡 2. FLAT OPENING
A flat open around 26,120–26,160 keeps NIFTY inside the opening pivot zone (26,099–26,141).
🎓 Educational Explanation:
Flat opens reflect balance between buyers and sellers. Direction typically emerges after the opening range breaks. Trading inside this zone without confirmation often leads to whipsaws and theta decay.
Plan of Action:
Sustaining above 26,141 keeps bullish bias intact, targeting 26,212 → 26,265.
Failure to hold 26,099 increases downside risk toward 26,040.50.
Bullish rejection near 26,099–26,141 offers a low-risk bounce back to 26,212.
Breakdown and acceptance below 26,099 shifts momentum toward 26,040.50.
🔴 3. GAP-DOWN OPENING (100+ Points)
If NIFTY opens below 26,099, early sentiment turns cautious to bearish.
🎓 Educational Explanation:
Gap-downs are often emotion-driven. Strong demand zones can attract short-covering and value buying, leading to sharp reversals. Selling blindly into support increases risk.
Plan of Action:
First support to watch is 26,040.50 — observe candle structure and volume.
Breakdown below 26,040.50 opens the downside toward 25,920.85.
Strong bullish reversal signals near 25,920.85 may lead to a sharp intraday bounce.
Any pullback toward 26,099 after breakdown can be used as a selling-on-rise opportunity.
⚙️ Risk Management Tips for Options Traders 🛡️
Avoid trading the first 5–10 minutes during gap openings.
Don’t buy options at resistance or sell at support without confirmation.
Use a time-based stop-loss (15–20 minutes) if premium doesn’t move.
Risk only 1–2% of total capital per trade.
Prefer ATM options or defined-risk spreads to manage theta decay.
Book partial profits near marked resistance/support levels.
🧾 Summary & Conclusion
Above 26,212: Bulls remain active; targets 26,265 → 26,341.
Between 26,099–26,212: Market stays balanced; patience is key.
Below 26,099: Sellers gain control unless buyers defend 26,040.50 / 25,920.85.
Trade price behaviour at levels, not predictions.
Consistency comes from discipline, confirmation, and risk control.
⚠️ Disclaimer
I am not a SEBI-registered analyst. This trading plan is for educational purposes only and should not be considered financial or investment advice. Please consult your financial advisor before taking any trades.

NIFTY : Trading level and Plan for 23-Dec-2025📘 NIFTY Trading Plan for 23-Dec-2025
(Chart reference: 15-min | Gap criteria considered: 100+ points)
Key Levels to Track (from chart)
Opening Resistance: 26,266
Last Intraday Resistance: 26,331
Opening Support Zone: 26,100 – 26,147
Last Intraday Support: 26,010
Lower Support: 25,900
🟢 1. GAP-UP OPENING (100+ Points)
If NIFTY opens above 26,266, price will directly face a strong overhead supply zone.
🎓 Educational Explanation:
Gap-up openings reflect bullish overnight sentiment, but when price opens near resistance, profit booking and supply absorption usually occur. Smart traders avoid chasing and wait for acceptance or retest confirmation before committing.
Plan of Action:
Sustaining above 26,266 for 10–15 minutes allows pullback-based long entries.
Upside potential remains toward 26,331, the last intraday resistance.
Acceptance above 26,331 may extend the rally further; trail stops tightly.
Rejection near 26,266–26,331 can trigger a pullback toward 26,147.
Option buyers should avoid aggressive CE buying at the open; confirmation is key.
🟡 2. FLAT OPENING
A flat open near 26,150–26,200 keeps NIFTY inside the Opening Support Zone.
🎓 Educational Explanation:
Flat opens represent balance between demand and supply. Direction emerges only after a clear breakout or breakdown. Trading inside the range without confirmation often leads to whipsaws.
Plan of Action:
Sustaining above 26,266 turns momentum bullish, targeting 26,331.
Failure to cross 26,266 keeps price vulnerable to consolidation or pullback.
Breakdown below 26,100 shifts control to sellers toward 26,010.
Bullish rejection patterns near 26,100–26,147 provide low-risk bounce trades.
🔴 3. GAP-DOWN OPENING (100+ Points)
If NIFTY opens below 26,100, early sentiment turns cautious.
🎓 Educational Explanation:
Gap-down openings are often driven by fear. However, strong demand zones usually attract short-covering and value buying, leading to intraday reversals. Selling blindly at support increases risk.
Plan of Action:
First support to watch is 26,010 — observe price behaviour carefully.
Breakdown below 26,010 opens the path toward 25,900.
Bullish reversal signals near 25,900 may trigger a sharp bounce.
Any pullback toward 26,100 after breakdown becomes a selling-on-rise opportunity.
⚙️ Risk Management Tips for Options Traders 🛡️
Avoid trading the first 5–10 minutes on gap days.
Never buy options at resistance or sell at support without confirmation.
Use time-based stop-loss (15–20 minutes) if premium stalls.
Risk only 1–2% of capital per trade.
Prefer ATM options or spreads to manage theta decay.
Book partial profits near key resistance/support levels.
🧾 Summary & Conclusion
Above 26,266: Bulls remain active, targeting 26,331.
Between 26,100–26,266: Market stays range-bound; patience required.
Below 26,100: Sellers gain control unless buyers defend 26,010 / 25,900.
Trade price behaviour at levels, not emotions or predictions.
Consistency comes from discipline and risk control.
⚠️ Disclaimer
I am not a SEBI-registered analyst. This trading plan is for educational purposes only and should not be considered financial or investment advice. Please consult your financial advisor before taking any trades.

NIFTY : Trading levels and Plan for 19-Dec-2025📘 NIFTY Trading Plan for 19-Dec-2025
(Chart reference: 15-min | Gap criteria considered: 100+ points)
Important Levels from Chart
Opening Resistance: 25,848
Last Intraday Resistance: 25,923 – 25,951
Upper Target / Supply: 25,985
Opening Support (No-Trade Zone): 25,763 – 25,814
Last Intraday Support: 25,677 – 25,703
Extreme Support: 25,594
🟢 1. GAP-UP OPENING (100+ Points)
If NIFTY opens above 25,848, it directly enters the overhead resistance structure.
🎓 Educational Explanation:
A gap-up opening indicates overnight positive sentiment, but price often reacts near prior supply zones due to profit booking. Professional traders avoid chasing and instead wait for acceptance above resistance or a healthy retest.
Plan of Action:
Sustaining above 25,848 for 10–15 minutes can allow pullback-based long entries.
First upside hurdle is 25,923–25,951 (last intraday resistance zone).
Acceptance above 25,951 may extend the move toward 25,985.
Rejection or exhaustion near 25,923–25,951 can trigger a pullback toward 25,848.
Option buyers should prefer ATM/ITM Calls only after confirmation; avoid buying at the opening spike.
🟡 2. FLAT OPENING
A flat open near 25,800–25,830 places NIFTY inside the Opening Support / No-Trade Zone.
🎓 Educational Explanation:
Flat opens represent market indecision. During such phases, price tends to trap early buyers and sellers. Direction becomes clear only after a range breakout or breakdown, making patience crucial.
Plan of Action:
Break and sustain above 25,848 shifts momentum toward 25,923–25,951.
Failure to cross 25,848 keeps price vulnerable to a downside test.
Breakdown below 25,763 opens downside toward 25,703–25,677.
Watch for bullish reversal patterns near 25,763–25,814 for bounce trades.
🔴 3. GAP-DOWN OPENING (100+ Points)
If NIFTY opens below 25,763, selling pressure may dominate early.
🎓 Educational Explanation:
Gap-down openings are often driven by fear. However, strong historical demand zones usually attract buyers looking for value, leading to short-covering bounces. Selling blindly at support increases risk.
Plan of Action:
First demand zone to observe is 25,703–25,677; look for rejection or base formation.
A bounce from this zone can retrace toward 25,763–25,814.
Sustained breakdown below 25,677 exposes the 25,594 level.
Any pullback toward 25,763 after breakdown becomes a selling-on-rise opportunity.
⚙️ Risk Management Tips for Options Traders 🛡️
Avoid trading in the first 5–10 minutes during gap days.
Do not buy options near resistance or sell near support—wait for confirmation.
Use time-based stop-loss (15–20 minutes) if the premium fails to move.
Risk only 1–2% of total capital per trade.
Prefer ATM options or vertical spreads to manage theta decay.
Book partial profits near marked resistance/support zones.
🧾 Summary & Conclusion
Above 25,848: Bulls stay active with targets 25,951 → 25,985.
Between 25,763–25,848: Market remains range-bound; patience is key.
Below 25,763: Sellers gain control unless buyers defend 25,703–25,677.
Focus on price behaviour at levels, not prediction.
Consistency comes from discipline, not frequent trades.
⚠️ Disclaimer
I am not a SEBI-registered analyst. This trading plan is for educational purposes only and should not be considered financial or investment advice. Please consult your financial advisor before taking any trades.

NIFTY : Trading levels and Plan for 17-Dec-2025📘 NIFTY Trading Plan for 17-Dec-2025
(Based on key levels: 25,953 – 26,011 – 26,111 (resistances) and 25,874 – 25,747 – 25,771 – 25,647 (supports))
Gap criteria considered: 100+ points
🔵 1. GAP-UP OPENING (100+ Points)
If NIFTY opens above 25,953, it directly enters the resistance territory visible on the chart, where the market often tests supply zones.
🔍 Educational Logic:
When the index opens significantly higher, early buyers from the previous session tend to book profits. Hence the market may retest the breakout zone before showing a directional move. Understanding this behaviour prevents traders from chasing breakouts blindly.
Plan of Action:
If price opens above 25,953 and sustains for 15-min, look for long entries toward 26,011.
If 26,011 breaks with volume, expect a momentum push toward 26,111, the major intraday resistance.
A rejection wick or bearish Engulfing pattern at 26,011 = ideal for a small pullback trade back to 25,953.
For option buyers: Prefer CE entries only after a retest & confirmation; avoid buying at resistance.
🟠 2. FLAT OPENING
A flat open near the 25,874–25,880 zone places NIFTY exactly at the Opening Support/Resistance line.
🔍 Educational Logic:
Here the market is neutral, and the first 30 minutes typically decide the trend. The concept of "Opening Range" becomes very important—break of ORH/ORL gives a cleaner directional move. Avoid predicting the direction—wait for confirmation.
Plan of Action:
If price holds above 25,874, buyers may take charge and lead a move toward 25,953.
A breakout above 25,953 can extend quickly toward 26,011.
If NIFTY slips below 25,851, that becomes a weak sign → expect a move toward 25,771–25,747 support zone.
Watch for bullish reversal candle at 25,747–25,771 (buyers must try zone).
🔴 3. GAP-DOWN OPENING (100+ Points)
If NIFTY opens below 25,771, we enter a sentiment-driven weak zone.
🔍 Educational Logic:
Large gap-downs often occur due to overnight negative cues. The initial volatility is usually created by fear-based reactions. A structured trader waits for stability before entering. Many reversals also begin after a gap-down because early sellers exhaust quickly.
Plan of Action:
First support comes at 25,747–25,771 — monitor for a reversal setup.
If price fails to hold this zone, next downside target becomes 25,647, the major support.
A break below 25,647 with strong candles = trending bearish day; avoid bottom-fishing.
If reversal occurs near 25,747, expect a recovery toward 25,851 and later 25,874.
⚙️ Risk Management Tips for Option Traders
📌 These principles protect your capital and sustain long-term trading:
Never buy options at major resistance or support — wait for confirmation.
Follow time-stop: if your option doesn't move in 15–20 minutes despite the index moving, exit.
Maintain a fixed risk: reward of at least 1:2 on every directional trade.
Avoid trading in the first 5 minutes during 100+ point gaps — volatility is artificially high.
Define your loss level before entering; never widen your SL emotionally.
Scale-in only after the trade moves in your favour, not before.
🧾 Summary & Conclusion
A Gap-Up above 25,953 demands patience for a retest before long entries.
A Flat Open near 25,874 is a neutral scenario — rely on Opening Range breakout.
A Gap-Down below 25,771 invites caution; watch for reversal patterns at support zones.
Market structure is more important than prediction. Stick to confirmation-based entries and disciplined exits.
For option buyers, momentum zones and retest confirmations are crucial for high-quality trades.
⚠️ Disclaimer
I am not a SEBI-registered analyst. This trading plan is for educational purposes only and should not be considered financial advice. Please consult your financial advisor before making trading decisions.

NIFTY : Trading levels and Plan for 15-Dec-2025📊 NIFTY – TRADING PLAN FOR 15 DEC 2025 (Rewritten & Improved)
Price closed near 26,014, exactly at a midpoint where both buyers and sellers showed activity.
Your directional arrows indicate:
Green arrows → Areas where buyers are expected to step in strongly; ideal long setups after confirmation
Red arrows → Areas where sellers take control after buyer exhaustion; ideal short setups after breakdown & retest
Orange arrows → Areas where price is indecisive; avoid trading until breakout or breakdown
🚀 1. GAP-UP OPENING (100+ points)
1. If Nifty opens between 26,093 – 26,138
• This region reflects a hesitation zone, as shown by the orange arrows.
• Buyers and sellers are both active; market is likely to range.
• No trade here until market shows clear direction.
• Watch for:
– A breakout above 26,138 → follow the green arrow path, buyers take control → Targets 26,257 → 26,294.
– A rejection from 26,138 and fall below 26,093 → follow red arrow path, sellers gain momentum → Target 25,947.
2. If market opens above 26,138
• According to the green directional arrows, buyers are ready to continue the rally.
• Best trade:
– Wait for a minor pullback into 26,138 area
– Enter long on bullish confirmation
• Target zone remains 26,257–26,294.
• Ideal for option buyers due to direction clarity.
3. If gap-up opens only slightly above 26,014 but below 26,093
• The chart arrows show mixed direction — no strong trend yet.
• Wait for confirmation.
• Only trade after:
– Break and retest above 26,093 (long)
– Break below 25,947 (short)
⚖ 2. FLAT OPENING (around 26,000)
1. Price moves into 26,093 zone first (orange arrows)
• This is a stalling region — price may oscillate, offering no clear setup.
• Avoid trading until breakout or breakdown.
• Once direction is chosen:
– Above 26,093 → follow green arrows → long opportunity
– Below 25,947 → follow red arrows → short opportunity
2. If 25,947 holds strongly after open
• Buyers are showing interest exactly where the green arrows begin.
• Good long setup after a higher-low or bullish candle pattern.
• Targets: 26,014 → 26,093 → 26,138.
3. If price rejects 26,093 and turns down sharply
• This is aligned with first red arrow structure.
• Short only when price breaks 25,947 with momentum and retests.
• Targets: 25,885 → 25,771.
📉 3. GAP-DOWN OPENING (100+ points)
1. Opening near 25,885
• Your green arrows show this as a strong buyer reaction zone.
• Expect a possible reversal or stabilisation.
• Long setup only after:
– Wick rejections
– CHoCH / BOS
– Retest of intraday level
• Upside targets: 25,947 → 26,014 → 26,093.
2. If 25,885 breaks and price fails retest
• This confirms the red arrows' downward continuation path.
• Best short entry:
– Break
– Retest
– Confirmation candle
• Targets: 25,771.
3. If price opens directly near 25,771
• This is where the strongest fight occurs before the market chooses direction — shown by mixed arrows.
• Avoid immediate entry.
• Only trade once:
– Strong reversal appears (long)
– Or level breaks and confirms (short)
🛡 RISK MANAGEMENT FOR OPTIONS TRADERS
1. Avoid trading the first 5 minutes, especially on gap days.
2. SL must be based on SPOT price, not premium.
3. Follow arrow direction strictly:
– Green arrows → Consider CE / long futures
– Red arrows → Consider PE / short futures
– Orange arrows → Avoid trades completely
4. Do not buy far OTM options during consolidation.
5. When in profit, trail SL — especially near 26,138 & 26,257 resistance.
6. Respect max loss limit: stop for the day if you hit 1–2% capital loss.
📌 SUMMARY & CONCLUSION
• Green arrows = Buyer strength zones → Best long setups with good R:R.
• Red arrows = Short continuation zones → Ideal areas to short after breakdown confirmation.
• Orange arrows = No-trade areas → Wait for breakout; don’t force trades.
• Above 26,138, bullish momentum increases.
• Below 25,947, bearish continuation strengthens.
• Profit booking expected at 26,257–26,294.
This plan aligns exactly with the direction suggested by your arrows and provides a clean, professional decision-making framework.
⚠ DISCLAIMER
I am not a SEBI-registered analyst.
This plan is only for educational purposes.
Trade using your own analysis and risk management.
