NIFTY : Trading levels and plan for 10-Jul-2025📊 NIFTY INTRADAY PLAN – 10 JULY 2025 (15min TF)
Educational setup with key intraday levels and directional bias – Based on price behavior and reaction zones
📍 Reference Close: 25,467.10
📈 Consider Gap-up or Gap-down if the opening is 100+ points away from this close.
⏱️ Allow the first 15–30 minutes for volatility to settle before taking directional trades.
🔍 KEY LEVELS TO MONITOR
Opening Resistance: 25,582
Last Intraday Resistance: 25,621 – 25,644
No Trade Zone: 25,439 – 25,491
Last Intraday Support: 25,377
Buyer’s Support (Must Try Zone): 25,196 – 25,229
Major Resistance (Profit Booking Zone): 25,737
📈 SCENARIO 1: GAP-UP OPENING (Above 25,582)
Bias: Bullish to Consolidation at upper resistance
If Nifty opens 100+ points higher and sustains above 25,582 , upside may extend to 25,621–25,644 zone.
Watch for rejection candles or indecision near 25,644 – this is a potential supply zone.
If bullish momentum is strong, price may hit 25,737 , but caution near that level for profit booking.
Shorts only if strong reversal seen at resistance with volume and price failing to hold above 25,621.
📊 SCENARIO 2: FLAT OPENING (Within 25,439 – 25,491 – the No Trade Zone)
Bias: Wait & Watch – Let the market show its hand
Flat openings inside the No Trade Zone (25,439–25,491) often lead to whipsaws and indecisive moves.
Avoid taking trades inside this zone unless price breaks out or breaks down with strength.
Upside breakout above 25,491 should retest 25,582; downside breakdown below 25,439 may lead to support testing at 25,377.
Best strategy is to wait for directional clarity before entering trades.
📉 SCENARIO 3: GAP-DOWN OPENING (Below 25,377)
Bias: Bearish to Neutral – Watch for demand reaction
A 100+ point gap-down opening below 25,377 will take price closer to Buyer’s Support Zone (25,196–25,229) .
Observe buyer activity in this green zone – a bullish engulfing or hammer can provide bounce trades.
Avoid fresh shorts in this area unless there’s a breakdown below 25,195 with volume.
Any recovery from this support can revisit 25,377 or even test No Trade Zone.
💡 OPTIONS RISK MANAGEMENT TIPS:
Avoid directional trades in the first 15 minutes of the market
Don’t trade blindly inside No Trade Zones – wait for breakout confirmation
Use spreads (Bull Call/Bear Put) instead of naked options in choppy markets
Avoid overleveraging, especially around volatile zones like 25,582 and 25,196
Respect time decay – avoid buying weekly options post 2 PM unless clear momentum
Use strict SL (based on 15min candle close) to control emotional trades
📌 SUMMARY – KEY TAKEAWAYS
Bullish above 25,582 – but resistance ahead at 25,644–25,737
Sideways in 25,439–25,491 – best to stay out
Bearish or bounce watch below 25,377 – strong support at 25,196–25,229
Plan the trade, and trade the plan. React, don’t predict.
⚠️ DISCLAIMER: I am not a SEBI-registered analyst. All views shared here are for educational purposes only. Please consult your financial advisor before making any trading decisions.
Niftytradesetup

SENSEX INTRADAY LEVELS ( EDUCATIONAL PURPOSE ) 09/07/2025🔹 SENSEX Intraday Trade Plan – 9 July
📊 Analysis: 15-min TF | Execution: 1-min TF
🔵 GAP-UP Opening (Above 83,750)
📌 Plan: Avoid chasing the gap. Look for reversal or a retest
🔁 Entry: Sell below 5-min breakdown or rejection from 83,750–83,800
🛑 SL: 25–30 pts above high
🎯 Target: 83,580 – 83,500
🔻 GAP-DOWN Opening (Below 83,400)
📌 Plan: Avoid panic selling. Wait for price to reclaim or reversal
🔁 Entry: Buy above 5-min high after reclaim or strong bullish candle
🛑 SL: 25–30 pts below low
🎯 Target: 83,600 – 83,750
📏 NORMAL OPEN (Between 83,400–83,750)
🔁 Range Play Setup:
Buy near 83,400–450 (support zone)
Sell near 83,700–750 (resistance zone)
🛑 SL: 20–30 pts beyond level
🎯 Target: 50–70 pts
🚀 Breakout Trade Setup
🔁 Entry: Above 83,800 breakout candle
🛑 SL: Below breakout bar
🎯 Target: 83,900 – 84,000
🔁 Breakdown Trade Setup
🔁 Entry: Below 83,350 breakdown candle
🛑 SL: Above breakdown bar
🎯 Target: 83,200 – 83,100
📌 Note: Stick to risk management. Avoid overtrading in sideways zone. Use confirmation on 1-min candle before entry.

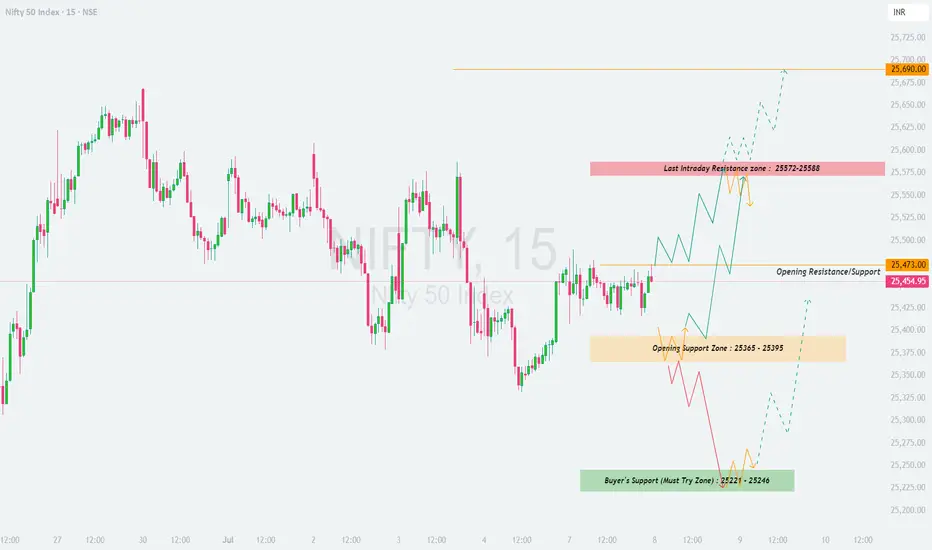
NIFTY : Trading levels and plan for 08-July-2025📊 NIFTY TRADING PLAN – 08 July 2025
(Based on 15-min chart structure – For educational purposes only)
Gap Opening Reference: 100+ pts
Structure favors breakout or reversal play from key zones.
Let price settle in first 15–30 mins before executing any plan.
🔍 Key Zones to Watch:
Opening Resistance/Support: 25,473
Opening Support Zone: 25,365 – 25,395
Buyer’s Must-Hold Zone: 25,221 – 25,246
Last Intraday Resistance: 25,572 – 25,588
Major Resistance (Profit Booking): 25,690
📈 SCENARIO 1: GAP-UP OPENING (100+ pts above 25,473)
If NIFTY opens above 25,572 and sustains, expect price to test the 25,690 zone.
Look for signs of reversal near 25,690 to book longs or consider a short with SL above the zone.
If price fails to hold above 25,572, it may fall back toward 25,473.
📉 SCENARIO 2: FLAT OPENING (within 25,454 – 25,473 range)
Avoid early trades — let the price action confirm direction.
Break above 25,473 can take NIFTY toward 25,572–25,588.
Break below 25,395 may open downside toward 25,246.
📉 SCENARIO 3: GAP-DOWN OPENING (100+ pts below 25,365)
Watch for support near 25,221–25,246 zone — a strong demand area.
If price bounces with bullish structure, a reversal trade can be taken with defined SL.
Break and sustain below 25,221 could invite further selling toward 25,080.
💡 OPTIONS RISK MANAGEMENT TIPS:
Trade only near defined levels with confirmation.
Use spreads (e.g., bull call/bear put) during high volatility to reduce risk.
Avoid buying deep OTM options unless there's a strong trending move.
Always define SL and adhere to position sizing rules.
📌 SUMMARY:
Above 25,473 = Bullish bias
Below 25,365 = Bearish bias
25,221–25,246 = Strong reversal zone
Wait for price action to confirm before taking positions
⚠️ DISCLAIMER: I am not a SEBI-registered advisor. This plan is for educational purposes only. Please do your own research or consult a financial advisor before trading.
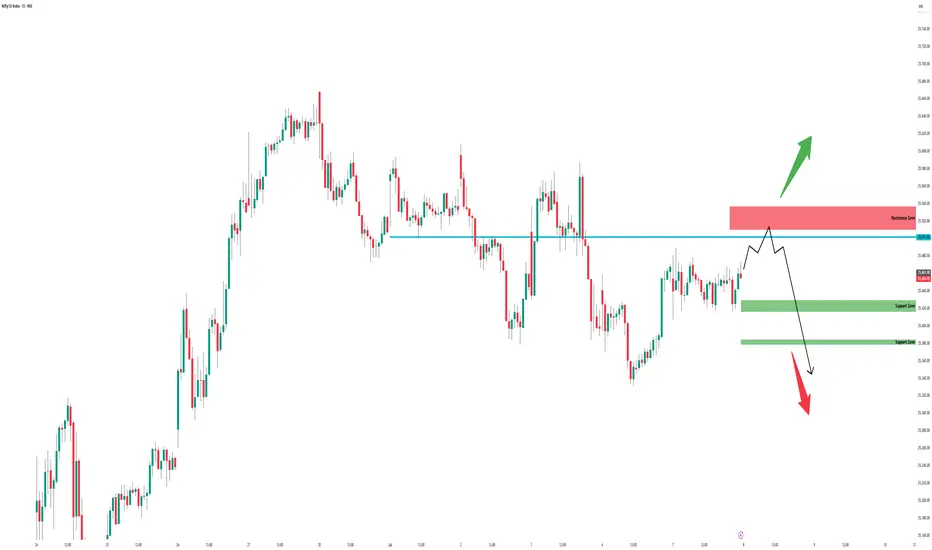
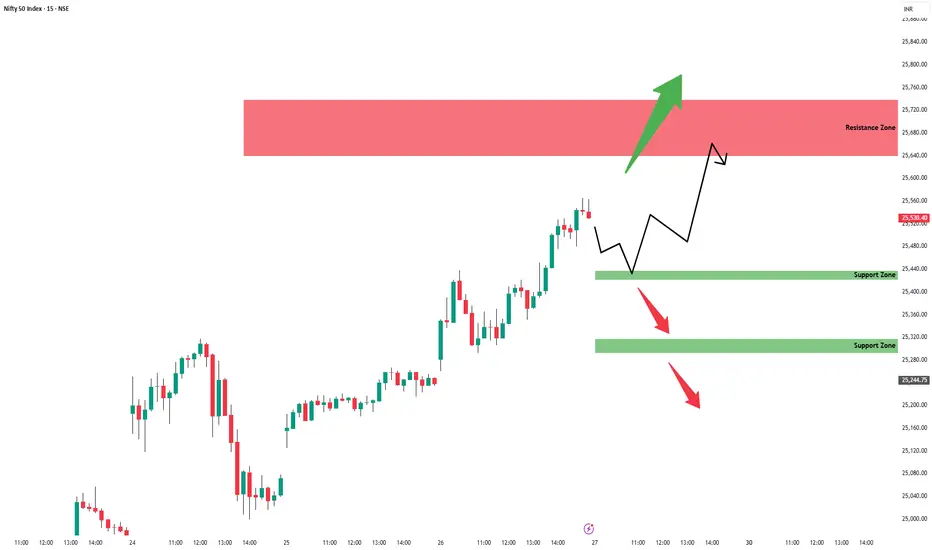
Nifty - Intraday levels & Prediction for - 08 Jul 2025Nifty Prediction for Tomorrow:
Trend : BEARISH reversal
Sentiment : Positive
Expectation : Nifty looks weaker and has high possibility of going down upto 25200/25100 levels. BULLISH only above 25540 if Nifty sustains above the resistance zone.
Look for Buy/Sell at Demand and Supply zone for profitable trades.
Demand and Supply Zones - When price breaks the zone, Demand zone will become Resistance and Supply zone will become Support.
Refer the chart for detailed Intraday Support and Resistance levels.
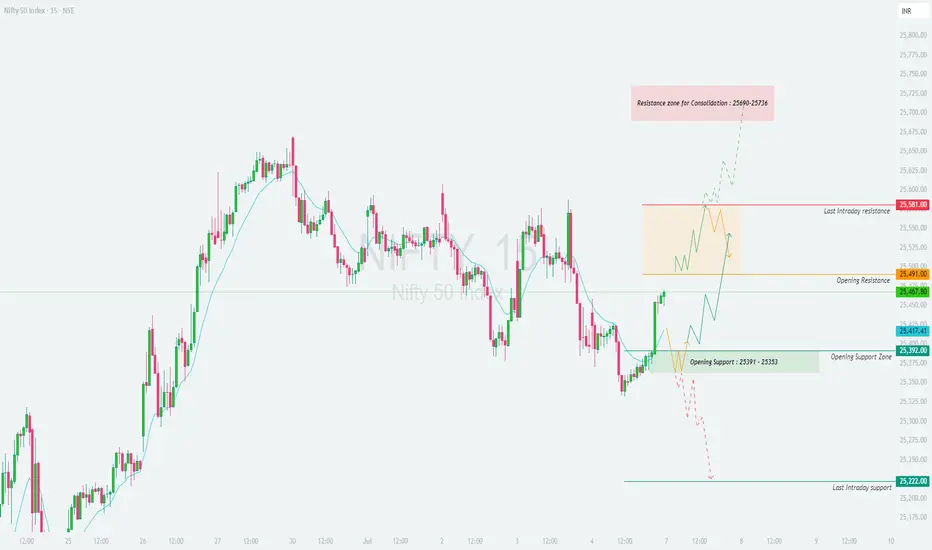
NIFTY : Trading levels and plan for 07-July-2025📘 NIFTY INTRADAY TRADING PLAN – 07-Jul-2025
🕒 Chart Timeframe: 15-Min | 🧭 Approach: Zone-Based Price Action | 🎯 Focus: Scalping to Positional Intraday
📍 Important Levels:
🔸 Opening Support Zone: 25,391 – 25,353
🔹 Opening Resistance Zone: 25,491
🔸 Last Intraday Resistance: 25,581
🔺 Major Resistance for Consolidation: 25,690 – 25,736
🔻 Last Intraday Support: 25,222
🟩 1. GAP-UP Opening (100+ points above 25,491)
If Nifty opens near or above 25,600, it will enter the last Intraday Resistance Zone and approach the Consolidation Resistance Zone (25,690–25,736).
📈 Action: Wait for a candle close above 25,581, then buy on strength toward 25,690–25,736.
🔄 Partial Booking: Consider profit booking in the upper consolidation zone.
📉 Rejection Trade: If strong reversal appears near 25,736, aggressive traders may short for a pullback to 25,491 with tight SL above the highs.
🛑 Stop Loss: Below 15-min candle low (for long) or above rejection high (for short).
🟨 2. Flat Opening (between 25,417 – 25,491)
This is the Opening Resistance Band—expect sideways price behavior in the first 15–30 mins.
📊 Wait for price to either break above 25,491 or fall below 25,417 with strength.
📈 Long Setup: If price crosses 25,491, ride it toward 25,581. Book partial at this resistance.
📉 Short Setup: Breakdown below 25,417 opens up support test at 25,391 – 25,353.
🧠 Tip: Avoid trades within the orange range (25,417–25,491) unless breakout is clear.
🟥 3. GAP-DOWN Opening (100+ points below 25,353)
This brings price closer to Opening Support and possibly into Breakdown Territory.
📉 Breakdown Trade: If price opens below 25,353 and fails to recover in first 15–30 mins, consider shorting toward 25,222 (Last Support).
📈 Reversal Trade: If price rebounds sharply and crosses back above 25,417, initiate reversal long with targets at 25,491.
🛑 SL Management: Use 15-min candle close basis – especially near support/resistance edges.
⚠️ Avoid shorts near 25,222 unless clean breakdown occurs.
💡 Risk Management Tips for Options Traders:
✅ Use ATM or slightly ITM options for directional trades; avoid deep OTM in the morning.
✅ Avoid trading aggressively in the first 15 mins—allow price to settle.
✅ For rangebound markets, prefer option selling strategies like Iron Condor or Strangle.
✅ Set a maximum loss limit for the day (1–2% of capital) and stick to it.
✅ Avoid emotional averaging—follow the plan or stay out.
📝 Summary & Conclusion:
📌 Above 25,581, Nifty could push into a high-consolidation resistance near 25,736
📌 Failure to sustain above 25,491 may result in a pullback to the support zone
📌 Break below 25,353 brings the 25,222 zone into play
📌 Wait for the first 15–30 mins to reduce fakeouts—zone-based trading will offer best R:R setups.
⚠️ Disclaimer:
I am not a SEBI-registered analyst . This plan is shared purely for educational purposes. Please consult a registered financial advisor or conduct your own analysis before making any trades.
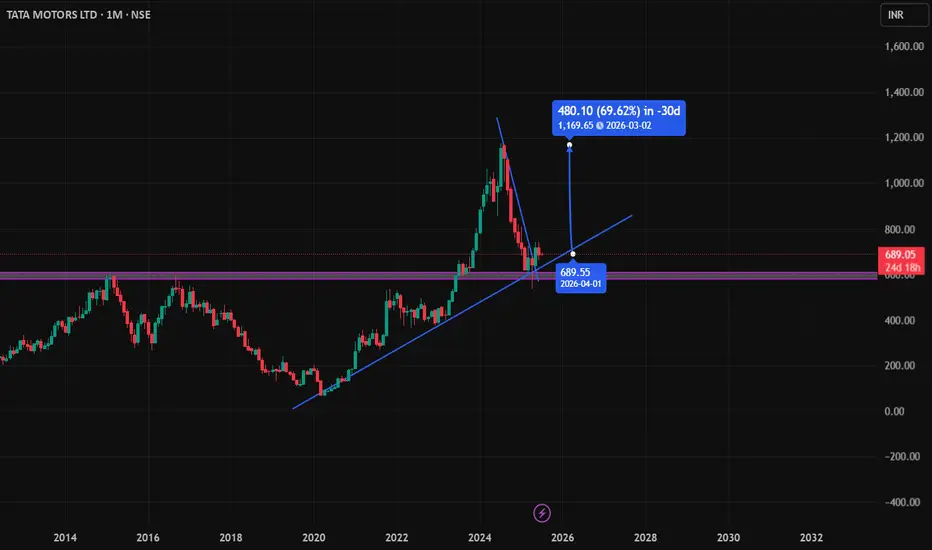
Tata Motors Long SetupTata Motors has confirmed a breakout from its recent downtrend, indicating a potential reversal. The breakout is supported by the formation of a strong bullish candle right at a key support zone, signaling renewed buying interest. This setup suggests favorable risk-reward for a long position, especially with increasing volume and momentum backing the move. Traders can consider entering above the breakout candle with a stop loss below the support.
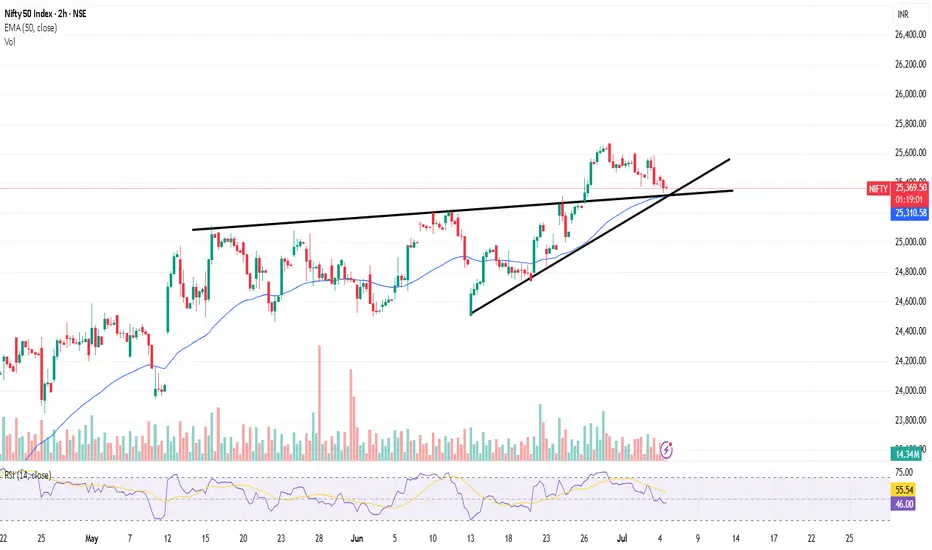
NIfty Bullish Breakout RetestHello Everyone,
Profit Booking in nifty from 25660 to now 25330__RSi also adjusted from overbought to now at 45-50 Volume shows sellers dont have enough strenth to push the market down ....Clearly Buy on dips set up with all the conflunence EMA support and Trendline support makes set up more stronger.
Get ready For new Lifetime High.
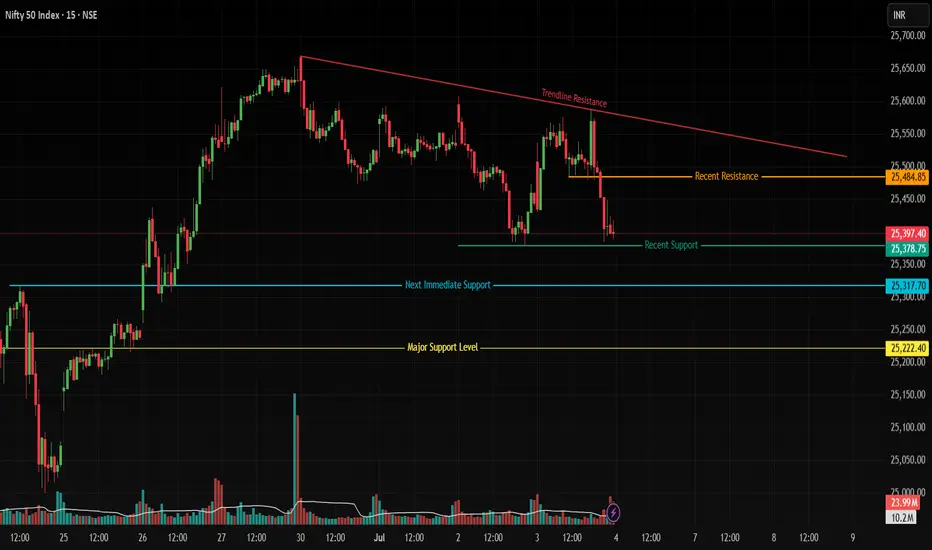
Nifty50 Analysis for 04/07/2025: 25,400 Key Intraday LevelCurrent Context: Nifty50 trading near 25,400, a tested support zone. Market structure suggests two potential scenarios based on price reaction at this level.
🔍 Key Levels to Monitor
Immediate Support: 25,400 (recent price anchor)
Next Supports: 25,300 (minor swing low) → 25,220 (major historical base)
Near-Term Resistance: 25,480 (recent swing high)
Trendline Resistance: 25,575 (drawn from June 30 highs)
📈 Bullish Scenario Framework
Observation Criteria: A robust green candle closing above 25,400.
Potential Structure:
Break above 25,480, Recent Resistance (Orange line) may signal momentum toward 25,575 trendline resistance.
Note: Volume confirmation could strengthen validity.
📉 Bearish Scenario Framework
Observation Criteria: Strong red candle closing below 25,400.
Potential Structure:
Sustained move below 25,400 opens 25,300 zone (Blue Line) as next interest area.
25,220 becomes focal point if 25,300 fails to hold.
🔎 Why This Matters
25,400 Significance: Acts as a hinge between recent consolidation (bullish) and distribution (bearish).
Volume & Candles: Strength/weakness in breakouts may be validated by volume spikes.
Trendline Context: 25,575 aligns with a 4-session descending trendline (tested twice).
⚠️ Disclaimer
This idea highlights observed market structure levels and is not trading advice. It does not constitute a recommendation to buy/sell securities or any financial instrument. Market conditions change rapidly; always conduct independent analysis and consider your risk tolerance before trading. Past performance is not indicative of future results.
We may see Sell on Rise in Nifty as Momentum fades downSo now 25420 Support has been breached in NSE:NIFTY . Next would be 25222 as we analysed on weekly Nifty commentary.
Today's candle in #NIfty is a Squat Candle which forms when traders book profit on rise. However, Buyers were still stronger than Sellers by 6 million volume.
Seems like a Short Build up pattern.
Volume rising + Momentum is falling = we will short on a bounce. Option traders must note this.
After 25222, 25050 could be the next important support.
Resistance for Nifty would be at 25600.
We can see a decent short covering if we close above this.
NSE:BANKNIFTY looks weaker. NSE:CNXPSUBANK couldn't push it as expected.
Support to open new short term position is now marked at 56111.
Talking about the Sector specific trades, NSE:CNXPHARMA , #AUTOCOMPONENTS AND NSE:CNXIT tops the list.
Remember, this is no time to open Short term positions. We will soon get that good opportunity. So keep some cash handy so that you can the chance when there is opportunity is visible.
Currently is the time to do just Intraday and Swing trading.
That will be all for the day. Don't forget to use strict SL in this market. Do not use MTF trading.
Take care. Have a profitable tomorrow.

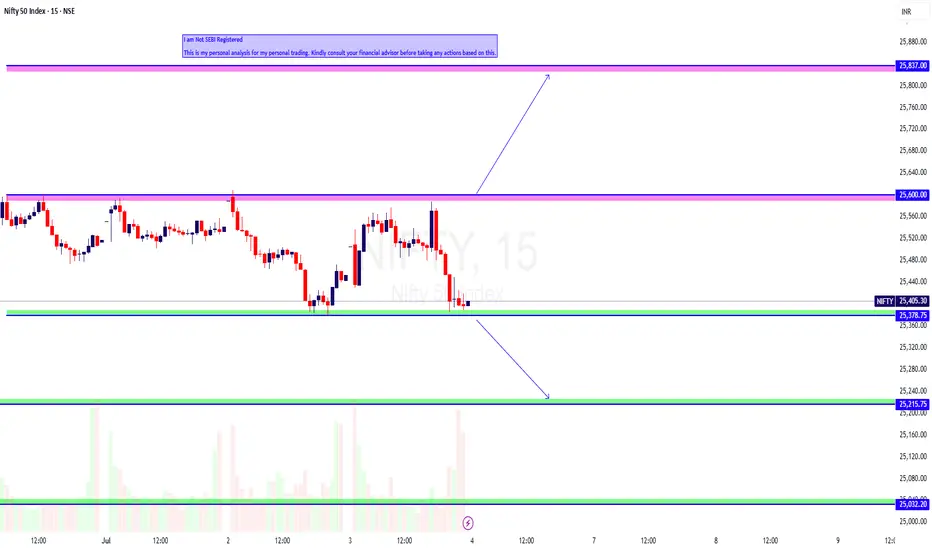
NIFTY Intraday Trade Setup For 4 Jul 2025NIFTY Intraday Trade Setup For 4 Jul 2025
Bullish-Above 25600
Invalid-Below 25550
T- 25837
Bearish-Below 25370
Invalid-Above 25420
T- 25215
NIFTY has closed on a slight bearish note with 0.19% cut today. Index has turned sell on rise since it has closed below PDL on 30 Jun. Buy on dip approach sentiment will be activated again if it closes above PDH in daily TF. Coming to Friday's trade setup, if index opens flat and a 15 Min candle closes above 25600 then will long , level has been tested multiple times in intraday. Short below 25370. A good flow below the same can be expected on flat opening.
In case of a big gap up/down, wait till 10 o'clock and mark the high and low of the trading range (5MIN). Trade on this range breakout.
==========
I am Not SEBI Registered
This is my personal analysis for my personal trading. Kindly consult your financial advisor before taking any actions based on this.
Nifty - Intraday levels & Prediction for - 03 Jul 2025 (Expiry)Nifty Prediction for Tomorrow:
Trend : Sideways then BULLISH Reversal
Sentiment : Negative but will change to Positive
Expectation : Nifty almost tested 15m 200 EMA but still there is a gap to fill, once its done we can see good BULLISH reversal in Nifty for New high. Some sort of consolidation will take place in the first half then good move likely to come.
Look for Buy/Sell at Demand and Supply zone for profitable trades.
Demand and Supply Zones - When price breaks the zone, Demand zone will become Resistance and Supply zone will become Support.
Refer the chart for detailed Intraday Support and Resistance levels.
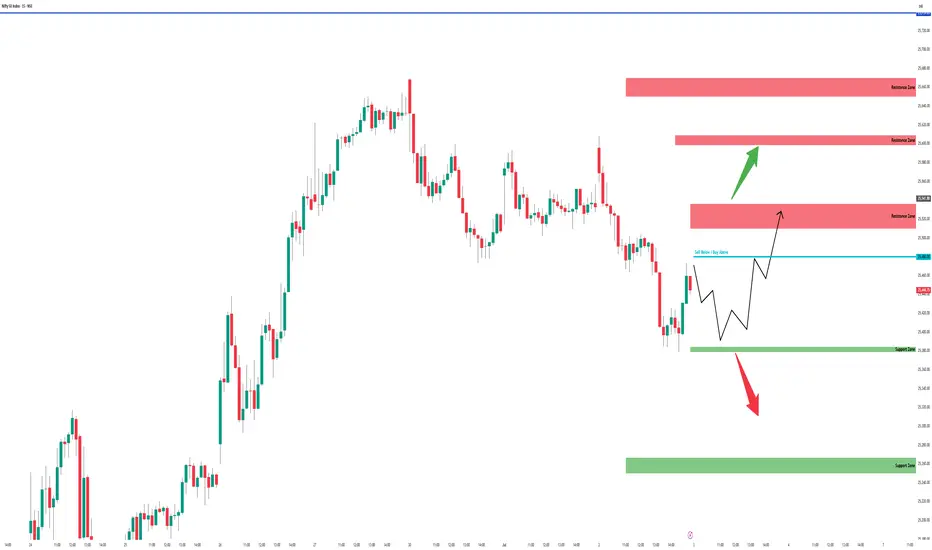
NIFTY : Trading levels and plan for 02-Jul-2025\ 📊 NIFTY TRADING PLAN – 2-Jul-2025\
📍 \ Previous Close:\ 25,533
📏 \ Gap Opening Consideration:\ ±100 points
🧭 \ Key Zones to Monitor:\
🔸 \ Opening Resistance:\ 25,581
🔸 \ Last Intraday Resistance:\ 25,628
🟥 \ Strong Resistance on Daily Chart:\ 25,690 – 25,760
🟦 \ Opening Support Zone:\ 25,429 – 25,450
🔻 \ Last Intraday Support:\ 25,330
🔻 \ Extreme Support:\ 25,239
---
\
\ \ 🚀 GAP-UP OPENING (Above 25,628):\
If NIFTY opens above \ 25,628\ , it breaks the last intraday resistance and moves toward the daily resistance zone \ 25,690–25,760\ . Expect buyers to book partial profits here, which may cause a sideways movement or minor reversal.
✅ \ Plan of Action:\
• If price sustains above 25,690, expect further upside but beware of profit-booking near 25,760
• A pullback towards 25,628–25,581 may give a re-entry opportunity
• Avoid shorts unless a bearish reversal pattern forms at 25,760
🎯 \ Trade Setup:\
– Buy above 25,690 with SL below 25,640, Target: 25,760
– Sell only if price rejects 25,760 with confirmation
📘 \ Tip:\ Avoid chasing the move post-gap-up. Wait for 15–30 min of structure.
\ \ ⚖️ FLAT OPENING (Between 25,450 – 25,581):\
This opening keeps NIFTY inside the key action zone. Since the structure is tight, breakout from either side can offer directional moves.
✅ \ Plan of Action:\
• Wait for a clear breakout above 25,581 or breakdown below 25,450
• Avoid taking trades inside 25,450–25,581 unless directional bias builds up
• Watch for volume and price expansion beyond these levels
🎯 \ Trade Setup:\
– Buy above 25,581, SL: 25,533, Target: 25,628–25,690
– Sell below 25,450, SL: 25,490, Target: 25,330
📘 \ Tip:\ Consider deploying directional option spreads (e.g., debit spreads) post-breakout.
\ \ 📉 GAP-DOWN OPENING (Below 25,429):\
A gap-down below \ 25,429\ enters the opening support area, and if this breaks, the next target is the \ last intraday support at 25,330\ , followed by \ 25,239\ .
✅ \ Plan of Action:\
• If price holds 25,429–25,450, watch for intraday reversal setup
• If it breaks and sustains below 25,330, expect further weakness
• Trade light early, and scale in only if trend persists
🎯 \ Trade Setup:\
– Buy reversal at 25,430–25,450 with bullish confirmation; SL: 25,400, Target: 25,533
– Sell below 25,330, SL: 25,375, Target: 25,239
📘 \ Tip:\ Use OTM put options rather than naked futures for safer risk-defined entries.
---
\ 📌 SUMMARY & LEVELS TO WATCH:\
✅ \ Bullish Above:\ 25,581 → 25,628 → 25,690–25,760
🔽 \ Bearish Below:\ 25,450 → 25,330 → 25,239
📉 \ Tight Range Zone:\ 25,450–25,581 → Wait for a breakout
---
\ 💡 OPTIONS TRADING RISK MANAGEMENT TIPS:\
🧠 \ Smart Traders Should:\
• Prefer option spreads to limit risk and manage theta decay
• Set alerts at key levels and wait for confirmations
• Avoid weekly options if there's uncertainty around direction
🚫 \ Avoid These Traps:\
• Over-leveraging on directional bias
• Holding naked options during choppy consolidation
• Trading without SL or re-entry plan
📘 \ Pro Tip:\ Consider selling iron condors if volatility remains in check near expiry.
---
\ ⚠️ DISCLAIMER:\
I am not a SEBI-registered analyst. This trading plan is purely for educational purposes. Please consult your financial advisor before making any investment decisions. Trade with proper stop-loss and risk management at all times.
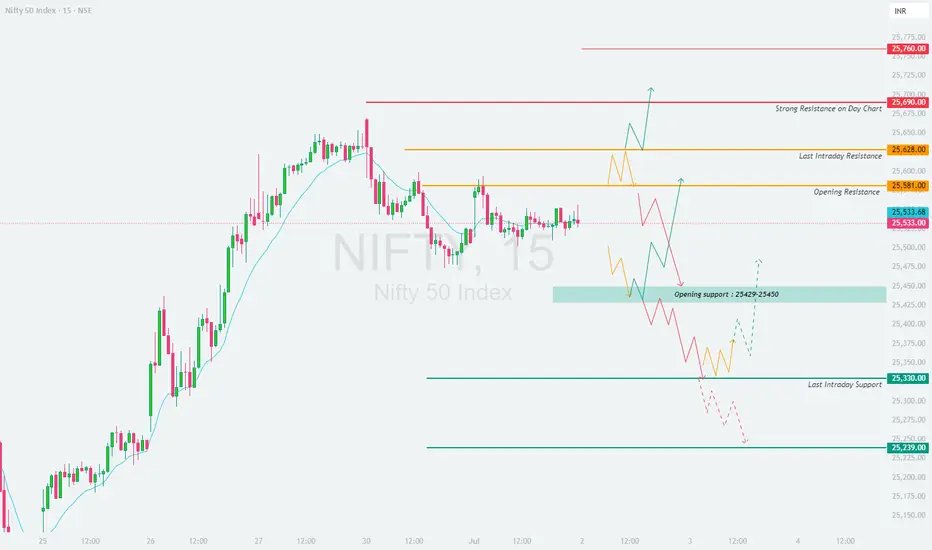
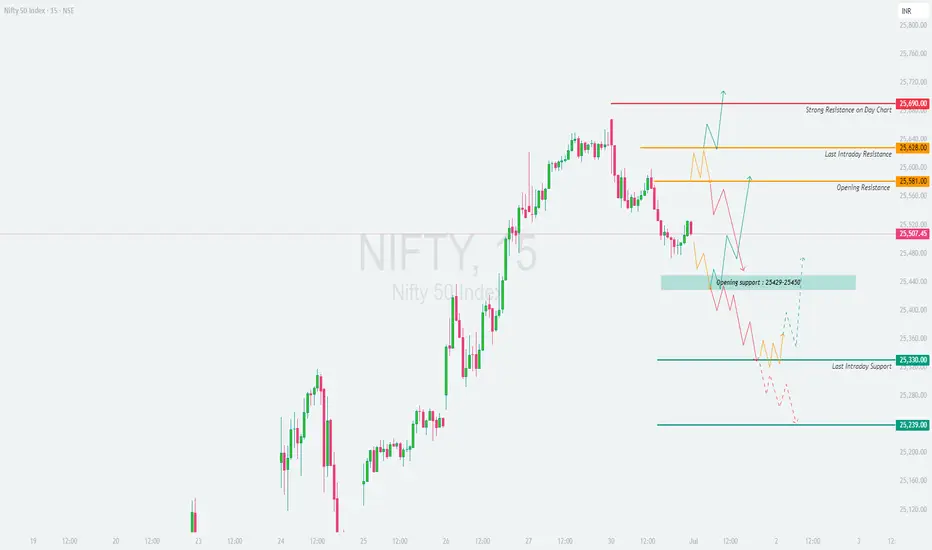
NIFTY - TRADING LEVELS AND PLAN FOR 01-JUL-2025
\ 📊 NIFTY TRADING PLAN – 1-Jul-2025\
📍 \ Previous Close:\ 25,507
📏 \ Gap Opening Consideration:\ ±100 points
🧭 \ Key Zones to Monitor:\
🔴 Strong Resistance on Day Chart: \ 25,690\
🟧 Last Intraday Resistance: \ 25,628 – 25,640\
🟨 Opening Resistance: \ 25,581\
🟦 Opening Support: \ 25,429 – 25,450\
🟩 Last Intraday Support: \ 25,330\
🟫 Final Support: \ 25,239\
---
\
\ \ 🚀 GAP-UP OPENING (Above 25,640):\
A gap-up above \ 25,640\ pushes Nifty into the \ Strong Resistance zone\ visible on the daily chart. This area may trigger profit booking unless broken with strong volume and momentum.
✅ \ Plan of Action:\
• Wait for a 15-min candle close above 25,690 for confirmation of breakout
• If price stalls or forms reversal patterns, initiate short trade setups
• Only aggressive buyers may consider long trades above 25,690 if follow-up candles are strong
🎯 \ Trade Setup:\
– \ Buy above:\ 25,690, SL: 25,628, Target: Trailing towards 25,750+
– \ Sell near resistance:\ 25,675–25,690 zone if reversal confirmed, SL: 25,705, Target: 25,581
📘 \ Tip:\ Avoid buying directly into resistance. Wait for a breakout + retest for cleaner entries.
\ \ ⚖️ FLAT OPENING (Near 25,500 – 25,540):\
Flat openings near the \ Opening Resistance (25,581)\ can create indecisive sideways moves in early sessions.
✅ \ Plan of Action:\
• If price breaks above 25,581 with strength, look for long trades
• If price faces rejection near 25,581 or 25,628, wait for breakdown below 25,507 to confirm weakness
• Below 25,507, next support lies at the 25,429–25,450 zone
🎯 \ Trade Setup:\
– \ Buy above breakout of 25,581, SL: 25,500, Target: 25,628–25,690
– \ Sell below 25,507, SL: 25,581, Target: 25,450 or lower
📘 \ Tip:\ Flat opens are best traded on confirmation candles, not assumptions. Avoid overtrading.
\ \ 📉 GAP-DOWN OPENING (Below 25,400):\
A gap-down below 25,400 opens the day near the \ Opening Support zone of 25,429–25,450\ . This area is critical — a bounce or breakdown will define the day.
✅ \ Plan of Action:\
• If price shows bullish reversal signs near 25,429, consider a pullback trade
• Breakdown of 25,429 with volume may extend downside toward 25,330 and even 25,239
• Avoid chasing long trades unless price stabilizes above 25,450
🎯 \ Trade Setup:\
– \ Buy near support:\ 25,429 with SL below 25,390, Target: 25,507
– \ Sell on breakdown below 25,429, SL: 25,450, Target: 25,330 – 25,239
📘 \ Tip:\ Gap-down opens attract trap setups. Let the market settle before committing.
---
\ 🧭 KEY LEVELS – QUICK REFERENCE:\
🔺 \ Strong Resistance:\ 25,690
🟧 \ Last Resistance:\ 25,628 – 25,640
🟨 \ Opening Resistance:\ 25,581
🟦 \ Opening Support:\ 25,429 – 25,450
🟩 \ Intraday Support:\ 25,330
🟥 \ Final Support:\ 25,239
---
\ 💡 OPTIONS TRADING – RISK MANAGEMENT TIPS:\
✅ Stick to \ defined range breakouts\ before entering directional trades
✅ Don’t overleverage into gap-ups/downs; let premiums cool
✅ \ Avoid selling naked options\ without clear structure
✅ Protect capital with \ hedged strategies\ like debit spreads
✅ \ Exit when your reason is invalidated\ , not when SL hits randomly
🛡️ \ Always use stop-losses\ , especially in high-IV environments.
---
\ 📌 SUMMARY:\
• 📈 \ Bullish above:\ 25,581 → 25,640 → 25,690
• 📉 \ Bearish below:\ 25,507 → 25,429 → 25,330
• 🚫 \ No trade zone:\ 25,507–25,581 (if inside, wait for clarity)
🎯 \ Focus Zones:\
– Long breakout above 25,581
– Short breakdown below 25,429
– Reversal plays at 25,429 or 25,239 if structure supports
---
\ ⚠️ DISCLAIMER:\
I am not a SEBI-registered analyst. This content is shared only for educational purposes. Please do your own analysis or consult a professional financial advisor before taking trades. Risk management is essential—never trade without a stop-loss and always protect your capital.
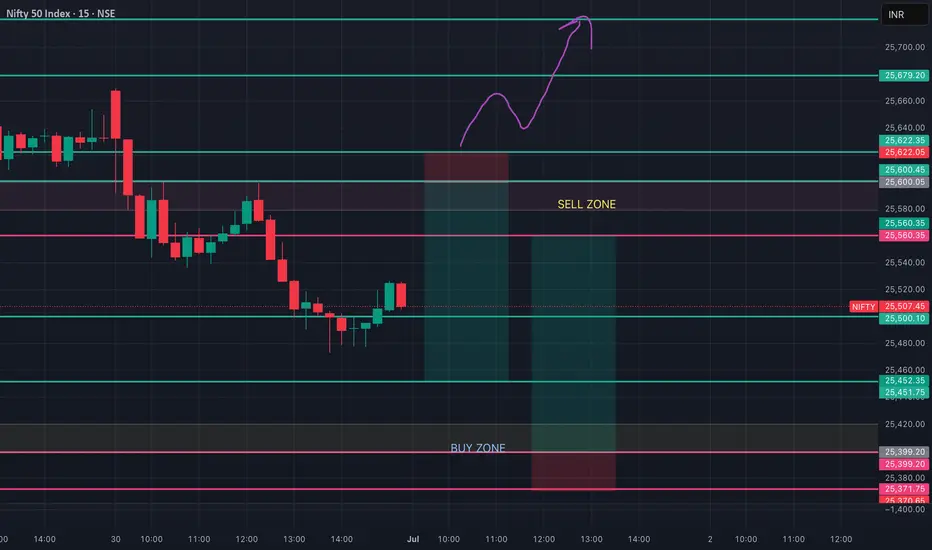
NIFTY INTRADAY LEVEL ( EDUCATIONAL PURPOSE) 01/07/2025🔷 Nifty Intraday Trade Plan – 1 July
📊 Analysis: 15-min TF | Execution: 1-min TF
🔸 GAP-UP Opening (Above 25,600)
📌 Plan: Avoid early longs. Wait for price rejection or reversal pattern.
🔁 Entry: Sell on breakdown below 5-min candle low
🛑 SL: 15–20 pts above day’s high
🎯 Target: 25,450 – 25,500
🔹 GAP-DOWN Opening (Below 25,400)
📌 Plan: Avoid panic selling. Wait for reclaim of early resistance
🔁 Entry: Buy if price reclaims 5-min opening high
🛑 SL: 15–20 pts below swing low
🎯 Target: 25,500 – 25,560
⚫ NORMAL Opening (Between 25,400–25,600)
📌 Range Play Setup
🔸 Sell Zone: Near 25,580–600 (resistance area)
🔹 Buy Zone: Near 25,420–440 (support area)
🛑 SL: 15–20 pts beyond trigger zone
🎯 Target: 30–40 pts
🔺 Breakout Trade Setup
🔁 Entry: Above 25,600 breakout candle (1-min TF)
🛑 SL: Below breakout bar
🎯 Target: 25,680 – 25,720
📌 Note: Respect price action & levels. Execute only if structure aligns with plan.
🧠 Discipline > Prediction
Nifty - Intraday levels & Prediction for - 01 Jul 2025Nifty Prediction for Tomorrow:
Trend : Sideways to Moderately BEARISH upto 25300 - 25400
Sentiment : Positive
Expectation : Nifty will test 15m 200 EMA before takes the reversal towards uptrend.
Look for Buy/Sell at Demand and Supply zone for profitable trades.
Demand and Supply Zones - When price breaks the zone, Demand zone will become Resistance and Supply zone will become Support. If Nifty Sustains above 24900 tomorrow we can see good rally upto 25080 Resistance. Any breakout above 25100 and next resistance 25200
Refer the chart for detailed Intraday Support and Resistance levels.
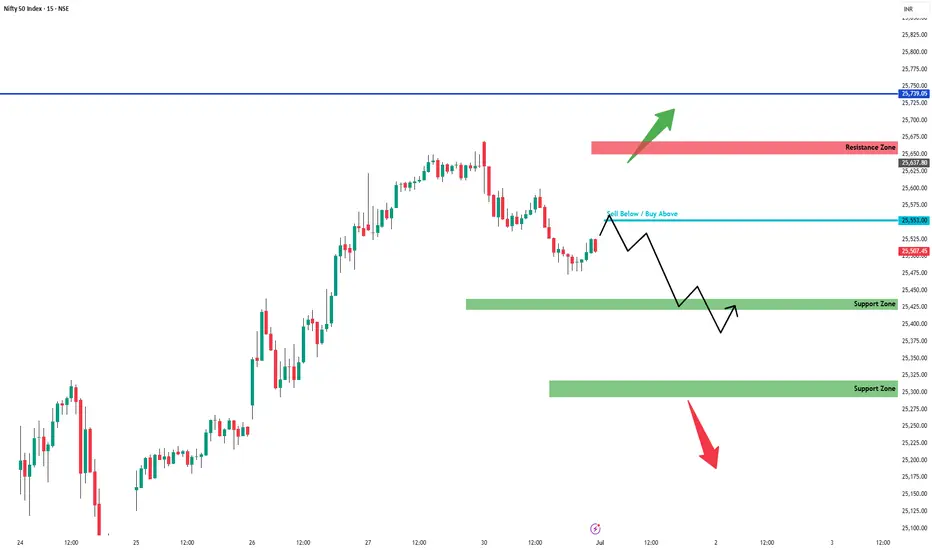
NIFTY : Trading levels and Plan for 30-JUN-2025
\ 📊 NIFTY 50 TRADING PLAN – 30-Jun-2025\
📍 \ Previous Close:\ 25,632
📏 \ Gap Opening Consideration:\ ±100 points
📈 \ Chart Timeframe:\ 15-min
🧩 \ Key Zones:\ Resistance – 25,690 / Support – 25,429 / Last Resistance – 25,838–25,880
---
\
\ \ 🚀 GAP-UP OPENING (Above 25,730):\
If NIFTY opens above \ 25,730\ , it will quickly enter the \ Last Intraday Resistance Zone (25,838 – 25,880)\ . This area is likely to act as a supply zone where profit booking may kick in. Traders should avoid aggressive longs near resistance unless a breakout is confirmed with strong momentum.
✅ \ Plan of Action:\
• Wait for price action to stabilize near 25,838
• Go long only if there's a breakout above 25,880 with strong volume
• Watch for bearish patterns like shooting stars or bearish engulfing near this zone
🎯 \ Trade Setup:\
– \ Buy above:\ 25,880
– \ Target:\ 26,000+
– \ SL:\ Below 25,730 or initial range low
📘 \ Tip:\ Avoid FOMO entries in first 15 minutes. Let the candle confirm breakout strength.
\ \ ⚖️ FLAT OPENING (Near 25,630 – 25,690):\
A flat opening near \ 25,632\ brings the market directly around the \ Opening Resistance of 25,690\ . This area could lead to sideways choppiness if there’s no directional conviction. Best strategy is to wait for a breakout or breakdown from this zone.
✅ \ Plan of Action:\
• Observe price behavior between 25,690 (resistance) and 25,512 (support)
• Go long if price breaks and sustains above 25,690 with strength
• Go short if breakdown below 25,512 is seen
🎯 \ Trade Setup Options:\
– \ Buy above:\ 25,690
– \ Sell below:\ 25,512
– \ Target:\ 25,838 or 25,429 depending on breakout/breakdown
– \ SL:\ Opposite zone or prior swing candle
📘 \ Tip:\ Wait for at least a 15-min candle close outside the range for confirmation.
\ \ 📉 GAP-DOWN OPENING (Below 25,512):\
If NIFTY opens below \ 25,512\ , it enters the \ Opening Support Zone for Gap-Down Cases\ . Immediate support lies at \ 25,429\ , which could act as a reversal point. However, if that breaks, NIFTY may fall towards \ 25,239\ .
✅ \ Plan of Action:\
• Watch for a bounce at 25,429 for possible reversal trades
• If price breaks below 25,429 and sustains, initiate short trades
• Look for bullish candles like hammers for reversal signals
🎯 \ Trade Setup:\
– \ Sell below:\ 25,429
– \ Target:\ 25,239
– \ SL:\ Above 25,512
📘 \ Tip:\ Avoid aggressive buying in early dip unless price holds and consolidates above support levels.
---
\ 🧭 KEY LEVELS TO WATCH:\
🔴 \ Opening Resistance:\ 25,690
🟥 \ Last Intraday Resistance:\ 25,838 – 25,880
🟩 \ Opening Support (Gap Down):\ 25,512
🟦 \ Last Intraday Support:\ 25,429
🟫 \ Major Support:\ 25,239
---
\ 💡 OPTIONS TRADING – RISK MANAGEMENT TIPS:\
✅ Trade near ATM options for quick deltas
✅ Don’t hold naked options if VIX is falling
✅ Always set stop-loss for option premiums
✅ Avoid averaging into losing trades
✅ For gap-ups, consider Bear Call Spreads
✅ For gap-downs, look into Bull Put Spreads
🛑 Never trade based on emotion; follow structure and levels only.
---
\ 📌 SUMMARY – ACTIONABLE ZONES:\
• ✅ \ Bullish above:\ 25,690 → Upside potential till 25,880+
• ⚠️ \ Choppy zone:\ 25,512 – 25,690 → Avoid forced trades
• ❌ \ Bearish below:\ 25,429 → Downside open till 25,239
🎯 \ Best Trades:\ Buy above 25,880 (momentum breakout), Sell below 25,429 (breakdown confirmation)
---
\ ⚠️ DISCLAIMER:\
I am not a SEBI-registered analyst. This analysis is shared for educational purposes only. Please do your own research or consult a registered financial advisor before taking trades. Always use strict stop-loss and risk management protocols.
NIFTY INTRADAY LEVELS ( EDUCATIONAL PURPOSE ) 30/06/2025🔷 Nifty Intraday Trade Plan – 30 June
📊 Analysis: 15-min TF | Execution: 1-min TF
🔹 GAP-UP Opening (Above 25,700)
📍 Plan: Avoid chasing longs. Wait for rejection or reversal
🔁 Entry: Sell on breakdown below 5-min low
🛑 SL: 15–20 pts above high
🎯 Target: 25,500–25,540
🔹 GAP-DOWN Opening (Below 25,500)
📍 Plan: Avoid panic selling. Look for reversal candle
🔁 Entry: Buy if price reclaims 5-min opening high
🛑 SL: 15–20 pts below swing low
🎯 Target: 25,650–25,700
🔹 NORMAL OPEN (Between 25,500–25,700)
🔁 Range Play Setup
📍 Sell near 25,680–700 (resistance zone)
📍 Buy near 25,500–520 (support zone)
🛑 SL: 15–20 pts beyond trigger level
🎯 Target: 30–40 pts
🔺 Breakout Trade Setup
🔁 Entry: Above 25,700 breakout candle
🛑 SL: Below breakout bar
🎯 Target: 25,760–780
🔻 Breakdown Trade Setup
🔁 Entry: Below 25,500 breakdown
🛑 SL: Above breakdown bar
🎯 Target: 25,440–420
💡 KEY INTRADAY TIPS
✔ Avoid overtrading in opening 5 min
✔ Focus on clean 1-min structure
✔ Size small until confirmation
✔ Follow strict SL & trail profits
NIFTY Intraday Trade Setup For 30 Jun 2025NIFTY Intraday Trade Setup For 30 Jun 2025
Bullish-Above 25685
Invalid-Below 25635
T- 25885
Bearish-Below 25520
Invalid- Above 25570
T- 25340
NIFTY has closed on a bullish note last week. It gave a range breakout which was valid for more than a month. It is at a striking distance to ATH which may be taken out in the coming weeks. 25500 is a strong intraday support zone. We have planned a sell below the same (25520), but consider only in the second attempt. In case of a pullback breakout above 25685 we will long for the target of 25685. 25685-25930 will be a resistance zone in intraday.
In case of a big gap up/down, wait till 10 o'clock and mark the high and low of the trading range (5MIN). Trade on this range breakout.
==========
I am Not SEBI Registered
This is my personal analysis for my personal trading. Kindly consult your financial advisor before taking any actions based on this.

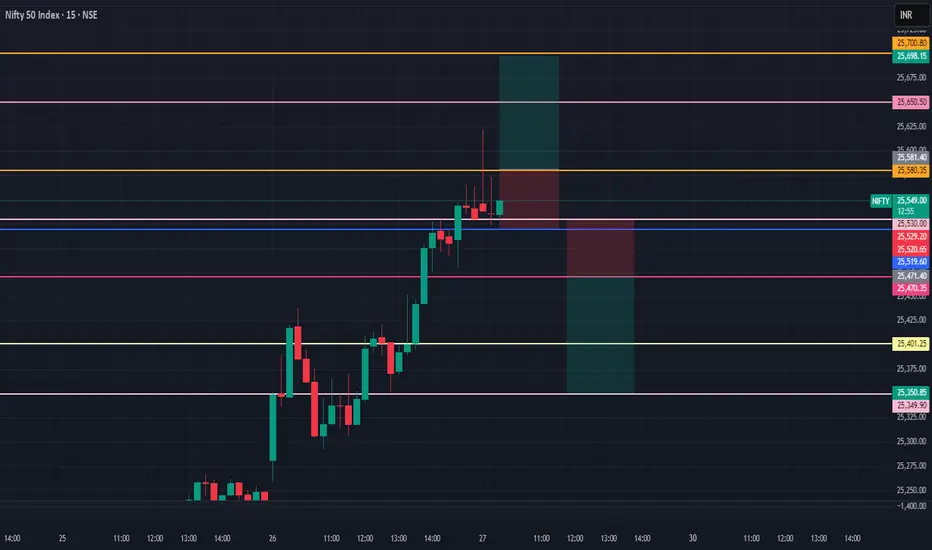
NIFTY LEVELS FOR INTRADAY ( EDUCATIONAL PURPOSE) 27/06/2025📊 Nifty Intraday Scalping Strategy – 27th June
📈 Chart Analysis: 15-min 📉 Execution: 1-min
🚀 Strong Momentum Above 25,550
🔼 If Gap-Up or Breakout Above 25,580:
✅ Buy above 25,580 on 1-min breakout
🎯 Target: 25,650 / 25,700
🛑 SL: 25,520
⚠️ Wait for retest if opening is volatile
📉 If Gap-Down Below 25,480:
✅ Sell below 25,470 on weakness
🎯 Target: 25,400 / 25,350
🛑 SL: 25,530
⚠️ No short if 25,450 holds with volume support
🔁 Sideways Note:
🔹 Don’t chase trades in first 5 mins
🔹 Use VWAP & 1-min candle structure for clean entries
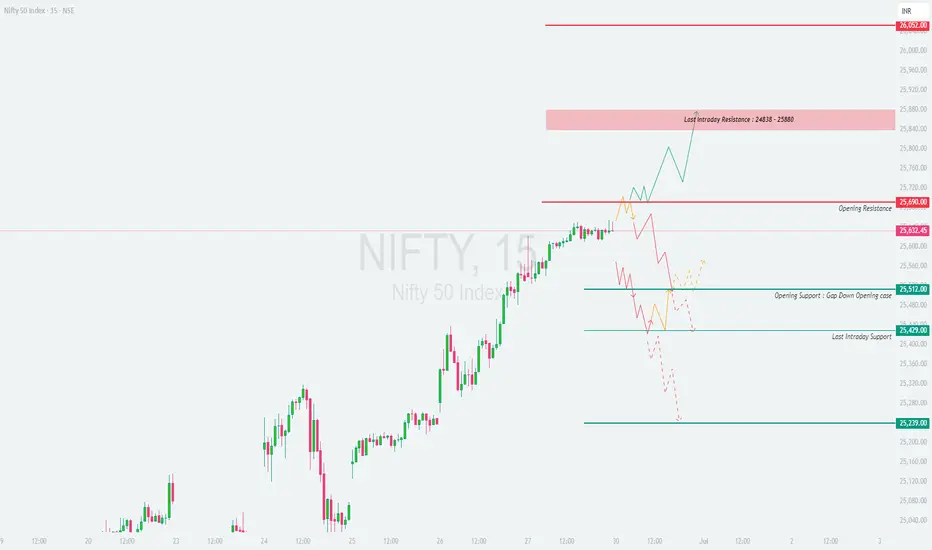
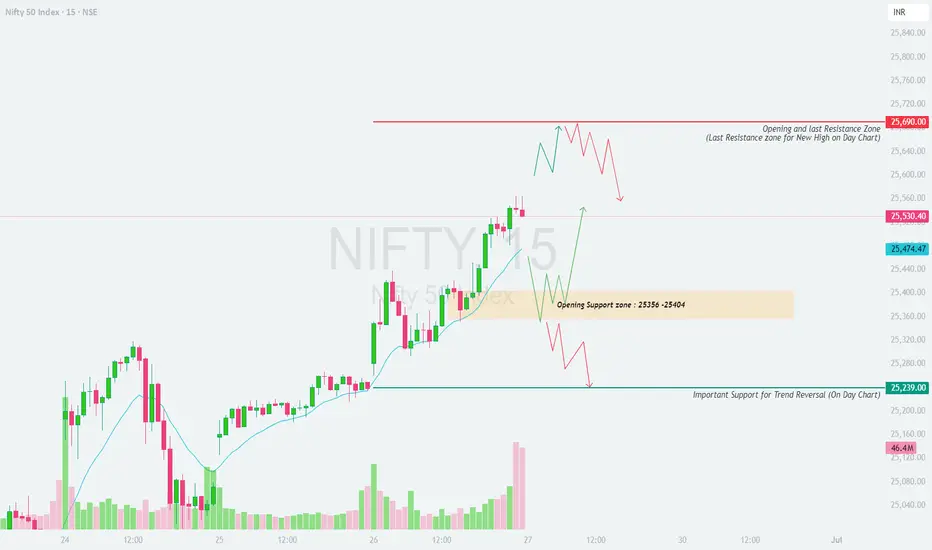
NIFTY : Trading levels and plan for 27-Jun-2025📊 NIFTY TRADING PLAN – 27-Jun-2025
📍 Previous Close: 25,530
📏 Gap Opening Reference: ±100 points
🕓 Chart Timeframe: 15-Min
🧠 Approach: Actionable plan based on reaction zones + trend-following confirmation
🚀 GAP-UP OPENING (Above 25,690):
A 100+ point gap-up above 25,690 takes Nifty straight into the Opening and Last Resistance Zone — a zone marked for possible exhaustion, where further upside needs strong momentum or risk of rejection increases.
✅ Plan of Action:
• Watch early 15-min candle — strength above 25,690 = bullish extension
• A rejection with long upper wick may signal reversal
• If breakout sustains → New intraday high potential
🎯 Trade Setup:
– Long above 25,690 (on candle close)
– Target: 25,800+
– SL: Below 25,650
– Avoid shorting aggressively unless clean rejection observed
📘 Tip: Always wait for a breakout retest before jumping into longs in such extended zones. Avoid chasing in the first 5 mins.
⚖️ FLAT OPENING (Between 25,530 – 25,474):
A flat open will place Nifty just below the upper resistance. Volatility may expand in either direction from here, so patience is key.
✅ Plan of Action:
• First 15–30 mins are crucial for market direction
• If Nifty crosses 25,690 → breakout trade setup
• If it fails and comes back below 25,474 → shorting opportunity toward support zone
🎯 Trade Setup Options:
– Long above 25,690 (with volume)
– Short below 25,474 (weakness confirmation)
– Targets: 25,690 (upside) | 25,404 (downside)
– SL: Based on 15-min close above/below key level
📘 Tip: This zone demands trader discipline — don’t be early in either direction. Let the chart structure develop.
📉 GAP-DOWN OPENING (Below 25,404):
Nifty opening below 25,404 shifts the focus to the Opening Support Zone (25,404–25,356) and if broken, to the Major Support for Trend Reversal (25,239) . This creates a clean downside structure if sellers take control.
✅ Plan of Action:
• If Nifty holds within 25,356–25,404 zone and shows reversal signs → possible bounce
• Breakdown below 25,239 → could trigger trend reversal toward deeper supports
🎯 Trade Setup:
– Short below 25,356 with confirmation
– Target: 25,239 → 25,100
– Long only if bullish structure holds within support zone
– SL: Above 25,404 (for shorts)
📘 Tip: Avoid averaging down. If price bounces near 25,239, wait for reversal signal to confirm buyer interest.
📌 KEY ZONES TO TRACK:
🔴 Resistance Zone: 25,690 (Last Resistance — potential exhaustion)
🟧 Opening Support Zone: 25,404 – 25,356
🟩 Trend Reversal Support: 25,239
💡 OPTIONS TRADING & RISK MANAGEMENT TIPS:
✅ Use Vertical Spreads (Bull Call / Bear Put) in directional setups to reduce premium risk
✅ Avoid trading in overlapping zones unless a clear breakout occurs
✅ Don’t hold naked options near expiry without clear trend — use spreads
✅ Protect your capital : Never risk more than 1.5–2% of total capital per trade
✅ SL must always be respected based on candle close
✅ Keep tracking OI shifts and IV spikes — adjust strikes if momentum fades
🔍 SUMMARY:
• 🔼 Bullish Above: 25,690 → Scope for new high
• ⚠️ Flat Opening Zone: 25,530 – 25,474 → Wait and watch
• 🔽 Bearish Below: 25,404 → Breakdown may extend
• 🛑 Trend Shift Point: 25,239 — strong support, if breached = caution
⚠️ DISCLAIMER:
I am not a SEBI-registered advisor. This plan is purely for educational purposes. Please consult your financial advisor before acting on any trade ideas. Always use proper position sizing, stop-loss, and risk controls to protect your capital.
Nifty - Intraday levels & Prediction for - 27 Jun 2025Nifty Prediction for Tomorrow:
Trend : Sideways to Moderately BULLISH
Sentiment : Positive
Expectation : Nifty will fill 25640 - 25740 Gap tomorrow after some consolidation.
Look for Buy/Sell at Demand and Supply zone for profitable trades.
Demand and Supply Zones - When price breaks the zone, Demand zone will become Resistance and Supply zone will become Support. If Nifty Sustains above 24900 tomorrow we can see good rally upto 25080 Resistance. Any breakout above 25100 and next resistance 25200
Refer the chart for detailed Intraday Support and Resistance levels.
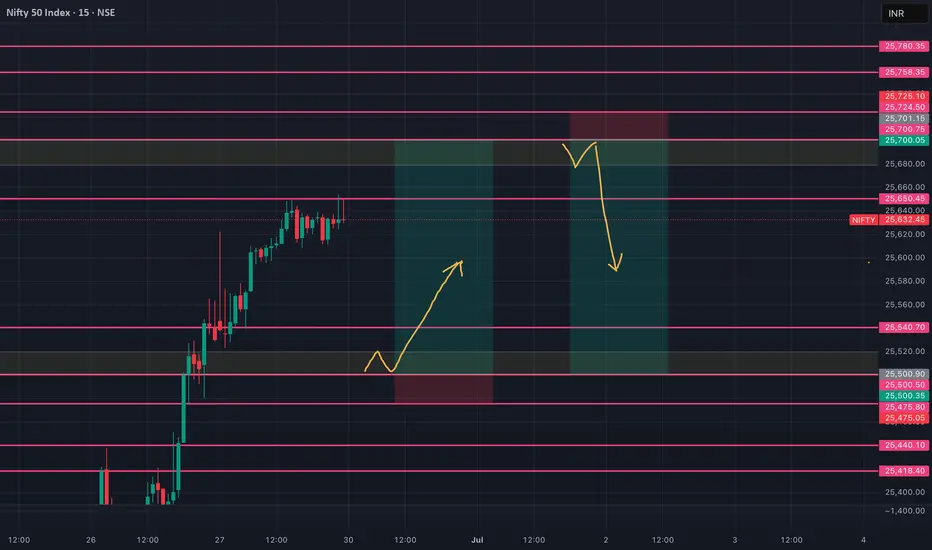
View On NiftyCERC pattern
Contraction
Expansion
Retracement
Continuation
My view: Markets would touch 25800 and come back to 24800. Enter a range again, and gradually move up to 25500 and above.
Let me know what you think.

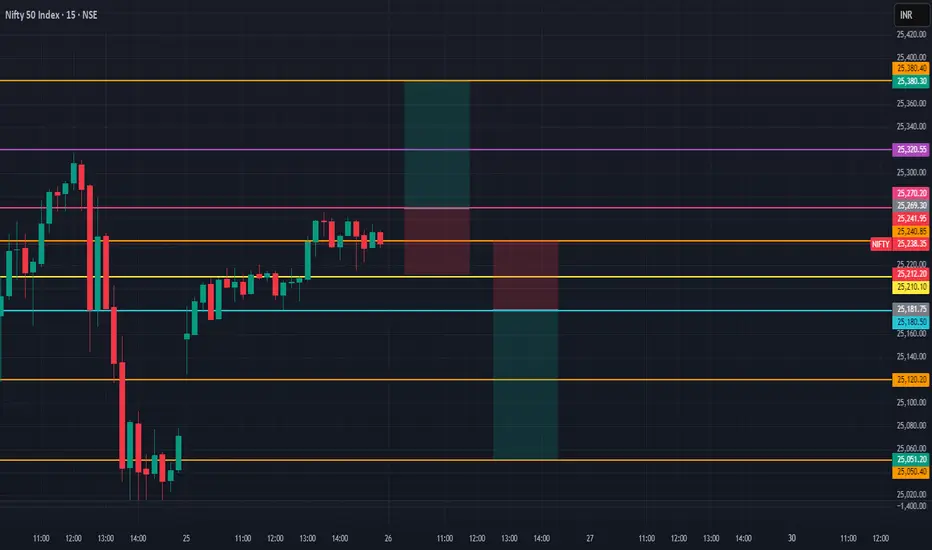
NIFTY Levels For Intraday (Educational Purpose) 29/06/2025📊 Nifty Intraday Plan (for 1-Min Chart Traders) – 26th June
🟢 Gap-Up Opening Strategy
✅ Buy above: 25,270
🎯 Targets: 25,320 / 25,380
🛑 SL: 25,210
⚠️ Avoid entry if no strong volume or if price gets rejected near 25,300.
🔴 Gap-Down Opening Strategy
✅ Sell below: 25,180
🎯 Targets: 25,120 / 25,050
🛑 SL: 25,240
⚠️ Avoid selling if Nifty holds above 25,200 after 15 mins.
📍 Use 1-min chart with candle + volume confirmation.