Nifty: Sellers were heavy today. Volatality rising Yesterday we analyzed that NSE:NIFTY would turn bullish only if it opened above the pivot. Since it couldn’t, the index stayed bearish.
Support was at 25200, but the index couldn’t close above it.
So the calculation from here is simple:
1. If 25150 breaks, the index can drop to 25025.
2. If 25225 is crossed and sustained, then the move can extend up to 25400.
The one big negative today is that sellers’ volume was 50 million higher than buyers. For an index options trader, this is the most important piece of data.
That’s why my strategy for tomorrow will be Sell-on-Rise. I’ll short if the index gets rejected from resistance.
As for the equity segment, I’m noticing that relative strength is falling in many stocks on my watchlist. So I won’t be opening any fresh positions for now.
Industries with the highest turnover right now are Auto Parts and Pharma – intraday opportunities can be looked for in these tomorrow.
---
📊 Levels at a glance:
Support 1: 25150
Support 2: 25025
Resistance 1: 25225 (sustaining above = bullish)
Resistance 2: 25400 (upside target)
Bias: Sell-on-Rise, cautious bullish only above 25225
Sectors to watch: Auto Parts, NSE:CNXPHARMA
Niftytradesetup

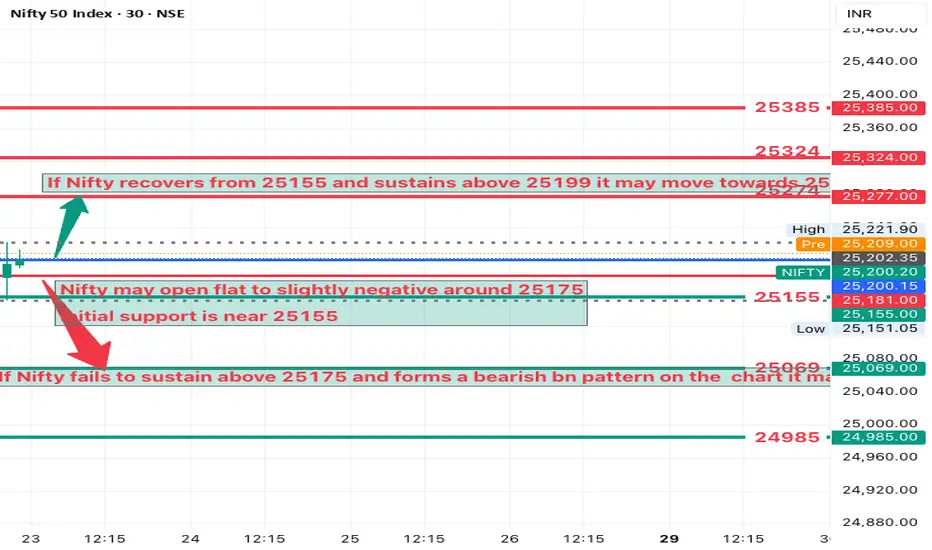
NIFTY Analysis 23 SEPTEMBER, 2025 ,Daily Morning update at 9 amSupport 25155 25069 24985
Resistance 25274 25324 25385
If Nifty holds 25155 and moves above 25199, consider buying
Target: 25274
Stop loss: just below 25155
If Nifty fails to sustain above 25175 and forms a BN pattern on chart, consider selling
Target 25103 then 25065
Stop loss just above 25175
Trade only near support and resistance levels
Watch price action on 5-minute and 15minute charts
gift for you. If Nifty holds above 25199 Buy Calls
If Nifty breaks below 25175 Buy Puts
If Nifty stays between 25155–25199 Avoid or Sell Options with hedging
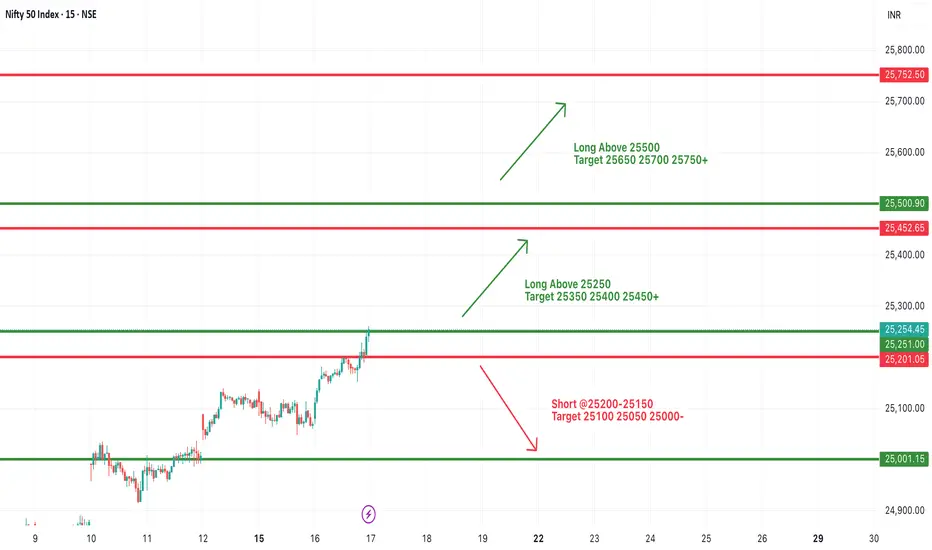
#NIFTY Intraday Support and Resistance Levels - 23/09/2025For Nifty, a flat opening is expected near the 25,200 zone. On the upside, sustaining above 25,250–25,300 can trigger a bullish move toward 25,350, 25,400, and 25,450+. A breakout above 25,500 will further strengthen the trend, opening the path toward 25,650–25,750+.
On the downside, immediate support lies at 25,200–25,150. A break below this may invite selling pressure, dragging the index toward 25,100, 25,050, and 25,000-. If weakness extends further, strong support exists around 24,950–25,000.
Overall, Nifty is trading at a crucial support zone. A decisive move on either side will dictate intraday direction, so traders should wait for confirmation and manage trades with strict stop-losses.
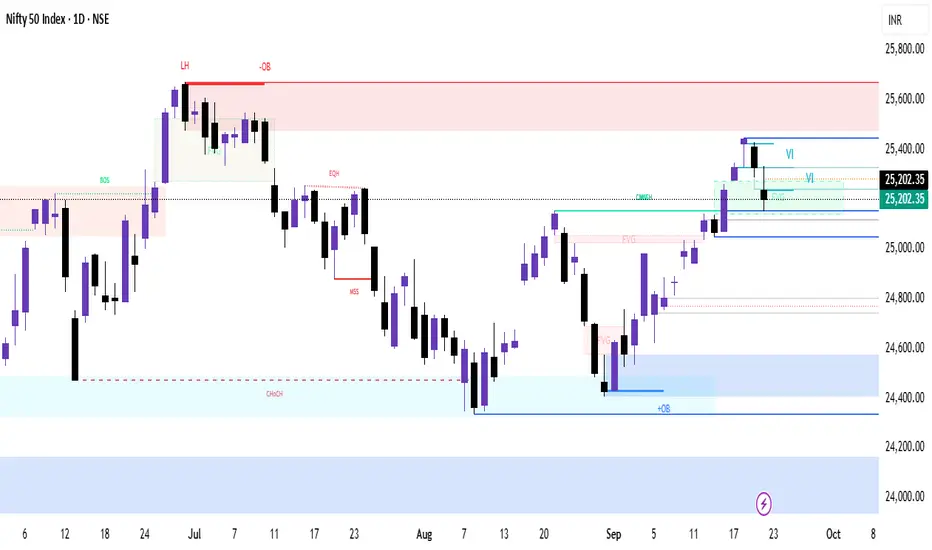
Nifty Technical Analysis – 23 September 2025🕒 1-Day Chart
Support Levels:
25,200: Immediate support; bulls need to defend this level.
25,050: Critical support; a break below this could lead to further downside.
Resistance Levels:
25,300: Immediate resistance; a breakout above this could lead to a rally.
25,450–25,500: Key resistance zone; bulls need to reclaim this for a bullish trend.
Technical Indicators:
RSI is below 60, indicating weakening momentum.
MACD shows a bearish crossover, suggesting potential downside.
Market Sentiment:
The index formed a bearish candle with a long upper shadow, indicating selling pressure at higher levels.
The index is trading below the 10-day EMA, suggesting a short-term downtrend.
🕓 4-Hour Chart
Support Levels:
25,150: Immediate support; a break below this could lead to further downside.
25,000: Strong support; bulls need to defend this level.
Resistance Levels:
25,300: Immediate resistance; a breakout above this could lead to a rally.
25,450: Key resistance; bulls need to reclaim this for a bullish trend.
Technical Indicators:
RSI is below 60, indicating weakening momentum.
MACD shows a bearish crossover, suggesting potential downside.
Market Sentiment:
The index is trading below the 10-period EMA, suggesting a short-term downtrend.
🕐 1-Hour Chart
Support Levels:
25,150: Immediate support; a break below this could lead to further downside.
25,000: Strong support; bulls need to defend this level.
Resistance Levels:
25,250: Immediate resistance; a breakout above this could lead to a rally.
25,400: Key resistance; bulls need to reclaim this for a bullish trend.
Technical Indicators:
RSI is below 60, indicating weakening momentum.
MACD shows a bearish crossover, suggesting potential downside.
Market Sentiment:
The index is trading below the 10-period EMA, suggesting a short-term downtrend.
🕒 15-Minute Chart
Support Levels:
25,150: Immediate support; a break below this could lead to further downside.
25,000: Strong support; bulls need to defend this level.
Resistance Levels:
25,250: Immediate resistance; a breakout above this could lead to a rally.
25,400: Key resistance; bulls need to reclaim this for a bullish trend.
Technical Indicators:
RSI is below 60, indicating weakening momentum.
MACD shows a bearish crossover, suggesting potential downside.
Market Sentiment:
The index is trading below the 10-period EMA, suggesting a short-term downtrend.
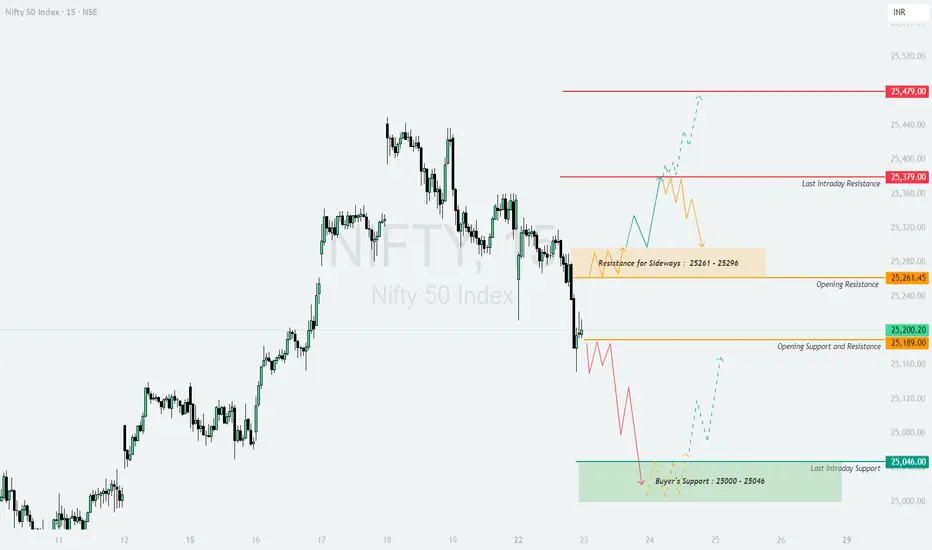
NIFTY : Trading levels and plan for 23-Sep-2025NIFTY TRADING PLAN – 23-Sep-2025
Nifty closed near 25,200, holding around the critical zone of 25,189–25,200, with multiple resistances above and strong support below.
Opening Resistance: 25,261
Sideways Resistance Zone: 25,261–25,296
Last Intraday Resistance: 25,379
Major Resistance: 25,479
Opening Support: 25,189
Last Intraday Support (Buyers’ Zone): 25,000–25,046
With a gap opening threshold of 100+ points, let’s look at the trading scenarios in detail:
🚀 Gap Up Opening (100+ points above previous close)
If Nifty opens near or above 25,300–25,320, it will enter a test zone of 25,261–25,296.
A sustained breakout above 25,296 may invite momentum buying towards 25,379, and a further extension can take it towards 25,479.
If Nifty fails to sustain above 25,296, then a pullback towards 25,261–25,200 can occur. This retracement may offer intraday shorting opportunities.
👉 Traders should avoid chasing the initial spike. Waiting for 15–30 minutes for confirmation will help avoid false breakouts.
⚖️ Flat Opening (near 25,180–25,220 zone)
In case of a flat start, the immediate play will be between 25,189 (support) and 25,261 (resistance).
A decisive move above 25,261 can attract bullish momentum towards 25,296–25,379.
Conversely, slipping below 25,189 may drag Nifty back towards 25,046, which is a critical buyer’s zone.
👉 This is the best scenario for breakout traders, as both sides provide clear risk-reward setups depending on the direction chosen by the market.
📉 Gap Down Opening (100+ points below previous close)
If Nifty opens near or below 25,100, immediate pressure will shift focus to the 25,000–25,046 buyer’s support zone.
A quick bounce from this zone can trigger a recovery rally back towards 25,189–25,261.
However, if Nifty breaks below 25,000 and sustains, it will trigger strong bearish momentum, possibly extending the fall towards 24,950–24,880 levels.
👉 In this setup, option traders can look for put buying opportunities but must keep stop-losses tight, as volatility will be high around psychological levels like 25,000.
🛡️ Risk Management & Option Trading Tips
Always allow the first 15–30 minutes for market direction to settle before taking trades.
Trade near support/resistance zones; avoid entries in the middle range.
Follow hourly candle closing for breakout confirmations.
Keep a 1:2 minimum risk-reward ratio to filter low-quality trades.
In options trading, avoid over-leveraging as premiums decay quickly on sideways days.
Respect levels like 25,000, which act as strong psychological supports/resistances.
📌 Summary & Conclusion
Above 25,296, bullish momentum may extend towards 25,379–25,479 🚀.
Flat openings will revolve around 25,189–25,261 levels, offering breakout trades ⚖️.
Below 25,000, deeper bearish pressure may emerge, targeting 24,950–24,880 📉.
Discipline, patience, and waiting for price confirmation at key levels will be crucial for success.
⚠️ Disclaimer
I am not a SEBI-registered analyst. This analysis is only for educational purposes. Please do your own research or consult a financial advisor before making any trading decisions.
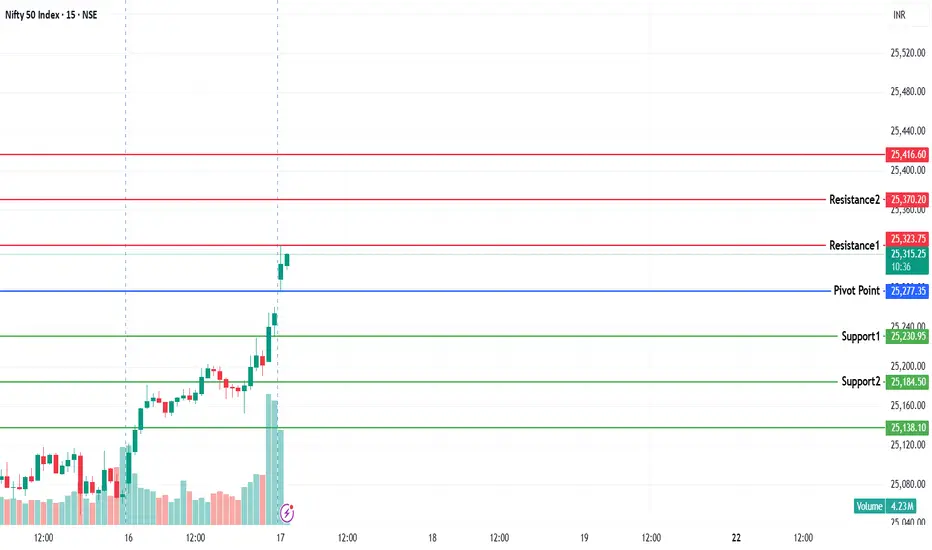
Bulls seen in today's selling candle in Nifty So, NSE:NIFTY touched the final support we mentioned at 25150 and bounced back. We discussed that the dip will get bought, and that’s exactly what happened.
Now even though today's candle is red, buyers’ volume is 12 million higher than sellers. That confirms the buying is coming in.
Now, if Nifty opens above the Pivot, which is at 25228, it could turn into a bullish day since PP is at 0.10%.
The retail index is down but market breadth remains strong, so tomorrow could be a sideways day with a bullish tone intact.
Support for tomorrow will be at 25200 and resistance at 25250.
The key resistance is 25330. If that breaks, we may see sharp short covering in the coming days. That level will be the main focus if you’re trading index options.
Stocks from Auto Components and Construction industries will be on my radar tomorrow for intraday trades.
I traded NSE:MMTC , NSE:STALLION and NSE:TRAVELFOOD today. All gave really good blast.
📊 Levels at a glance:
Pivot: 25228
Support: 25200
Resistance 1: 25250
Resistance 2: 25330 (major breakout level, short covering zone)
Pivot Percentile: 0.10% (supports bullish tone)
Bias: Sideways with bullish undertone
Sectors to watch: Auto Components, Construction
That’s all for the day. Take care. Have a profitable tomorrow.

Nifty to target 25050 this weekNext target for nifty is 25050
I will look for a rejection sign from this highlighted area marked supply zone. I will look for mss or below 9ema downside closed candle for short entry.

Nifty weekly expiry analysis for 23/09/2025.Nifty has created 3 consecutive red candle on the daily charts and might touch its 20 EMA.
Market is around the All time high levels and chances of profit booking are there.
Today, nifty has closed 125 points lower than the pervious close.
Major Resistance levels :- 25311, 25438
Support levels :- 25094, 25010
On the hourly charts, the market seems to be taking rejection from the hourly 20 ema and it trading between 20 and 50 EMA.
It is trading in a close parallel channel range. If it remains in the range avoid trading or scalp as per the risk appetite.
Though nifty has taking down the 50 EMA and there are chance of it tested the higher moving averages soon.
Tomorrow is nifty weekly expiry. Wait and watch for the price action near the price levels before entering a trade.

NIFTY KEY LEVELS FOR 22.09.2025NIFTY KEY LEVELS FOR 22.09.2025
RTF: 3 Minutes
If the candle stays above the pivot point, it is considered a bullish bias; if it remains below, it indicates a bearish bias. Price may reverse near Resistance 1 or Support 1. If it moves further, the next potential reversal zone is near Resistance 2 or Support 2. If these levels are also broken, we can expect the trend.
When a support or resistance level is broken, it often reverses its role; a broken resistance becomes the new support, and a broken support becomes the new resistance.
If the range(R2-S2) is narrow, the market may become volatile or trend strongly. If the range is wide, the market is more likely to remain sideways
please like and share my idea if you find it helpful
📢 Disclaimer
I am not a SEBI-registered financial adviser.
The information, views, and ideas shared here are purely for educational and informational purposes only. They are not intended as investment advice or a recommendation to buy, sell, or hold any financial instruments.
Please consult with your SEBI-registered financial advisor before making any trading or investment decisions.
Trading and investing in the stock market involves risk, and you should do your own research and analysis. You are solely responsible for any decisions made based on this research.

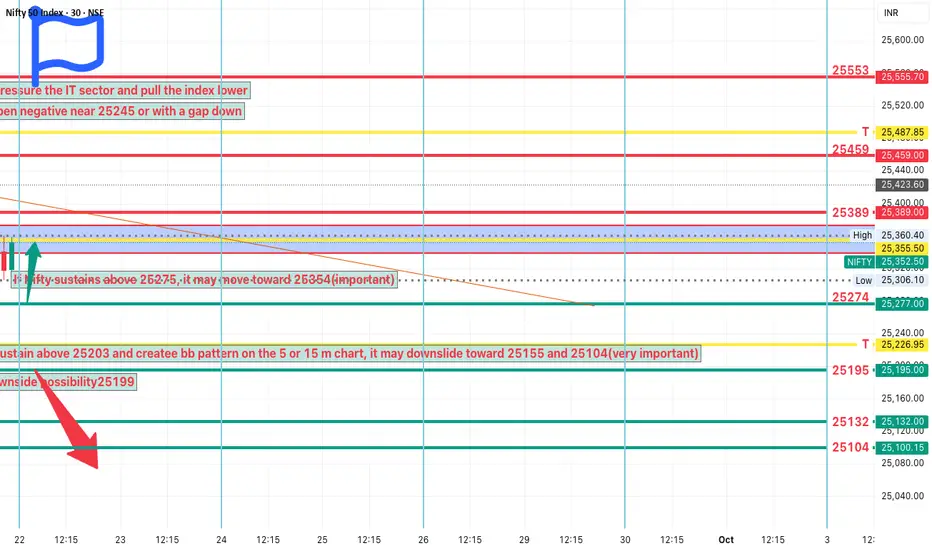
NIFTY Analysis 22 SEPTEMBER, 2025 ,Daily Morning update at 9 amREAD CAREFULLY EVERY WORD
intraday Bearish Setup
If Nifty opens near 25245 and trades below 25203, watch for downside targets at 25155 and 25104.
IT sector weakness can add pressure
Intraday Bullish Setup
If Nifty reclaims and sustains above 25275, upside targets are 25354 and 25389
Sustaining above 25389 may open the next level at 25459
Neutral Zone
Between 25203 and 25275, market may remain choppy and can trap both sides.
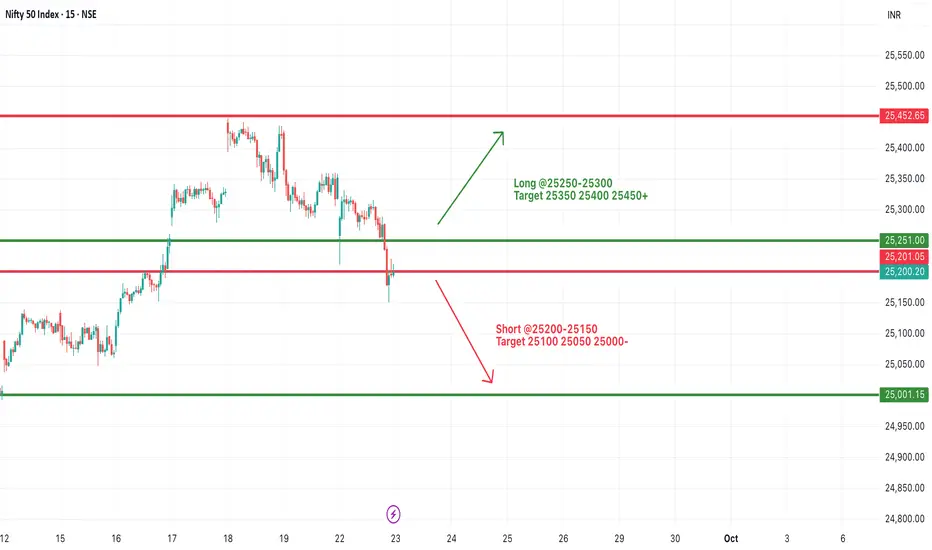
#NIFTY Intraday Support and Resistance Levels - 22/09/2025Nifty, a slightly gap-down opening is expected near the 25,300–25,350 zone. On the upside, sustaining above 25,250–25,300 can fuel bullish momentum toward 25,350, 25,400, and 25,450+. A breakout above 25,500 will strengthen the uptrend, paving the way for higher levels around 25,650–25,750+.
On the downside, immediate support lies at 25,200–25,150. A breakdown below this zone may invite selling pressure, dragging the index lower toward 25,100, 25,050, and 25,000-. Strong support is placed around 25,000, and a decisive break below that could extend weakness further.
Overall, Nifty is showing range-bound action with a slight bearish bias in early trade, but a sustained move above 25,300 will keep the bullish momentum intact. Traders should wait for confirmation at key levels and manage positions with strict stop-losses.

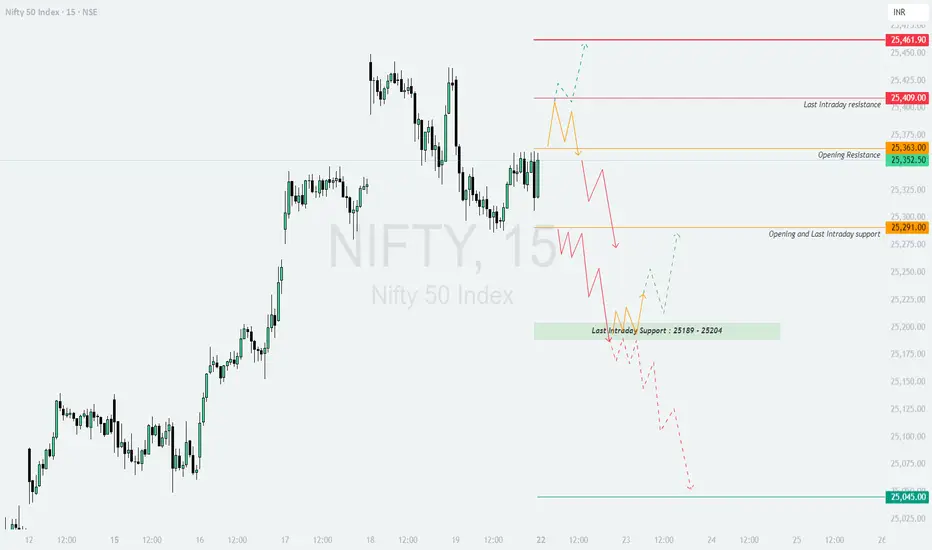
NIFTY : Trading levels and Plan for 22-Sep-2025NIFTY TRADING PLAN – 22-Sep-2025
The index closed around 25,352, with immediate opening resistance at 25,363, and higher hurdles near 25,409 (last intraday resistance) and 25,461. On the downside, supports are placed at 25,291 (opening/last intraday support) and the 25,189–25,204 zone. The critical lower support is seen at 25,045.
Considering a gap opening threshold of 100+ points, let’s break down the intraday scenarios:
🚀 Gap Up Opening (100+ points above previous close)
If Nifty opens strongly above 25,450–25,461, it will enter a bullish zone.
Sustaining above 25,461 can fuel momentum towards 25,525–25,600. Option traders can look for call buying opportunities with strict stop-losses.
However, if rejection candles appear near 25,461, profit booking may drag Nifty back towards 25,409–25,363. This would offer a counter-trade opportunity for cautious intraday shorting.
Risk control is essential here: wait for 15–30 minutes confirmation after gap-ups to avoid false breakouts.
⚖️ Flat Opening (near 25,300–25,350 zone)
If Nifty opens flat, then 25,363 (resistance) and 25,291 (support) become immediate reference points.
A decisive breakout above 25,363 can push prices towards 25,409 and further to 25,461. Sustaining beyond this level confirms bullish continuation.
On the other hand, if Nifty fails to cross 25,363 and slips below 25,291, then weakness may extend towards 25,189–25,204 zone.
This setup is best suited for breakout traders who can wait for price confirmation before entering directional trades.
📉 Gap Down Opening (100+ points below previous close)
If Nifty opens sharply below 25,200, it will test the last intraday support zone of 25,189–25,204.
A bounce from this zone can trigger a quick pullback rally towards 25,291–25,363.
But if the index sustains below 25,189, then deeper downside towards 25,045 becomes highly probable. In such a case, put options could provide high reward trades, but strict stop-loss is a must since sharp pullbacks often occur at key supports.
🛡️ Risk Management & Option Trading Tips
Always allow the first 15–30 minutes to set direction before entering.
Use hourly candle close as confirmation for breakout trades.
In gap scenarios, avoid aggressive chasing; instead, wait for retests of key levels.
Maintain at least a 1:2 risk-reward ratio for consistency.
Limit position sizing in options as premiums erode quickly due to time decay.
📌 Summary & Conclusion
Above 25,461, Nifty may head towards 25,525–25,600 🚀.
Flat openings will keep focus on 25,363 (resistance) and 25,291 (support) ⚖️.
Below 25,189, bearish momentum may extend towards 25,045 📉.
Patience and disciplined execution around these levels can provide the best trading opportunities.
⚠️ Disclaimer
I am not a SEBI-registered analyst. This analysis is purely for educational purposes. Please consult with your financial advisor before making any trading decisions.
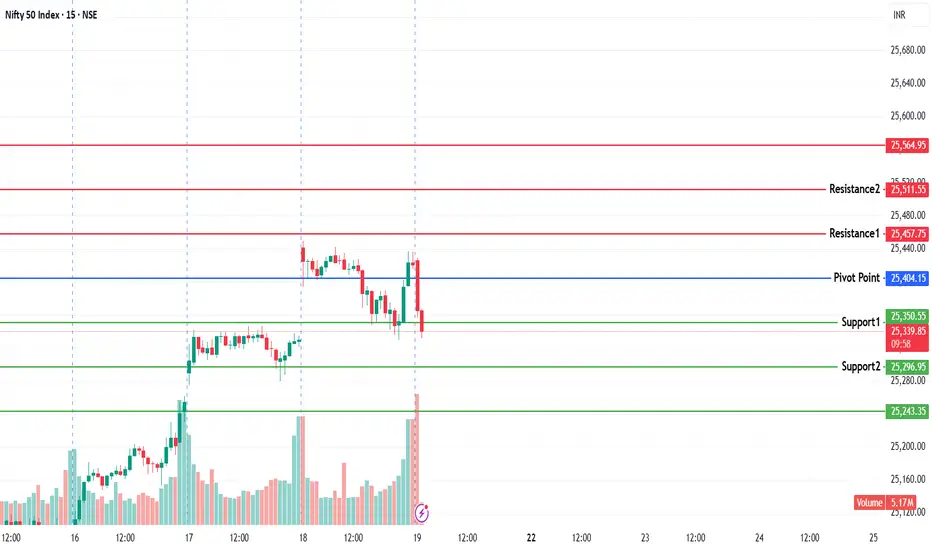
NIFTY KEY LEVELS FOR 19.09.2025NIFTY KEY LEVELS FOR 19.09.2025
RTF: 3 Minutes
If the candle stays above the pivot point, it is considered a bullish bias; if it remains below, it indicates a bearish bias. Price may reverse near Resistance 1 or Support 1. If it moves further, the next potential reversal zone is near Resistance 2 or Support 2. If these levels are also broken, we can expect the trend.
When a support or resistance level is broken, it often reverses its role; a broken resistance becomes the new support, and a broken support becomes the new resistance.
If the range(R2-S2) is narrow, the market may become volatile or trend strongly. If the range is wide, the market is more likely to remain sideways
please like and share my idea if you find it helpful
📢 Disclaimer
I am not a SEBI-registered financial adviser.
The information, views, and ideas shared here are purely for educational and informational purposes only. They are not intended as investment advice or a recommendation to buy, sell, or hold any financial instruments.
Please consult with your SEBI-registered financial advisor before making any trading or investment decisions.
Trading and investing in the stock market involves risk, and you should do your own research and analysis. You are solely responsible for any decisions made based on this research.
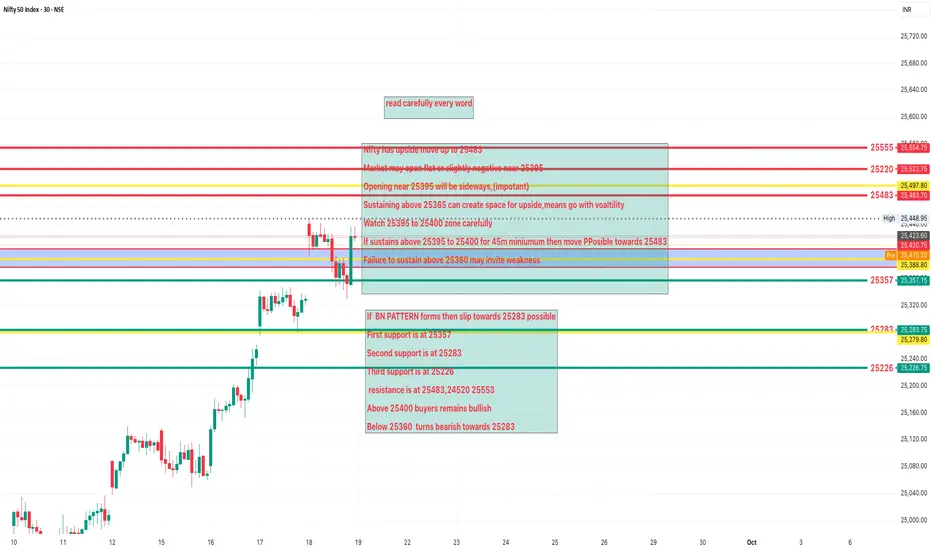
NIFTY Analysis 19 SEPTEMBER, 2025 ,Daily Morning update at 9 amTodays lavels based on 45 minut time frame of 1 month
Nifty has upside move show up to 25483
Market may open flat or slightly negative near 25395
Opening near 25395 will be sideways,(impotant)
Sustaining above 25365 can create space for upside,means go with voaltility
Watch 25395 to 25400 zone carefully
If sustains above 25395 to 25400 for 45m miniumum then move PPosible towards 25483
Failure to sustain above 25360 may invite weakness
If BN PATTERN forms then slip towards 25283 possible
First support is at 25357
Second support is at 25283
Third support is at 25226
resistance is at 25483,24520 25553
Above 25400 buyers remains bullish
Below 25360 turns bearish towards 25283
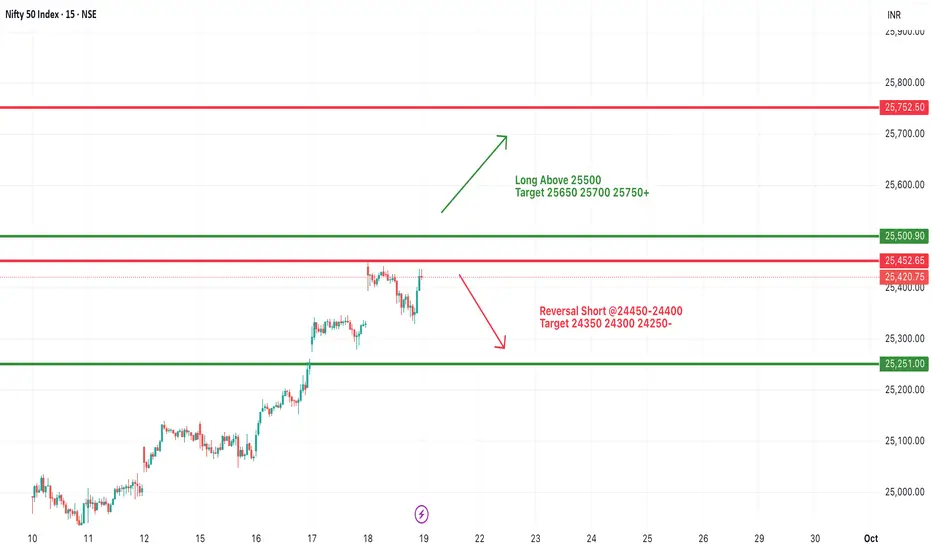
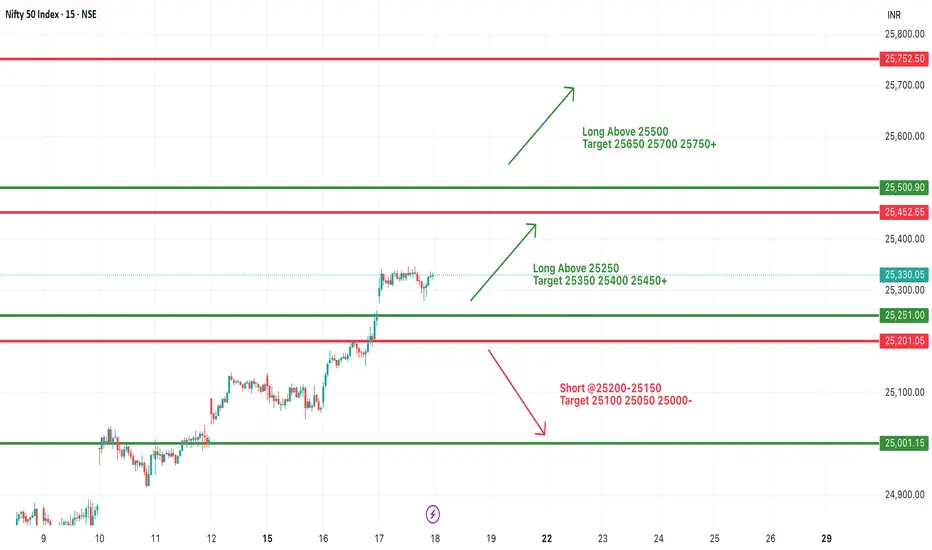
#NIFTY Intraday Support and Resistance Levels - 19/09/2025For Nifty, the index is expected to open flat near the 25,420–25,450 zone. On the upside, sustaining above 25,250 and crossing 25,500 decisively will be crucial. A move above 25,500 can trigger strong bullish momentum, with targets placed at 25,650, 25,700, and 25,750+.
On the downside, the immediate support is seen around 25,250. A break below this may invite selling pressure, pulling the index lower toward 25,100, 25,000, and 24,950-. Additionally, if a reversal occurs from the 25,450–25,500 zone, then a short trade opportunity may open with targets at 24,350, 24,300, and 24,250-.
Overall, Nifty is likely to remain in a range-bound setup with a flat opening. A decisive breakout above 25,500 or a breakdown below 25,250 will dictate the next directional move. Traders should stay cautious near resistance zones and trail positions with strict stop-losses.
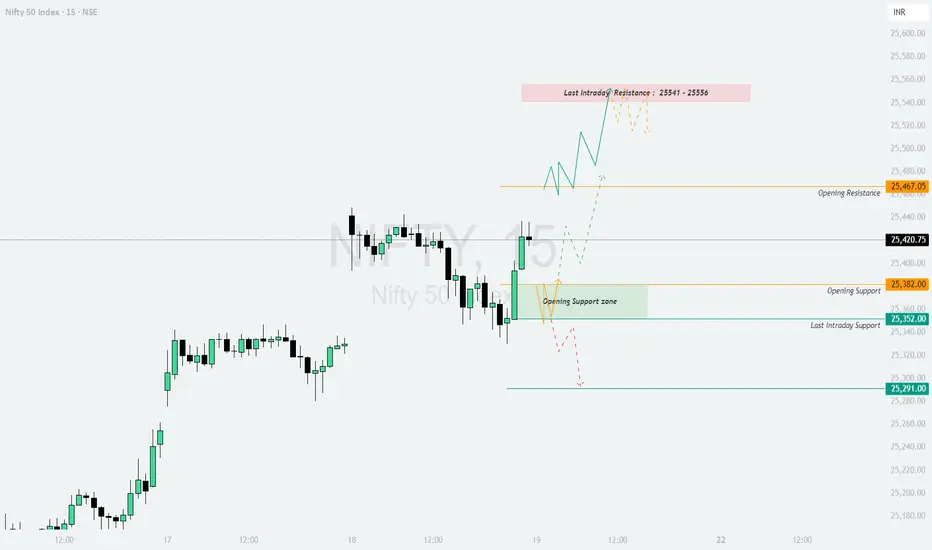
NIFTY : Trading levels and Plan for 19-Sep-2025NIFTY TRADING PLAN – 19-Sep-2025
📌 Key Levels from the Chart:
Opening Resistance: 25,467
Last Intraday Resistance: 25,541 – 25,556
Opening Support: 25,382
Last Intraday Support: 25,352
Major Support Zone: 25,291
🚀 Gap-Up Opening (100+ points above previous close)
If Nifty opens above 25,520–25,540, it directly enters the Last Intraday Resistance Zone (25,541–25,556) . This zone will be a key battleground for bulls and bears. Sustaining above this resistance could open the path towards 25,600+ levels.
📌 Trading Approach:
Look for long entries only if price sustains above 25,556, targeting 25,600–25,650.
Keep a strict stop-loss below 25,467 (Opening Resistance).
If rejection occurs near resistance, a pullback towards 25,467–25,420 is possible. In that case, option traders can shift to short-term put buying.
📉 Flat Opening (within ±100 points of 25,420)
A flat opening near the previous close would keep Nifty between Opening Resistance (25,467) and Opening Support (25,382). This means consolidation and indecision in the early session.
📌 Trading Approach:
Avoid rushing into trades in the first 30 minutes. Let the market choose direction.
If the index breaks above 25,467 with volume, ride the trend towards 25,541–25,556.
If it fails and slips below 25,382, expect a dip towards 25,352 and possibly 25,291.
🔻 Gap-Down Opening (100+ points below previous close)
If Nifty opens below 25,320–25,300, it enters a weak territory, testing Last Intraday Support (25,352) and moving towards 25,291.
📌 Trading Approach:
If support at 25,291 holds, a bounce back towards 25,352–25,382 is likely, providing a short-term buying opportunity.
If 25,291 breaks decisively, further downside towards 25,200–25,150 cannot be ruled out. In this case, short positions with strict SL above 25,352 are safer.
🛡️ Risk Management Tips for Options Traders
Avoid aggressive buying in resistance zones; wait for confirmation candles.
Use spreads (Bull Call / Bear Put) instead of naked options in volatile markets.
Risk per trade should not exceed 2% of capital.
Trail stop-loss once trade moves in your favor.
Exit part positions at first target; let the rest ride with stop-loss shifted to cost.
📌 Summary & Conclusion
Above 25,556, momentum may stretch towards 25,600–25,650.
A flat opening requires patience; breakout above 25,467 or breakdown below 25,382 will give direction.
Below 25,291, weakness can intensify towards 25,200.
Stay disciplined, respect levels, and follow strict risk management to protect capital.
⚠️ Disclaimer
I am not a SEBI registered analyst . This trading plan is prepared purely for educational purposes. Please do your own research or consult a financial advisor before trading.
NIFTY KEY LEVELS FOR 18.09.2025NIFTY KEY LEVELS FOR 18.09.2025
Sorry for the delayed post.
RTF: 3 Minutes
If the candle stays above the pivot point, it is considered a bullish bias; if it remains below, it indicates a bearish bias. Price may reverse near Resistance 1 or Support 1. If it moves further, the next potential reversal zone is near Resistance 2 or Support 2. If these levels are also broken, we can expect the trend.
If the range(R2-S2) is narrow, the market may become volatile or trend strongly. If the range is wide, the market is more likely to remain sideways
please like and share my idea if you find it helpful
📢 Disclaimer
I am not a SEBI-registered financial adviser.
The information, views, and ideas shared here are purely for educational and informational purposes only. They are not intended as investment advice or a recommendation to buy, sell, or hold any financial instruments.
Please consult with your SEBI-registered financial advisor before making any trading or investment decisions.
Trading and investing in the stock market involves risk, and you should do your own research and analysis. You are solely responsible for any decisions made based on this research.

NIFTY Analysis 17 SEPTEMBER, 2025 ,Daily Morning update at 9 am0pening near 25395
Market may open sideways
Sideways move helps to sustain
Watch 25395 level for 1 hour
Sustaining above 25395 is bullish
Above 25395 target 25457
Failure to sustain above 25333 is bearish
Bearish bottleneck pattern may form in 5 min chart
If bearishbn pattern form then downside expected
Downside target is 25263
First support level is 25263
Second support level is 25177
Third support level is 25073
First resistance level is 25395
Next resistance levels are 25457 and 25510

#NIFTY Intraday Support and Resistance Levels - 18/09/2025For Nifty, the index is expected to open on a strong note near the 25,450 level, indicating a clear gap-up start. A sustained move above the key zone of 25,250 will keep the momentum positive and may drive the index higher toward 25,350, 25,400, and 25,450+. If it manages to cross and hold above the 25,500 mark, further upside extensions toward 25,650–25,750+ are likely, strengthening the bullish sentiment.
On the downside, immediate support is placed around 25,200–25,150. A break below this range could trigger selling pressure, dragging the index back toward 25,100 and 25,000-. This zone will act as a crucial short-term support to watch out for.
Overall, with a gap-up opening near 25,450, the sentiment remains bullish. However, profit booking around resistance levels cannot be ruled out. Traders should ride the momentum with strict stop-losses while trailing profits as the index approaches higher targets.
NIFTY : Trading levels and plan for 18-Sep-2025NIFTY TRADING PLAN – 18-Sep-2025
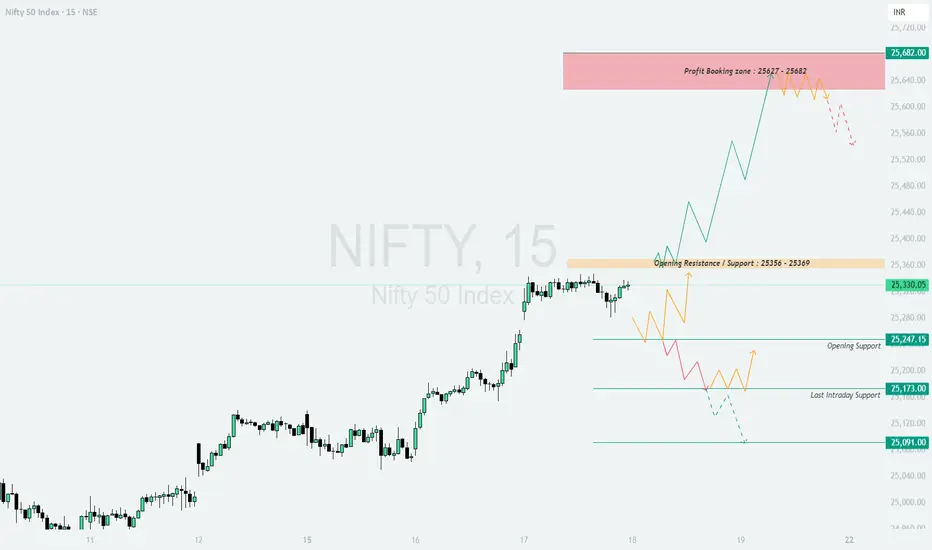
📌 Nifty is consolidating just below the Opening Resistance zone (25,356–25,369). Tomorrow’s opening direction will determine whether the index moves towards the Profit Booking Zone (25,627–25,682) or pulls back towards support levels.
1. Gap-Up Opening (100+ Points Above 25,430) 🚀
If Nifty opens with a strong gap-up above the resistance band (25,356–25,369) and sustains, bullish momentum can continue.
Sustained trade above 25,430 can push the index towards 25,627–25,682 (Profit Booking Zone).
This is a key supply zone – expect some resistance and possible intraday profit booking here.
Aggressive longs should be avoided inside the profit booking zone. Instead, book profits or trail stop losses.
Stop loss for longs should be placed below 25,356 on an hourly close basis.
📌 Educational Note: Gap-ups above resistance often look attractive, but rallies into supply zones carry reversal risk. Be disciplined with trailing stops.
2. Flat Opening (Near 25,330–25,356 Zone) ⚖️
If Nifty opens flat near the current resistance, early moves may remain choppy.
Inside 25,330–25,356, avoid aggressive entries as this is a "no-trade zone."
A breakout above 25,369 can open the path towards 25,627–25,682.
A breakdown below 25,247 will shift sentiment bearish, with downside targets at 25,173 → 25,091.
Patience is key; wait for the market to give clear direction before committing.
📌 Educational Note: Flat openings test traders emotionally. Only trade once the index breaks out of the consolidation range with momentum.
3. Gap-Down Opening (100+ Points Below 25,230) 🔻
If Nifty opens with a gap-down below 25,247, caution is needed as downside momentum may accelerate.
A sustained move below 25,230 can pull the index towards 25,173 (Opening Support).
Further breakdown below 25,173 may drag prices towards 25,091 (Last Intraday Support).
Any pullback towards 25,247 should be watched carefully; rejection here can provide fresh short opportunities.
Stop loss for shorts should be kept above 25,356 on an hourly close basis.
📌 Educational Note: Gap-downs below key supports often invite panic selling, but they can also trap sellers if recovery happens quickly. Always confirm with volume before shorting.
💡 Risk Management Tips for Options Traders
Avoid chasing far OTM options; theta decay accelerates near expiry.
Keep position size small during gap openings, as volatility spikes premiums.
Use stop losses based on hourly candle closes to avoid intraday whipsaws.
Hedge naked positions with spreads to control risk.
Book partial profits at nearby levels instead of holding for the entire move.
📌 Summary & Conclusion
Above 25,369 → Bullish momentum towards 25,627–25,682 (Profit Booking Zone).
Flat near 25,330–25,356 → Wait for breakout or breakdown for clarity.
Below 25,230 → Bearish bias with targets 25,173 → 25,091.
📌 Key Point: First 30 minutes will be decisive tomorrow. Focus on breakouts from resistance/support zones instead of trading inside the chop.
⚠️ Disclaimer: I am not a SEBI-registered analyst. This analysis is shared for educational purposes only. Please do your own research or consult your financial advisor before taking trading decisions.
NIFTY KEY LEVELS FOR 17.09.2025NIFTY KEY LEVELS FOR 17.09.2025
RTF: 3 Minutes
If the candle stays above the pivot point, it is considered a bullish bias; if it remains below, it indicates a bearish bias. Price may reverse near Resistance 1 or Support 1. If it moves further, the next potential reversal zone is near Resistance 2 or Support 2. If these levels are also broken, we can expect the trend.
If the range(R2-S2) is narrow, the market may become volatile or trend strongly. If the range is wide, the market is more likely to remain sideways
please like and share my idea if you find it helpful
📢 Disclaimer
I am not a SEBI-registered financial adviser.
The information, views, and ideas shared here are purely for educational and informational purposes only. They are not intended as investment advice or a recommendation to buy, sell, or hold any financial instruments.
Please consult with your SEBI-registered financial advisor before making any trading or investment decisions.
Trading and investing in the stock market involves risk, and you should do your own research and analysis. You are solely responsible for any decisions made based on this research.
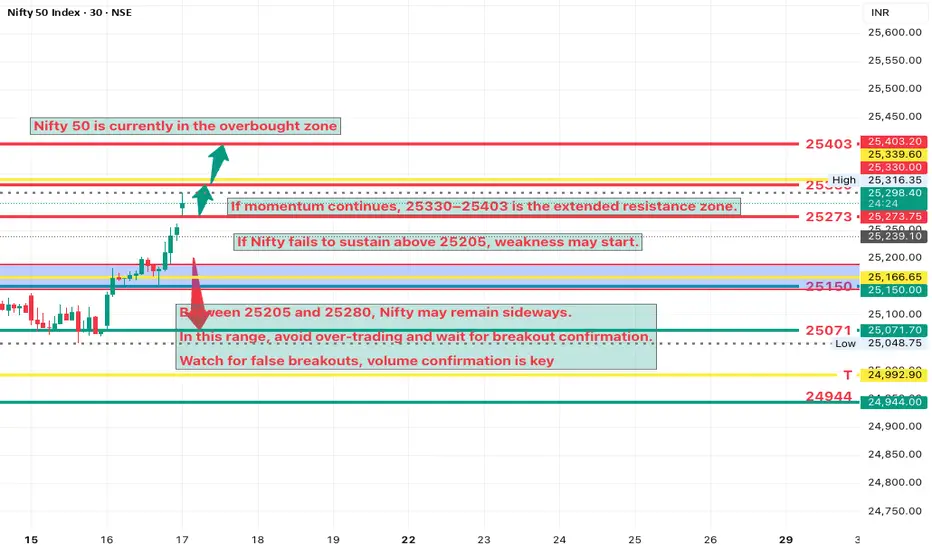
NIFTY Analysis 17 SEPTEMBER, 2025 ,Daily Morning update at 9 amIf Nifty opens around 25280 and sustains sideways, bullish strength builds.
Sustaining above 25280 for 30m gives next upside target 25330.
If momentum continues, 25330–25403 is the extended resistance zone.
Above 25330, traders must watch for profit booking signals.
f Nifty fails to sustain above 25205, weakness may start
First support at 25150, this is the key intraday level.
If 25150 breaks, next strong support lies at 25071
Below 25071 aggressive selling may appear
Between 25205 and 25280, Nifty may remain sideways.
In this range, avoid over-trading and wait for breakout confirmation.
#NIFTY Intraday Support and Resistance Levels - 17/09/2025Today’s session begins with a gap-up opening across both Nifty and Bank Nifty, reflecting strong bullish sentiment.
For Bank Nifty, the index is likely to open near 55,500 levels. Sustaining above 55,050–55,100 can trigger further upside momentum toward 55,250, 55,350, and 55,450+. A breakout above 55,550 will add strength, paving the way toward 55,750–55,950+. On the downside, immediate support lies at 54,950–54,900, and a break below may push prices lower to 54,750–54,550-.
For Nifty, the index is expected to open near 25,400 levels. A move above 25,250 can fuel bullish momentum toward 25,350, 25,400, and 25,450+. If it manages to break and hold above 25,500, then higher targets at 25,650–25,750+ come into play. On the downside, support is seen around 25,200–25,150, and a breach below could invite selling pressure, dragging it toward 25,100–25,000-.
Overall, both indices are showing bullish setups with gap-up openings, but profit booking around resistance zones cannot be ruled out. Traders are advised to follow breakout levels with strict stop-losses and trail profits as targets are achieved.