#Nifty directions and levels for July 19th.Good morning, friends! 🌺🍬 Here are the directions for July 19th:
In the last session, the Dow Jones fell drastically, indicating a negative bias. Our local market has a mixed bullish sentiment. Today, the market may open with a neutral to slightly gap-up start, as indicated by the Gift Nifty, which shows a +10 points.
Nifty and Bank Nifty are showing different structures. Nifty has a solid bullish structure, while Bank Nifty is in consolidation. Let's look at this one by one.
Nifty:
In the previous session, Nifty had a huge movement at the end of the day, making a new high with a solid handle. What’s next? I will explain step by step to help you easily understand.
Point 1: If you roughly look at the chart, it shows a solid bullish structure. You can expect the rally to continue if it breaks the previous high. This is the basic structure.
Point 2: But even if made a new high with solid candle The RSI did not break the previous high in 4H, 1H, or even 15min. At the same time, the Dow Jones also fell drastically.
Point 3: And if u look at the Bank Nifty it did not participate in this rally. but it has a consolidation. If it breaks the consolidation, it may help continue the rally. The probability is uncertain.
Considering these three points, it’s complicated to conclude the direction. Here’s my opinion: if the market breaks the previous high and Bank Nifty supports it, we can enter a long position, which may yield better results. Alternatively, if there is a solid breakout candle, you can enter, but the decision is yours. This is our bullish variation.
Bearish view:
Alternatively, if the market declines initially, we could wait for the 38% Fibonacci level breakout. If it breaks, we can expect a correction of a minimum of 50% to 78%. On the other hand, if it doesn’t break 38%, then it will maintain the bullish bias.
Niftytradesetup

Nifty Intraday Support & Resistance Levels for 19.07.2024On Thursday, Nifty took support exactly at the 15m demand zone (24485 - 24516) mentioned in the last post, broke the previous high, and made a new all-time high of 24837.75 before closing at 24800.85. The weekly (50 SMA) and daily trends (50 SMA) are now overbought.
Support Levels:
Near support/demand zone (30m): 24599 - 24648
Far support/demand zone (30m): 24504 - 24560
Major support/demand zone (125m) for weekly trade: 24193 - 24357
Major support/demand zone (Daily): 24141 - 24461
There is currently no supply/resistance zone seen on the chart.

Nifty Trade Setup: Wave 4th Selling Opportunity, 1:7 RR Nifty Wave Analysis: July 18th 2024
Nifty is going up in extension after the June 4th crash. It clearly looks like Wave 3, and Wave 4 is about to begin.
Short Entry : 24587
Stop Loss : 24680
Expected Destinations:
23862 (23.6%)
23370 (38.2%)
And max 50%
Wave 4 could be a sharp correction, but we can't ignore the possibility of a time-wise correction. Therefore, selling monthly CE with a hedge is safer or Short Nifty Future.
Disclaimer: This is for educational purposes only and not for trading. Please do your own analysis before making any decisions.

#Nifty directions and level for July 18th.Good morning, friends! 🌺🍬 Here are the directions for July 18th:
The global market has a bullish sentiment (based on Dow Jones). Our local market has a moderately bullish sentiment. Today, the market may open with a neutral to slightly gap-down start because the Gift Nifty indicates a 20-point decrease.
Nifty:
In the previous trading session, Nifty opened with a gap-up but did not rise much higher. Structurally, it is showing consolidation, which is likely to continue in the same direction. However, this will only happen if it breaks the previous high.
Given that Gift Nifty suggests a gap-down opening today, the scenario changes slightly.
So, If the market declines initially, we can expect a 23% to 38% level of correction. After that, if it finds support at these levels, the consolidation may continue. For a continuation, it must break the 38% Fibonacci level solidly.
Alternatively, if the gap-down doesn't sustain and the market pulls back, we can expect consolidation until it breaks the previous high. If it breaks the previous high with a solid candlestick structure, a rally continuation is expected, with some consolidations around the resistance levels. On the other hand, if it doesn't break with a solid candlestick structure, the market may continue in a diagonal pattern, meaning it won't generate much premium today. (I have plotted a bow and tie pattern).
Note: You can follow the same sentiment if it opens with a gap-up movement.

Nifty Intraday Support & Resistance Levels for 18.07.2024On Tuesday, Nifty opened with a gap up and reached a new all-time high of 24,661.25 before closing at 24,613. The weekly trend (50 SMA) is overbought, while the daily trend (50 SMA) remains positive.
Support Levels:
Near support/demand zone (15m): 24,485 - 24,516
Far support/demand zone (30m): 24,331 - 24,395
Major support/demand zone (75m) for weekly trade: 24,056 - 24,150
There is no supply/resistance zone visible on the chart at the moment.

#Nifty directions and levels for July 16th.Good morning, friends! 🌺🍬 Here are the directions for July 16th:
Global markets are maintaining their range (based on the Dow Jones). Our local market has a moderately bullish trend. Today, the market may open neutral to slightly gap-down, as indicated by GiftNifty, which shows a decrease of 13 points at 8:00 am.
Nifty and Bank Nifty have different structures: Nifty indicates a moderately bullish bias, while Bank Nifty indicates a range-bound market. Let's look at each one.
Nifty:
In the previous session, Nifty maintained a gap-up sentiment, but there was no big movement. Based on the wave structure, it could be a 5th wave, meaning a distribution wave. So, today we might see an initial correction. This is our first variation.
Alternatively, if the market pulls back and consolidates or breaks the supply zone, we can expect the rally to continue. in this case, If the market doesn't break the supply zone, it may consolidate between the supply zone and the 38% Fibonacci level in the minor swing.
> Without breaking this 38% level, it may maintain a bullish bias. A correction is expected only if it breaks the 38% level in the minor swing.
> that means, If it sharply rejects around the supply zone and breaks the 38% Fibonacci level in the minor swing, it may turn into a correction.

Nifty Intraday Support & Resistance Levels for 16.07.2024On Monday, Nifty opened gap-up, reached a new all-time high of 24,635.05, and closed at 24,586.70. The weekly trend (50 SMA) is overbought, and the daily trend (50 SMA) remains positive.
Support Levels:
Near support/demand zone (15m): 24,485 - 24,516
Far support/demand zone (30m): 24,331 - 24,395
Major support/demand zone (75m) for weekly trade: 24,056 - 24,150
Currently, there is no supply/resistance zone seen on the chart.

Short term trading opportunity in Bajel products for 20% upsideHi,
NSE:BAJEL has given a Bullish Flag Breakout on Daily charts with very good volume.
MACD is also on the bullish side on Daily and Monthly time frames. RSI is also on the bullish side on daily, weekly and monthly time frames.
In the current market scenario, I am expecting that the bullish momentum will continue.
Complete price projection like entry, stop loss and targets mentioned on the charts for educational purpose.
Don't Forget to Follow me to get all the updates.
Please share your feedback or any queries on the study.
Disclaimer: Please consult your financial advisor before making any investment decision.

short term trading opportunity in rana sugars for 20% upsideHi,
NSE:RANASUG has given a Bullish Flag Breakout on Weekly charts with very good volume.
MACD is also on the bullish side on Weekly time frames. RSI is also on the bullish side on daily, weekly and monthly time frames.
In the current market scenario, I am expecting that the bullish momentum will continue.
Complete price projection like entry, stop loss and targets mentioned on the charts for educational purpose.
Don't Forget to Follow me to get all the updates.
Please share your feedback or any queries on the study.
Disclaimer: Please consult your financial advisor before making any investment decision.

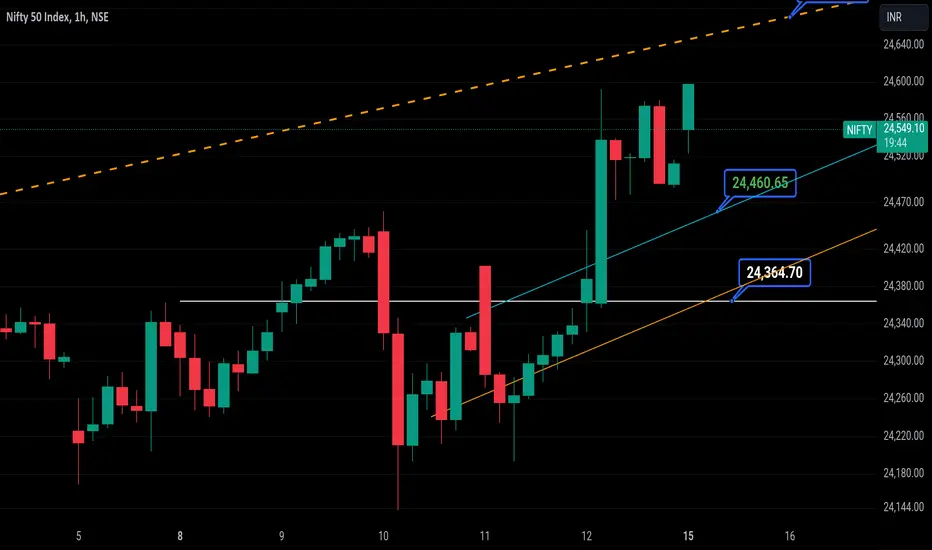
Nifty50 (15th July) 1/2Above dash line is still pending to test
Before moving upside to 24670
It could 📉 to 24460 to HUNT STOP LOSS and from there could bounce to 24670
If 24460 below hourly 🕯 closes then more 📉 fall is expected to 24364
Disclaimer:
It's a personal view not a financial advice and I assume no responsibility and liability whatever outcome arises.
NIFTY Prediction for today 15 July 24As we discussed, NIFTY took support at 24344 and had a good bullish run, broke resistance, and sustained to the upside, showing a good bullish nature.
If we look at the chart now:
The market is trading in the uptrending parrell channel, which has HH and HL, which have a bullish structure.
Support levels: 24429, 24128, 23985
Resistance levels: 24577 and Resistance trendline.
If we look at the OI data:
PCR = 0.86 shows the market has a bullish sentiment. 24500 is Max pain. Lower levels have significantly higher PE writing than CE writing on higher levels, making a bullish market structure.
I am expecting the market to be sideways in the uptrend line channel. If the channel breaks down to the downside, a good bearish momentum can be seen till 24188.
Reason:
RSI > 60 shows the market has a bullish structure.
Price > EMA(13, 50, 200), which indicates the bullish market.
PCR = 0.86 indicates market-bullish sentiments.
Price > VWAP shows a Bullish market structure.
Verdict: Sideways or Bullish
Plan of action:
wait for 15 min candle. Wait for good price action on the 24500 levels, and make your positions accordingly.

#Nifty directions and levels for July 15th.Good morning, friends! 🌺🍬 Here are the directions for July 15th:
The global markets are showing a slightly bearish sentiment (based on the Dow Jones). Our local market is maintaining a moderately bullish trend. Today, the market may open neutral or with a gap-up start, as indicated by GiftNifty, which shows an increase of 50 points at 8:00 am.
Nifty and Bank Nifty have different structures: Nifty indicates a two-way move, while Bank Nifty indicates a range-bound market. Let's look at each one.
Nifty has closed above the all-time high after seven consecutive consolidation sessions. This suggests a solid rally ahead on a normal trading day. However, with the upcoming budget event, even if the market breaks the all-time high again, it is unlikely to go much higher due to current sentiment rather than technical factors.
> Based on this sentiment, if the gap-up sustains, we can expect a minimum of 24608 to 24644. After that, if the market rejects around the supply zone, we can expect a reversal of 38 to 78% in the Fibonacci sequence. This is our first variation. On the other hand, if the market doesn't reject there and consolidates, the rally will likely continue further.
> Alternatively, if the gap-up doesn't sustain, it may range between the previous day's high and the 4th wave demand zone. In this sentiment, there is no big correction. The correction will continue only if it breaks 24420.

Nifty Intraday Support & Resistance Levels for 15.07.2024On Friday, Nifty opened gap-up and made a new all-time high of 24,592.20 before closing at 24,502.15. The weekly trend (50 SMA) is overbought, and the daily trend (50 SMA) remains positive.
Support Levels:
Near support/demand zone (15m): 24,331 - 24,384
Far support/demand zone (5m): 24,201 - 24,235
Major support/demand zone (75m) for weekly trade: 24,056 - 24,150
Resistance Levels:
Near small supply/resistance zone (15m): 24,560 - 24,580

NIFTY Intraday Trade Setup For 15 Jul 2024NIFTY Intraday Trade Setup For 15 Jul 2024
Bullish-Above 24600
Invalid-Below 24550
T- 24780
Bearish-Below 24450
Invalid-Above 24500
T- 24275
NIFTY has closed on a slight bullish note with 0.73% gain last week. On 10 Jul it closed below PDL so as per the method we were following to ride the bullish move is now invalid. But now lets come to the 2nd validation point. Now if at all there is a bearish price action in daily TF then we will call it bearish and a confirmed reversal. Also this reversal confirmation will be updated through these trade setups. 24600 and 24450 are levels to watch out for tomorrow.
Coming to Monday's trade setup, if index opens flat and a 15 Min candle closes above 24600 then we will long for the target of 24780.
For selling we need a 15 Min candle close below 24450. T- 24275.
In case of a big gap up/down, wait till 10 o'clock and mark the high and low of the trading range (5MIN). Trade on this range breakout.
==========
I am Not SEBI Registered
This is my personal analysis for my personal trading. Kindly consult your financial advisor before taking any actions based on this.

#RELIANCE BREAKDOWN 15/07/2024RELIANCE as we expected. still intact on the upside view of a continuous bullish uptrend rally. there are vari some break even point target levels at 3210,3250 or 3300 may be touching the highest level before The Union Budget on 22 July 2024. Be aware of the market crash, And trade with risk 1:2,1:3,1:4,5,6........ profit always be on your side.

Nifty Intraday Levels | 12-JULY-2024#Optionbuyers
#Niftyoptionscalping
1️⃣ Zones you always Like:-
👉Green zone- Institutional support
👉Red zone - Institutional resistance
👉Gap between institutional zones is always of 100 points
👉Zone is created with the help of pivot points and Fibonacci
👉Advance version of price action
👉Trades based on Nifty future chart
2️⃣ Trade Execution:-
👉Trade based on order flow data
👉Timeframe - 1 min and 5 min
👉Risk Reward Ratio always 1:2
👉Strike price always ATM & slightly ITM
👉Maintain Position sizing according to your own method
3️⃣ House Rules in trading:-
👉Sharp at 9:15 AM
👉Priority to risk management
👉Fast execution (morning breakfast)
👉Stop-loss 10 points (strictly)
#ThankU For Checking Out Our IDEA , We Hope U Liked IT 📌
🙏FOLLOW for more !
👍LIKE if useful !
✍️COMMENT Below your view !
