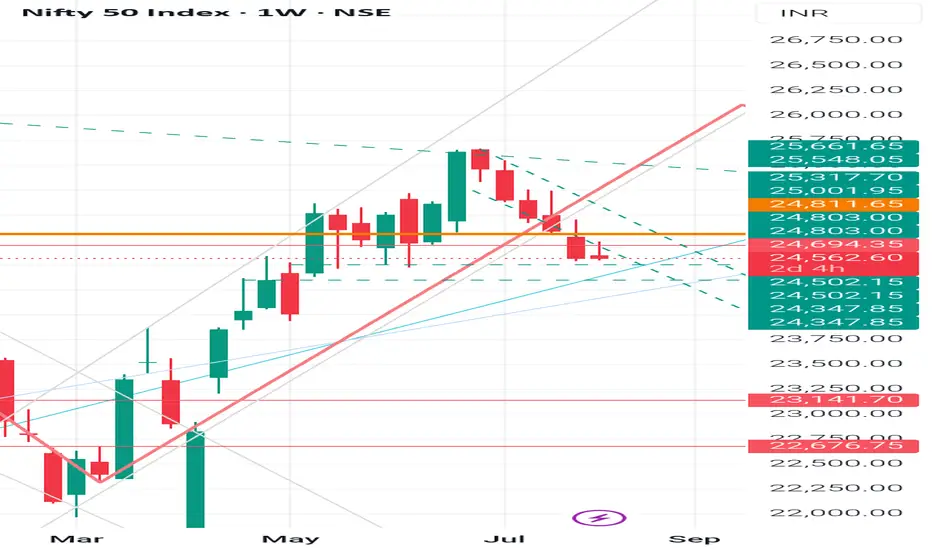
Nifty 50 Weekly Chart- Long-term bullish, short-term correctiveNifty 50 Weekly Chart – Inshort Summary
Trend: Long-term bullish, short-term corrective.
Immediate Support: ₹24,347 – ₹24,395
Key Supports Below: ₹23,141 · ₹22,676 · ₹21,137
Resistance Levels: ₹24,694 · ₹24,811 · ₹25,317 · ₹25,661
Fibonacci Zone: Strong retracement support between ₹23,100 – ₹22,600
Outlook: Possible dip toward ₹22,600–₹23,100, then rebound to ₹25,500+ if support holds.
Disclaimer -
I am not a SEBI-registered analyst or investment advisor. The views, charts, and trading ideas shared are purely for educational and informational purposes only. These do not constitute investment advice or a recommendation to buy/sell any securities. Please consult your SEBI-registered financial advisor before making any investment decisions. Trading and investing involve substantial risk — do your own research (DYOR).
Niftytradesetup

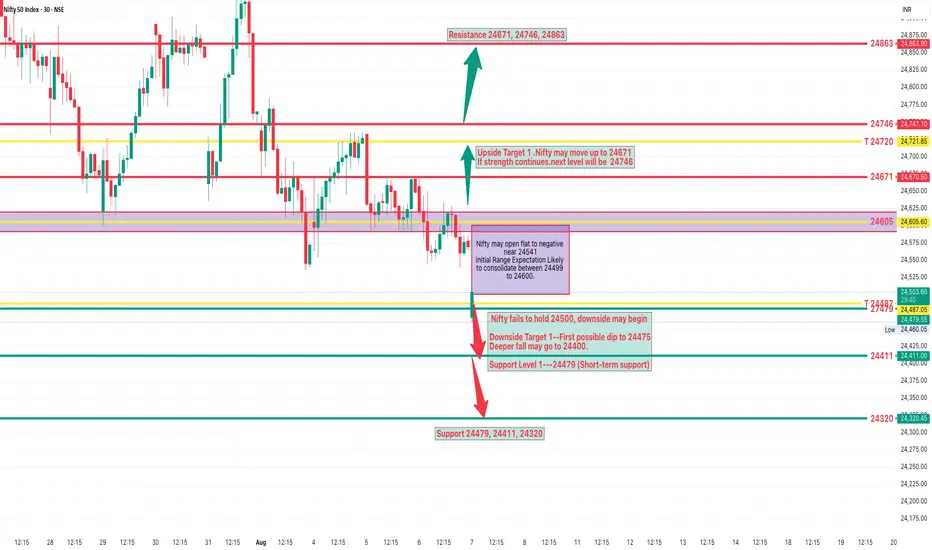
NIFTY Analysis 8 AUGUST, 2025 ,Morning update at 9 amNifty may open flat to negative near 24574 and may move in a range between 24548 and 24652 to consolidate.
Watch if a Bn pattern forms around 24620 on the 5 minute chart — in that case, Nifty may short cover towards 24670 and 24746
If Nifty is unable to sustain above 24548, it may slip towards 24496 and move sideways.
Always wait for a clear breakout before taking a position — the share market is totally mathematics-based, not a game of chance or luck.
Support & Resistance
Support Levels
24496 (S1)
24410 (S2)
24320 (S3)
Resistance Levels
24670 (R1)
24746 (R2)
24862 (R3)

#NIFTY Intraday Support and Resistance Levels - 08/08/2025Nifty is expected to open slightly gap up, indicating a positive start to the session. If the index sustains above the 24,550–24,600 zone, it could extend its upside toward 24,650, 24,700, and 24,750+. On the other hand, a rejection from higher levels, particularly near 24,750–24,700, could trigger a pullback toward 24,650, 24,600, and 24,550-.
A breakdown below 24,500 may invite further weakness, with downside targets at 24,350, 24,300, and 24,250-. Price action near the 24,550–24,600 support-turned-pivot zone will be key for intraday momentum. Traders should maintain strict stop-losses and consider partial profit booking at each milestone level.

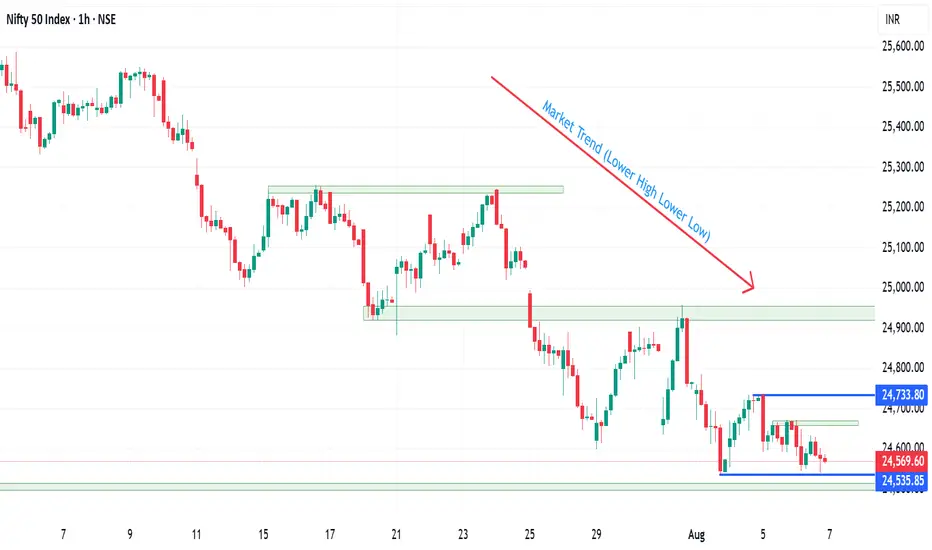
Nifty 50 Analysis – Key Support Zone HoldsThe Nifty 50 Index is currently testing a critical support zone near the 24,450–24,500 level, which has historically acted as a strong base for multiple reversals. As visible on the chart, price action has formed a series of lower highs and lower lows, but recent candles show buyer defense around this support, hinting at a potential bottom formation.
Structure Breakdown
Over the past few sessions, Nifty has been in a short-term downtrend, trading consistently below the 200 EMA, which confirms the bearish pressure. However, price is now at a make-or-break support level, which has been respected multiple times over the past two months.
A potential W-shaped bottom pattern (double bottom or inverse head & shoulders-like) seems to be forming, which could signal a bullish reversal if the neckline (near 24,850–24,900) breaks convincingly.
Bullish Possibility
If the support holds and price breaks above 24,900, we may see a trend reversal or at least a relief rally. The possible upside targets include:
First Target: 25,100
Second Target: 25,350
Swing Target: 25,600+
The move may be sharp if shorts start covering and fresh buying enters on confirmation. A successful reclaim of the 200 EMA will strengthen the bullish structure.
Bearish Breakdown Possibility
On the flip side, if price fails to hold above 24,450 and we get a candle close below this zone, the bullish reversal setup will get invalidated. This could open room for:
Downside Target 1: 24,200
Downside Target 2: 23,950
Extended Target: 23,700 zone (last swing low)
In this scenario, bears regain full control, and the overall downtrend from July could continue deeper.
Risk Factors for Both Sides
News Event Risk: Any macroeconomic event (like inflation data, RBI policy changes, or geopolitical developments) could trigger volatility and invalidate patterns.
False Breakouts: Watch for fake moves above resistance or below support. Always wait for confirmation candle close.
Gap Open Risk: Overnight global market moves can trigger gap-ups/downs, skipping stop-losses.
Trader Suggestions
- Wait for confirmation before entering long above 24,900 or short below 24,450.
- Use tight stop losses as volatility near key levels can result in whipsaws.
- Avoid heavy positions in this uncertain phase unless breakout or breakdown confirms.
- Keep watching for volume and price momentum for signs of real conviction.
- Option traders may explore straddle/strangle near this tight range, if expecting a sharp move.
Final Word
Nifty is at a crucial turning point. The support zone has worked like a wall so far—but whether it leads to a reversal rally or a breakdown will depend on how price reacts in the next 1–2 sessions. Trade with a clear plan, and adapt quickly based on market behavior.

NIFTY Analysis 7 AUGUST, 2025 ,Morning update at 9 amSELL TRADE SETUPS
Trade 1: Breakdown Below 24449
Trigger: Price breaks and sustains below 24500.
Entry: Short below 24490 (after 5-min candle close).
Target 1: 24475
Target 2: 24411
Stop Loss: Above 24520
Trade 2: Breakdown Below 24475
Trigger: Price sustains below 24475.
Entry: Short below 24470
Target 1: 24411
Target 2: 24320
Stop Loss: Above 24490
BUY/LONG TRADE SETUPS
🔺Trade 3: Breakout Above 24600 with BB Pattern
Trigger: BB Pattern confirmed on 5-min chart around 24600
Entry: Buy above 24610
Target 1: 24672
Target 2: 24745
Stop Loss: Below 24585
Trade 4: Breakout Above 24746
Trigger: Strong bullish momentum above 24746
Entry: Buy above 24750
Target: 24863
Stop Loss: Below 24720
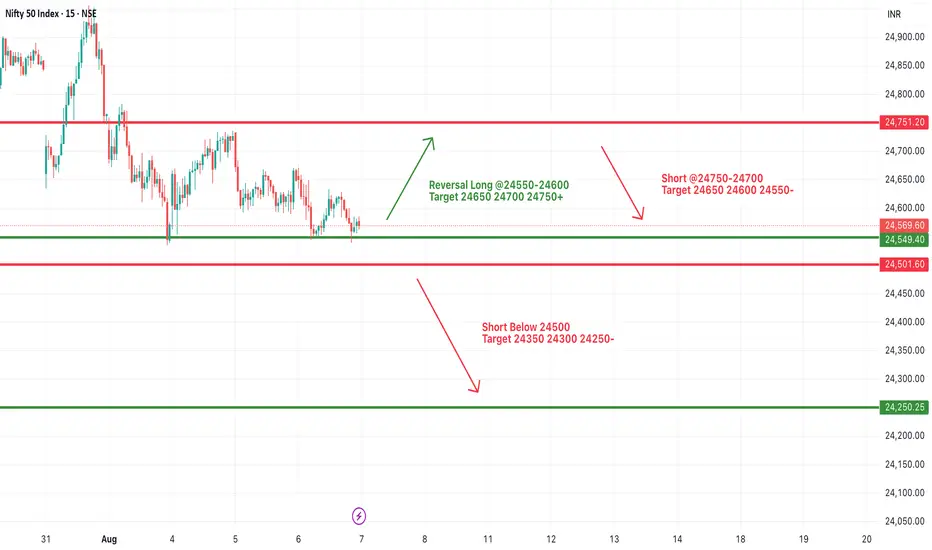
#NIFTY Intraday Support and Resistance Levels - 07/08/2025Nifty is expected to open flat near the 24,550–24,570 range, showing signs of consolidation after recent volatile moves. This zone is likely to act as a key intraday support level, and price action here will be crucial in determining further direction.
If Nifty manages to hold above the 24,550–24,600 level and shows reversal signs, a bounce back can be anticipated. In such a case, the index may move upward toward 24,650, 24,700, and eventually 24,750+. This upside move would indicate strength returning at lower support levels.
However, if Nifty fails to sustain above 24,550 and breaks below the 24,500 level, it could trigger a downward move. A short-side opportunity may emerge below 24,500, with potential targets at 24,350, 24,300, and 24,250-. On the other hand, any bounce near 24,550–24,600 could provide a reversal long setup targeting 24,650, 24,700, and 24,750+.
Expecting a nice move on Nifty weekly expiry 07/08/2025.Nifty for the last three days is forming an inside candle, chances of it moving either side is high.
If the market starts trading below 24510, it may test the pervious support around 24230 and another levels below it.
On the higher side, trade can only be initiated only once 24650 levels are taken out.
In case of a gap down wait for the retest of the support zone that will act as the resistance now. Enter trade only once the setup triggers.
Major resistance levels :- 24660, 24733
Support levels :- 24500 (psycological level), 24228
Hourly Moving averages are above the closing price while the Daily 100 EMA is around the closing leves, which can act as the support else it can come to test the 200 EMA (24200).
Wait for the price action near the levels before entering the market.
Nifty : Make or break support 24500Nifty is trading near it's crucial support 24500.
It's Very strong support level.
If this level breaks down and it sustains the day closing below this we may see further down trend.
Let's hope for the best closing for few trading sessions. Here are the levels to watch and learn.
Resistance 1 - 24700
Resistance 2- 24820
Support 1- 24500
Support - 24350
Disclaimer: The views are personal and strictly for learning purpose, we never post any trading advice.
NIFTY Intraday Trade Setup 06 Aug 2025NIFTY Intraday Trade Setup 06 Aug 2025
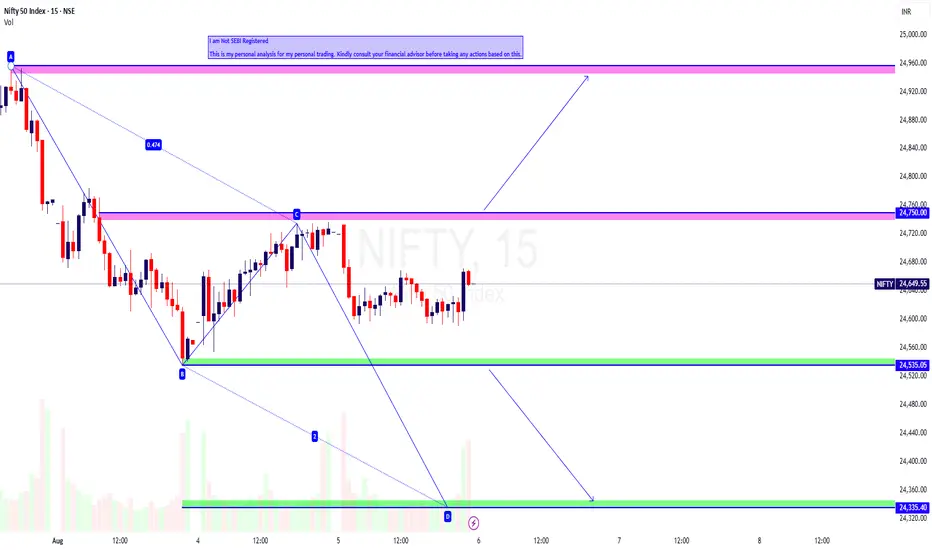
Buy-Above 24750
Invalid-Below 24700
T- 24950
Bearish- Below 24530
Invalid-Above 24580
T- 24335
NIFTY has closed on a bearish note with 0.3% cut today. It has made 2 consecutive inside candles in daily TF. 24500 zone will be a confluence zone, due to multiple supports taken earlier. Below 24400 index can escalate, and index may start an impulsive move. On flat opening above 24750 index may give a reversal move towards 25k. Below 24530 index will be simple short towards 24335 zone as per ABCD pattern. Plan on 15 Min candle closing.
In case of a big gap up/down, wait till 10 o'clock and mark the high and low of the trading range (5MIN). Trade on this range breakout.
==========
I am Not SEBI Registered
This is my personal analysis for my personal trading. Kindly consult your financial advisor before taking any actions based on this.
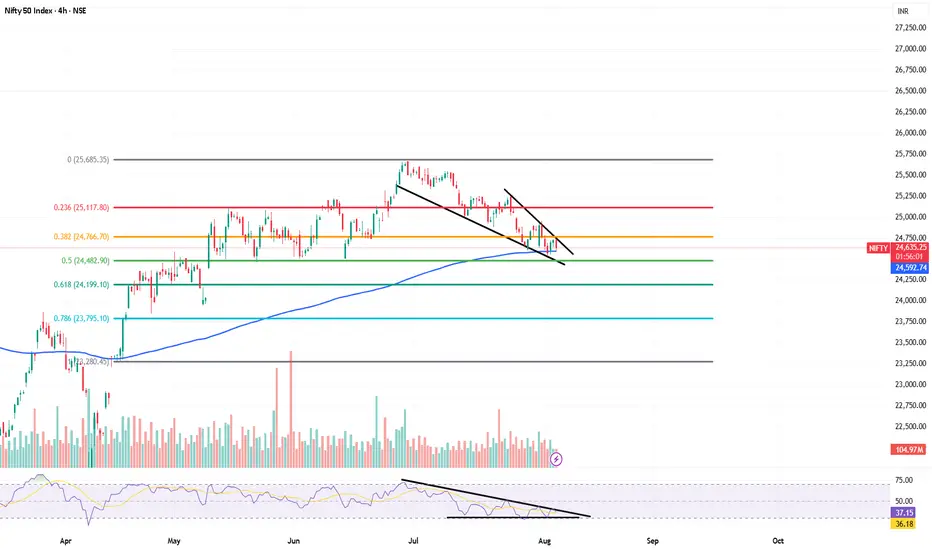
Nifty Bullish Confluence Set up ( Swing+ positional)Hello,
Nifty spot 24610 from low of 21780 made high around 25650 april to june in 2 months now Its retrace to 24600 i.e almost more than 50% retracement another is RSI squezze with bullish divergence in lowertimeframe with EMA 200 support and making pattern of falling wedge .
expecting bullish reversal set up for new lifetime high possibilties in next 2 months
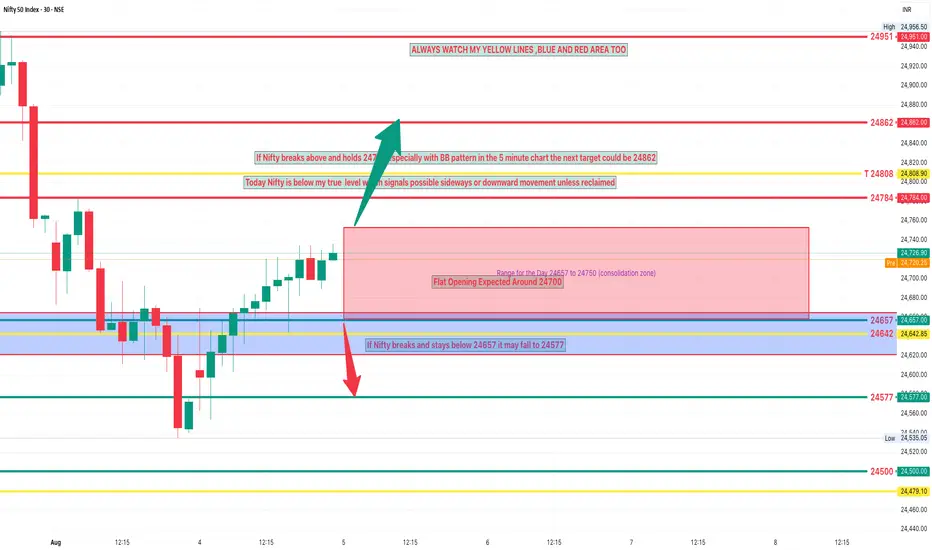
NIFTY Analysis 5 AUGUEST, 2025 ,Morning update at 9 amProfit booking and consolidation in a narrow range
Technical Pattern Indicates weakness above resistance and price struggling to break higher levels
Observe whether Nifty closed below or above the derived my levels
Today Nifty is below my true level which signals possible sideways or downward movement unless reclaimed
Expected Price Action Today
Flat Opening Expected Around 24700
Range for the Day 24657 to 24751 (consolidation zone)
Upside Trigger: If Nifty breaks above and holds 24751 especially with bb pattern in the 5 minute chart the next target could be 24862
Downside Trigger If Nifty breaks and stays below 24657 it may fall to 24577
Support 24657 ,24577 , 24500
Resistance 24784 ,24862 , 24951
if you have any problem too undestanding my levels or in trading msg me.
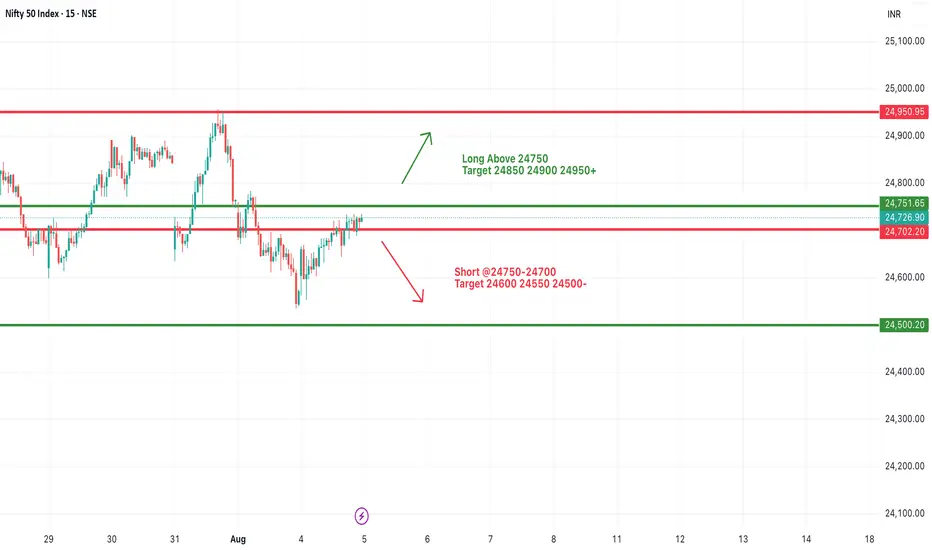
#NIFTY Intraday Support and Resistance Levels - 05/08/2025Nifty is expected to open flat near the 24,720–24,730 zone, showing signs of consolidation within a tight range. The price action remains stuck between the immediate resistance and support levels, and today’s move could be dictated by a breakout from this range.
On the upside, a breakout and sustained move above the 24,750 level may trigger a bullish rally toward 24,850, 24,900, and 24,950+ levels. This area has previously acted as resistance, and a clean breakout could lead to momentum-based buying.
On the downside, if Nifty fails to hold 24,700 and breaks below 24,750–24,700, a short opportunity may arise with potential targets at 24,600, 24,550, and 24,500- levels.
The range between 24,700–24,750 is the intraday decision zone. Traders should wait for confirmation and avoid premature entries. Use tight stop-losses and book partial profits near each level to manage risk effectively.
Dow Theory Update and Nifty AnalysisIn this video, we have explained the following points -
* A new Dow Top "A1" has been created by Nifty50.
* The significance of the new Dow Top has been explained.
* The current structure of Nifty has been discussed.
* The importance of waiting for the next candle and the current key support level has been highlighted.

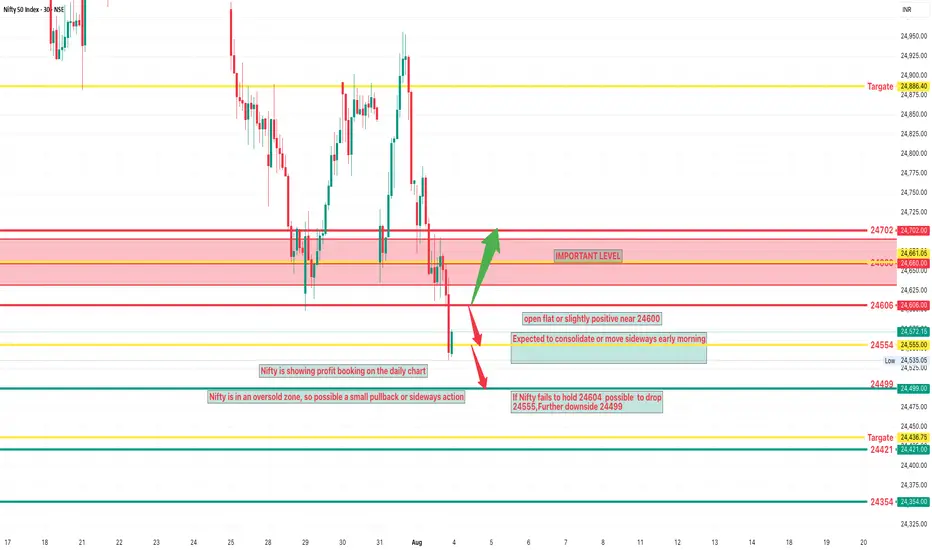
NIFTY Analysis 4 AUGUEST, 2025 ,Morning update at 9 amHowever, Nifty is in an oversold zone, so a small pullback or sideways action is likely.
Opening Expectation:
Likely to open flat or slightly positive near 24600.
Expected to consolidate or move sideways early in the day.
Bullish Scenario:
If a bb pattern forms around 24600 on the 5-min chart expect an upward move.
Potential targets: 24662 and 24702.
Bearish Scenario:
If Nifty fails to hold 24604 likely to drop:
First target: 24554
Further downside: 24499
Key Support & Resistance Levels (Unique & Precise):
Type Levels
Support 24,499 , 24421 ,24354
Resistance 24606 , 24660 , 24702
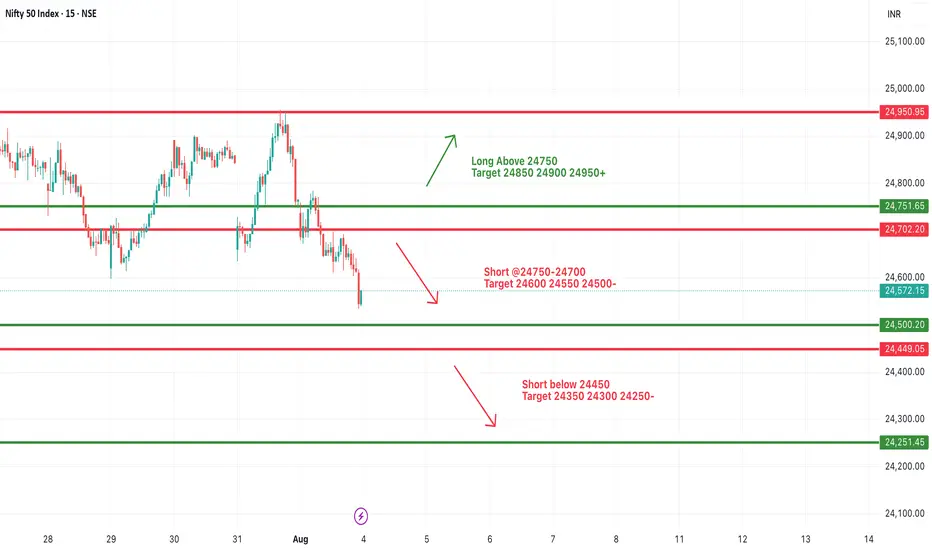
#NIFTY Intraday Support and Resistance Levels - 04/08/2025Nifty is expected to open slightly gap up near the 24,550–24,600 zone. This area is currently acting as a resistance, and price action around it will be crucial to determine directional momentum for the session.
If Nifty sustains above 24,750, a bullish rally may unfold with potential upside targets at 24,850, 24,900, and 24,950+. A breakout above 24,751.65 would confirm strength and may trigger intraday buying interest.
On the downside, if Nifty faces rejection around 24,700 and breaks below the 24,700–24,750 zone, it can lead to a bearish move. A breakdown below this zone opens downside targets at 24,600, 24,550, and 24,500-. Further weakness below 24,450 may lead to an extended fall toward 24,350, 24,300, and 24,250-.
The broader trend remains weak unless Nifty reclaims strength above 24,750. Traders should stay cautious near reversal levels and maintain strict trailing stop-loss to protect profits and manage intraday volatility.
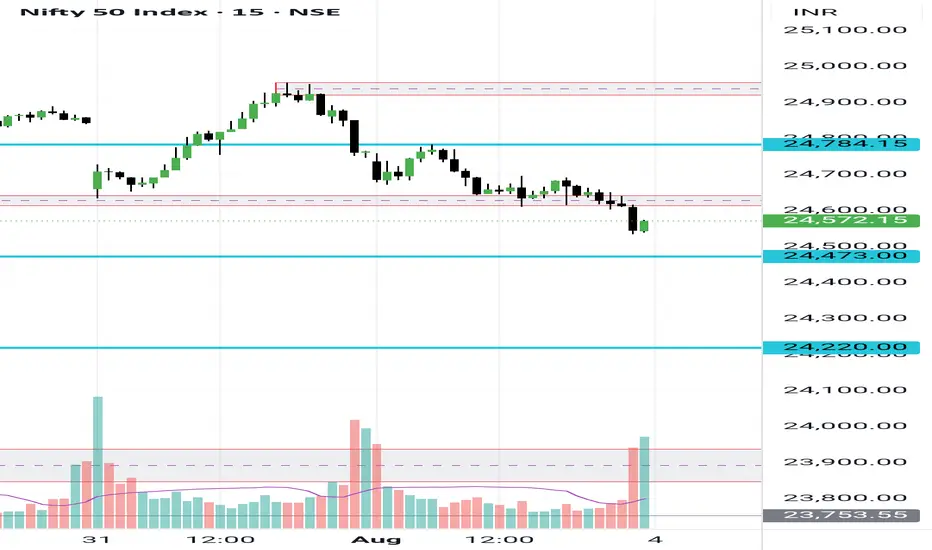
Nifty levels for next week (4th August 2025 onwards)Nifty is in a clear downtrend, important levels are marked on the chart.
A break below 24550 may bring the 24460 level and a break further may show the 24300 levels too on the chart. It may not be seen in a single day but can be visible in few trading sessions.
An up move is possible only above 24630 level that too if price sustains above this level else it may bring more selling from upper levels..
Let's see how it turns out..
01 Aug 2025 - Nifty still riding on the short wave, down 490pts Nifty Stance Bearish 🐻
Our last signal crossover was on 24th July when we went short, see the red marker. From there, Nifty has fallen 1.96% ~ 490pts and it has been on a nice downward slope.
On 31st Jul, 14.03, we were almost ready for the bullish crossover, but the 14.19 candle saved us, which drove Nifty down 41pts. In fact, Nifty fell over 165pts after the 2pm hammer candle pattern. Even though a technical analyst could take credit for the nice price predictions, most of these moves are actually due to Trump's tariffs and the failed trade deals.
Trump accusing us of buying oil from Russia is actually a "bad actor", because it could pave the way to sanctions on Indian exporters and financial transactions. Basically, the US has ended up sanctioning every country dealing with its enemies.
I wrote a detailed article on this topic three days ago, just google for "US India Trade Tariff at 25% + Penalty. Time for us to step up" to read this article.
From here, if Nifty drops to 24250 levels in the current series, it would be the best-case scenario. The challenge for that would be the rumours and gossip on the trade deal could create huge short-covering and false signals. Hope the simple EMA crossover chart pattern holds its ground.

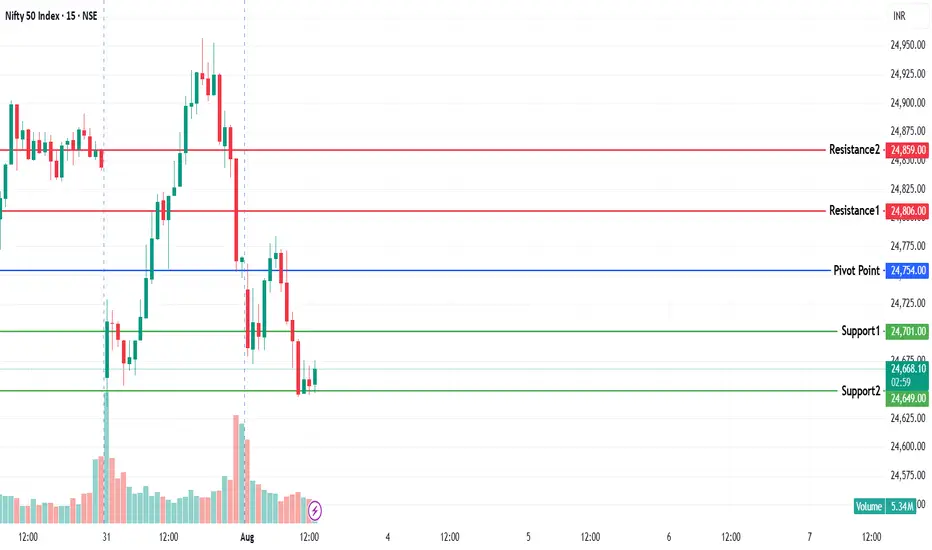
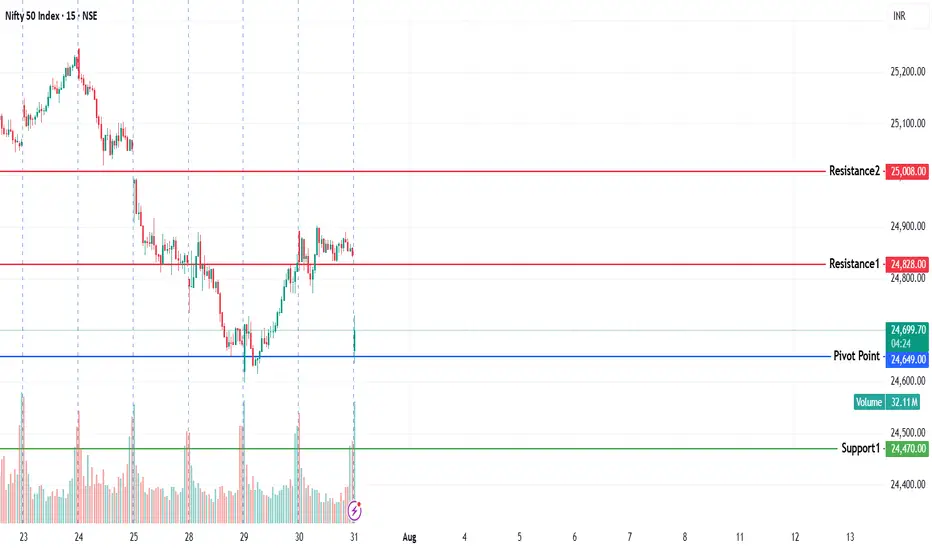
NIFTY KEY LEVELS FOR 01.08.2025NIFTY KEY LEVELS FOR 01.08.2025
If the candle stays above the pivot point, it is considered a bullish bias; if it remains below, it indicates a bearish bias. Price may reverse near Resistance 1 or Support 1. If it moves further, the next potential reversal zone is near Resistance 2 or Support 2. If these levels are also broken, we can expect the trend.
If the range(R2-S2) is narrow, the market may become volatile or trend strongly. If the range is wide, the market is more likely to remain sideways
📢 Disclaimer
I am not a SEBI-registered financial adviser.
The information, views, and ideas shared here are purely for educational and informational purposes only. They are not intended as investment advice or a recommendation to buy, sell, or hold any financial instruments.
Please consult with your SEBI-registered financial advisor before making any trading or investment decisions.
Trading and investing in the stock market involves risk, and you should do your own research and analysis. You are solely responsible for any decisions made based on this research.
NIFTY Analysis 1 AUGUEST, 2025 ,Morning update at 9 amIF YO LIKE THESE LEVEL SAY THANK YOU
Expected Scenarios:
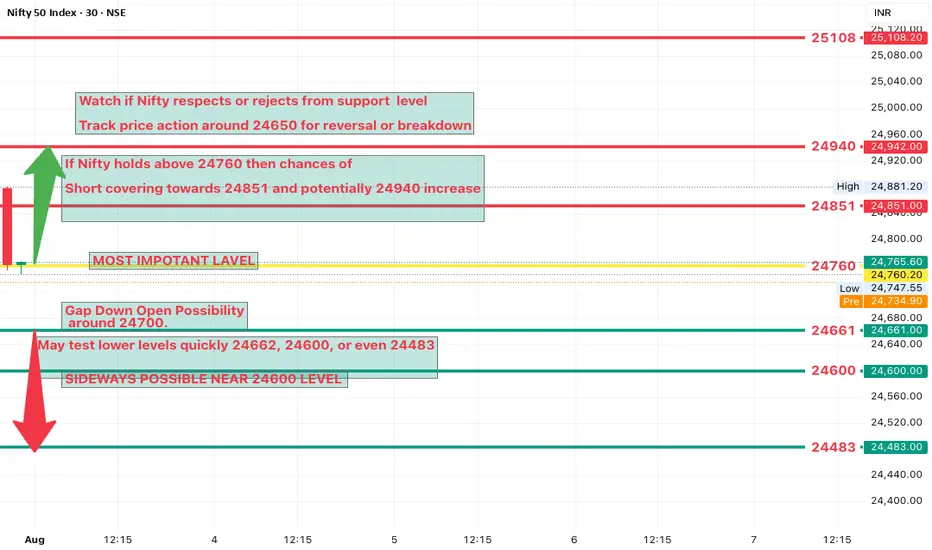
Gap-Down Open Possibility:
Likely around 24700.
May test lower levels quickly: 24662, 24600, or even 24483.
Bearish Setup to Watch:
On the 5-min chart, watch near 24650:
If a Bearish Bottleneck Pattern forms Nifty may slip towards:
24602, and even 24500.
Recovery Watch:
If Nifty holds above 24760 then chances of:
Short covering towards 24851 and potentially 24940 increase.
Critical Levels (Exclusive Support & Resistance):
Support 24661 , 24600 ,24483
Resistance. 24851,24940,25108
Nifty opens below 24700 Wait for 24662 or 24600 test
Bearish bottleneck at 24650 Go short for 24602 24500
Nifty holds above 24760 Look for long towards 24851 24940
Nifty reclaims 24851 with strength Possibility of rally to 25108
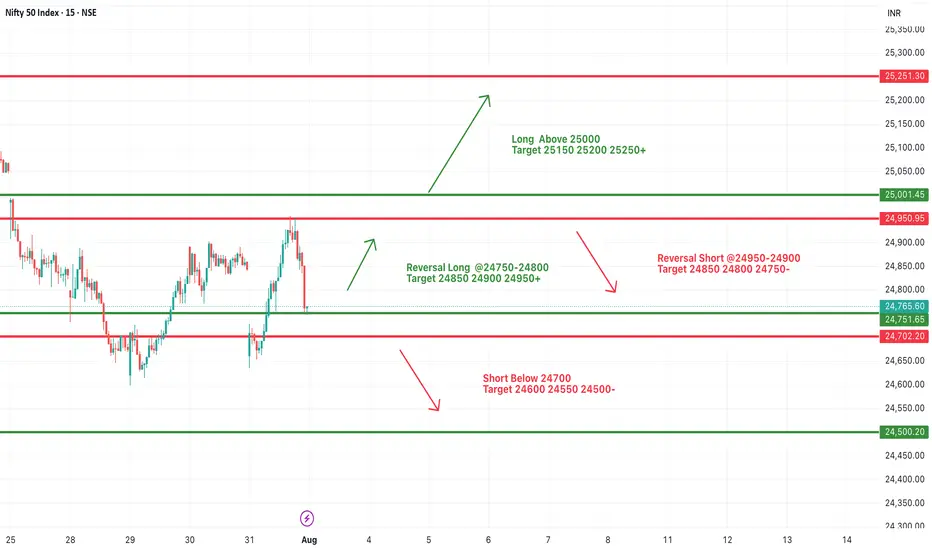
#NIFTY Intraday Support and Resistance Levels - 01/08/2025Nifty is likely to open flat near the 24,750 zone, suggesting a neutral start to the day. Traders should be prepared for a breakout or reversal setup based on how price behaves near key levels.
If Nifty holds the 24,750–24,800 zone and sustains, a reversal long opportunity is valid, with upside targets of 24,850, 24,900, and 24,950+. A breakout above the 25,000 psychological level would trigger a strong rally with higher targets of 25,150, 25,200, and 25,250+.
On the other hand, if Nifty faces resistance near 24,900–24,950, it could reverse sharply. A reversal short from this zone can target 24,850, 24,800, and 24,750. A further breakdown below 24,700 will open up shorting opportunities, targeting 24,600, 24,550, and 24,500.
Today’s flat opening presents a wait-and-watch situation. Price action near the key zones of 24,750–24,800 and 24,900–25,000 will determine directional momentum.
Nifty super resilience and stronger than before Everything we discussed in yesterday’s commentary played out beautifully:
1. We noted that sellers were stronger than buyers — and the market opened gap down, just as expected.
2. I also highlighted that the Intraday chart looked bullish — and yes, we saw a solid bounce intraday.
3. Later in the day, the market reversed again — exactly how the red flag on the daily chart warned us.
This kind of price behavior confirms one thing: the market is flowing in sync with our planning.
And when that happens, it becomes the perfect ground for my trading style. I’ll continue focusing on my momentum setups with full confidence.
Now let’s come back to the market:
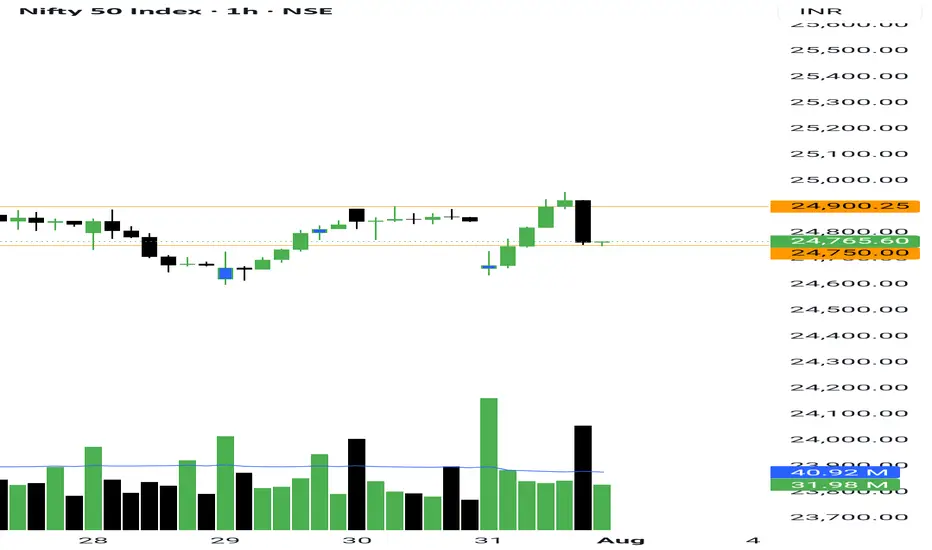
NSE:NIFTY has shown strong resilience. Despite all the noise around the Trump news, it managed to close above the key support of 24700 — a sign of strength.
Pivot has now shifted to 24786, and Pivot Percentile is just 0.07%.
This tells us that any sustained move above 24796 can unleash a sharp directional move.
Support remains firm at 24750.
More importantly, buyers have outnumbered sellers by 28 million — setting a strong tone as we step into August.
NSE:BANKNIFTY also looks primed.
Pivot Percentile is at an ultra-tight 0.02%, and buyer volume leads by 29 million.
Support is placed at 55550, with resistance around 55976. A breakout here could kickstart a fresh trend.
Sector-wise, Construction and NSE:CNXREALTY are gaining traction.
Oil & Energy is also showing promising signs.
Keep an eye on NSE:ASHOKLEY over the next few sessions — something’s brewing there.
Today I traded just one setup — NSE:BELRISE .
Booked a clean 2% intraday gain, though the stock went on to give over 5% after exit. Still, a green trade is a good trade.
That’s all for the day.
Take care and have a profitable tomorrow.
NIFTY KEY LEVELS FOR 31.07.2025NIFTY KEY LEVELS FOR 31.07.2025
If the candle stays above the pivot point, it is considered a bullish bias; if it remains below, it indicates a bearish bias. Price may reverse near Resistance 1 or Support 1. If it moves further, the next potential reversal zone is near Resistance 2 or Support 2. If these levels are also broken, we can expect the trend.
If the range(R2-S2) is narrow, the market may become volatile or trend strongly. If the range is wide, the market is more likely to remain sideways
📢 Disclaimer
I am not a SEBI-registered financial adviser.
The information, views, and ideas shared here are purely for educational and informational purposes only. They are not intended as investment advice or a recommendation to buy, sell, or hold any financial instruments.
Please consult with your SEBI-registered financial advisor before making any trading or investment decisions.
Trading and investing in the stock market involves risk, and you should do your own research and analysis. You are solely responsible for any decisions made based on this research.
NIFTY Analysis – 31 july 2025 ,Morning update at 9 amExpected Market Behavior
Nifty may open gap down near 24757
May slip towards 24620 and then 24481
Around 24620, expect sideways or consolidation
If a Bearish Bottleneck Pattern forms near 24620 (5-min chart), then Nifty may fall further toward 24450 to 24500
If Nifty sustains above 24922, it may trigger short covering toward 24995 and possibly 25097
Support
24757
24620
24481
Resistance
24922
24995
25097
Tariff news increases volatility
Causes gap-down openings or weak recovery
Top Sectors Affected by U.S. Tariffs on India
1. Pharmaceuticals
India is one of the largest exporters of generic drugs to the U.S.
Impact: U.S. tariffs can reduce competitiveness and margins
Key Stocks Affected:
Sun Pharma
Cipla
Dr. Reddy’s Labs
Lupin
Aurobindo Pharma
2. Textiles & Apparel
A large chunk of India’s textile exports (clothing, home textiles) go to the U.S.
Impact: High price due to tariffs = loss to competitors like Bangladesh, Vietnam
Key Stocks Affected:
Welspun India
Arvind
Raymond
Vardhman Textiles
KPR Mill
3. 💻 Information Technology (IT) Services
Though services usually aren’t taxed directly like goods, indirect restrictions (like visa issues or regulatory controls) can affect business.
Impact: If IT services are restricted, contract flow from U.S. reduces
Key Stocks Affected:
TCS
Infosys
Wipro
HCL Tech
Tech Mahindra
4. Steel & Metal Exports
U.S. often imposes duties on Indian steel and aluminum for protectionism.
Impact: Steel exports drop, prices fall
Key Stocks Affected:
Tata Steel
JSW Steel
Jindal Steel & Power
5. Auto Components
India exports automotive parts to U.S. automakers.
Impact: Higher cost for U.S. buyers may reduce demand
Key Stocks Affected:
Motherson Sumi
Bharat Forge
Sundaram Fasteners
6. Chemical & Specialty Chemical
India is a big player in specialty chemicals, also impacted by tariff or import restrictions.
Key Stocks Affected:
SRF
PI Industries
Aarti Industries
Navin Fluorine
