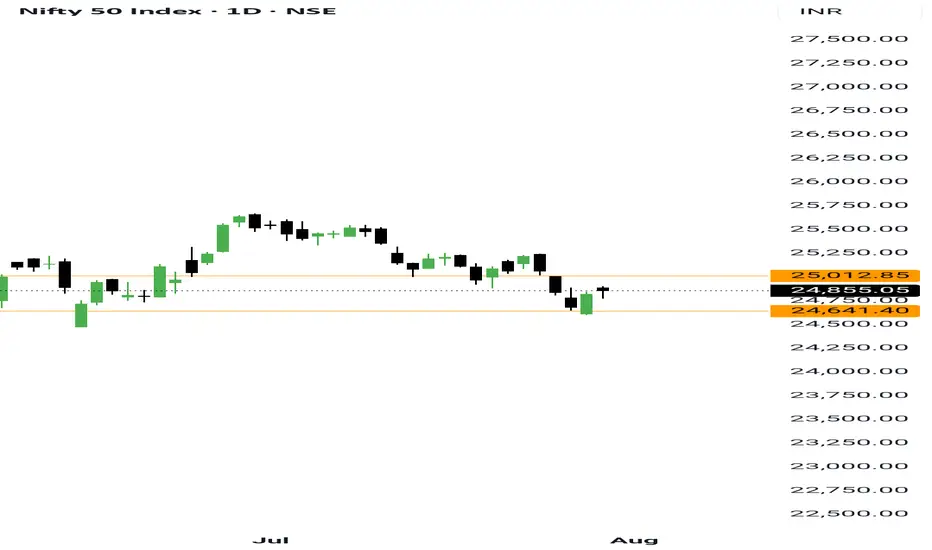
Will 25 percent TARIFF put NIFTY under pressure!!??As we can see NIFTY remained sideways which was well anticipated as it is in a tight range. Now that POTUS TRUMP has announced 25 percent tariff with penalty that will be effective from AUG 1 can put NIFTY under pressure as much like CHINA's delay of tariff implementation, it was anticipated that INDIA's tariff might be delayed but its implemetation can create havoc in the market and that very havoc can give buying opportunity to many. IF NIFTY opens very weak, it is likely that it would start recovering from important demand zones. It would be better to stay away and watch market for tomorrow as it can decide further move so keep watching cautiously.
Niftytradesetup

Bullish but volatile - Nifty and Banknifty Setup So as anticipated, the dip was bought and the market moved just the way I mapped it. When price action aligns with planning, it creates the perfect environment for my trading system to thrive.
NSE:NIFTY Pivot has now shifted to 24843. Support is right below at 24830, below that 24700 and the important resistance remains at 25000.
What’s more interesting is that Pivot Percentile has dropped to just 0.05%. Such tight compression often leads to an explosive move — and we need to be ready for it.
While intraday structure looks bullish, there's a red flag on the daily chart — sellers have outnumbered buyers by 40 million in volume.
So what we’re looking at is:
Price Action: Bullish
Volume: Bearish
And that = a highly volatile environment.
Again, sticking to my Earnings Pivot strategy is proving to be the most effective and safest approach in this kind of market.
Over to NSE:BANKNIFTY — Pivot is at 56178, support is near 56000, and resistance lies at 56700. Structure here is also shaping up bullish.
Sectors that are heating up include:
NSE:CNXFINANCE , #FERTILIZER, and #AGROCHEMICAL — all showing signs of strong rotational momentum.
Now to today’s trade performance — another solid day of execution:
1. NSE:HIRECT – up 13.96%
2. NSE:MBAPL – added 7.26%
3. NSE:KRN – closed 5.82% higher
4. #SCODATUBES – gained 4.88%
5. #LT – moved 4.85%
That wraps it up for the day. Stay focused, stay disciplined, and may tomorrow bring more greenery in your account. Take care and trade safe.
Nifty 50 Analysis and Market AnalysisIn this video, we have discussed -
What is the current structure of Nifty 50?
Smaller swing formations can lead to smaller correction.
Significance of current candles.
If the market continues to fall, then we can get Dow top.
People should not jump into trading just by seeing the green candles.

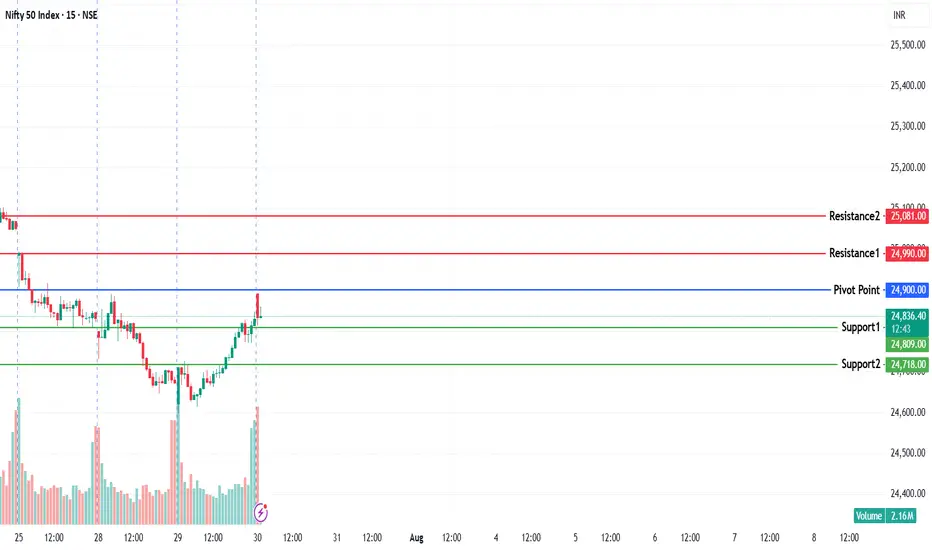
NIFTY KEY LEVELS FOR 30.07.2025NIFTY KEY LEVELS FOR 30.07.2025
If the candle stays above the pivot point, it is considered a bullish bias; if it remains below, it indicates a bearish bias. Price may reverse near Resistance 1 or Support 1. If it moves further, the next potential reversal zone is near Resistance 2 or Support 2. If these levels are also broken, we can expect the trend.
If the range(R2-S2) is narrow, the market may become volatile or trend strongly. If the range is wide, the market is more likely to remain sideways
📢 Disclaimer
I am not a SEBI-registered financial adviser.
The information, views, and ideas shared here are purely for educational and informational purposes only. They are not intended as investment advice or a recommendation to buy, sell, or hold any financial instruments.
Please consult with your SEBI-registered financial advisor before making any trading or investment decisions.
Trading and investing in the stock market involves risk, and you should do your own research and analysis. You are solely responsible for any decisions made based on this research.
NIFTY Analysis – 30 july 2025 ,Morning update at 9 amMay open flat/negative and enter sideways consolidation.
Watchpoints:
Above 24846: Could trigger short covering up to 24920.
Bearish setup near 24777 (5-min chart): Could lead to a drop towards 24638.
Key Levels for Today:
Type Levels
Support 24756, 24639, 24555
Resistance 24846, 24920, 24997
Opening Scenario Handling:
If Nifty opens flat or slightly negative but holds above 24847, look for long (buy on dip) with targets 24920 to 24997.
If price action stays below 24777 and forms a Bearish Bottleneck on the 5-min chart, then sell on rise for targets 24638 to 24556.

#NIFTY Intraday Support and Resistance Levels - 30/07/2025After a strong recovery from recent lows, Nifty is expected to open flat today and may continue its upward momentum if key resistance levels are breached. The index is currently hovering near the upper end of its reversal zone.
Upside Levels:
A breakout above 25,000 could trigger bullish continuation.
If sustained, we can expect targets at 25,150, 25,200, and 25,250+.
This level is crucial for short-term trend reversal confirmation.
Reversal Buy Opportunity:
If Nifty takes support around 24,750–24,800, a reversal long can be initiated.
Expected targets for this setup: 24,850, 24,900, 24,950+.
Keep strict trailing stop loss as volatility may increase near upper resistance zones.
Reversal Short Setup:
If price fails to sustain above 24,900–24,950, a short opportunity may arise.
Expected downside targets: 24,850, 24,800, 24,750-.
This zone may act as a reversal point for sellers.
Breakdown Short Setup:
If Nifty breaks below 24,700, a strong downside move may begin.
In that case, expect targets at 24,600, 24,550, and 24,500-.
Summary:
Today’s session could turn directional after consolidation around key levels. Wait for confirmation near reversal zones before entering trades. Follow partial profit booking and trailing stop loss for intraday trades.

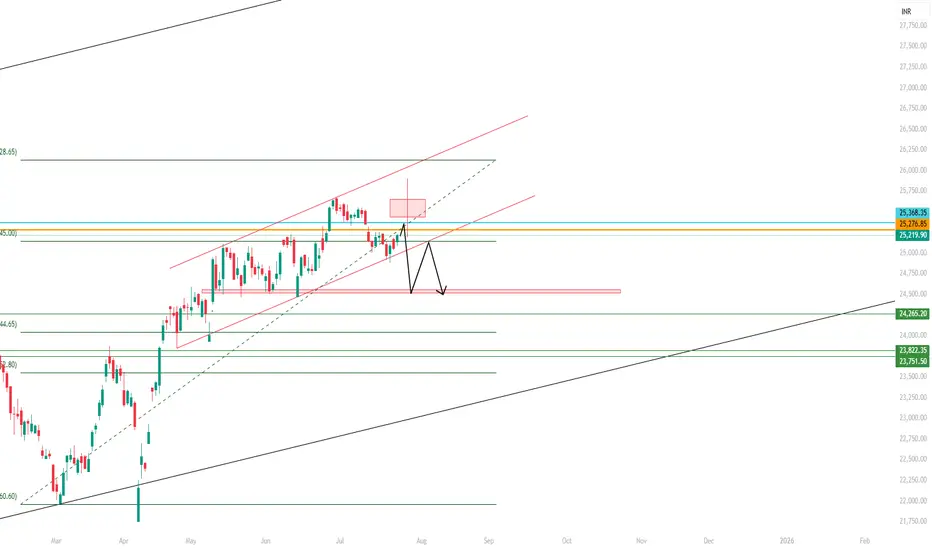
NIFTY50: Trend Reversal on the Horizon or More Downside Ahead?The Nifty50 index has witnessed consistent selling pressure throughout July, carving out a clean downtrend structure. However, recent price action suggests the index may be preparing for a potential structural shift, as visible through the formation of a reversal pattern—an Inverted Head & Shoulders on the 1-hour chart.
But before jumping to conclusions, let’s break it down in detail.
🔍 The Setup: July’s Downtrend & Emerging Reversal Zone
Since early July, the Nifty50 index has been consistently creating lower highs and lower lows, following a strong bearish sequence. Each bounce was short-lived and got sold into, confirming bearish dominance. The market sentiment was largely negative due to global volatility, sectoral underperformance, and FII selling.
But now, a trend resistance line—clearly respected multiple times—has been approached again, and this time, the structure looks different. The chart shows a potential inverted head and shoulders pattern, a classic bullish reversal formation that often signals an exhaustion of the downtrend.
📊 Potential Scenarios
✅ Bullish Case:
If NIFTY manages to:
Break above the trend resistance
Sustain above 25,100
And retest with a bullish engulfing candle or strong follow-through
Then we could see a fresh uptrend toward 25,400, 25,600, and possibly 25,750+, aligning with the measured move projection of the Inverted Head and Shoulders.
❌ Bearish Case:
If the price:
Fails to break the trendline
Faces rejection near 24,900–25,000
Or breaks below the right shoulder low again
Then the index might resume its downtrend, potentially testing back to 24,600, 24,400, and lower support zones.
📍Price Action Points to Watch
24,900–25,000: Trend resistance; immediate decision zone.
25,100–25,300: Strong supply zone; breakout confirms structure change.
24,700: Key swing low; a breach here confirms continuation of bearish trend.
Retest zones: Look for strong reversal candlesticks or rejection wicks near breakout points.
📝 Final Thought
This is a make-or-break zone for NIFTY. The market has been consolidating near the lows after a sharp selloff, and now it’s showing signs of reversal. But confirmation is key—don’t jump in without price breaking critical levels with strength.
A breakout above the neckline (25,100) followed by bullish confirmation could signal a trend reversal, while rejection from this zone may bring in another wave of downside.
In short, NIFTY is at an inflection point. Watch the 24,900–25,300 zone closely—it holds the key to the index’s next 300–500 point move.

NIFTY Intraday Trade Setup For 30 Jul 2025NIFTY Intraday Trade Setup For 30 Jul 2025
Bullish-Above 24900
Invalid-Below 24850
T- 25100
Bearish-Below 24590
Invalid-Above 24640
T- 24290
NIFTY has closed on a positive note today. This does not mean that the short term trend has changed. Bullish sentiment confirmation will be when index closes above 50 EMA in daily TF and closes above PDH in daily TF. Tomorrow a bullish move can be expected above 24900 on a 15 Min candle close towards gap filling area. In case index closes below 24590 in 15 Min TF then index will head towards 24290.
In case of a big gap up/down, wait till 10 o'clock and mark the high and low of the trading range (5MIN). Trade on this range breakout.
==========
I am Not SEBI Registered
This is my personal analysis for my personal trading. Kindly consult your financial advisor before taking any actions based on this.

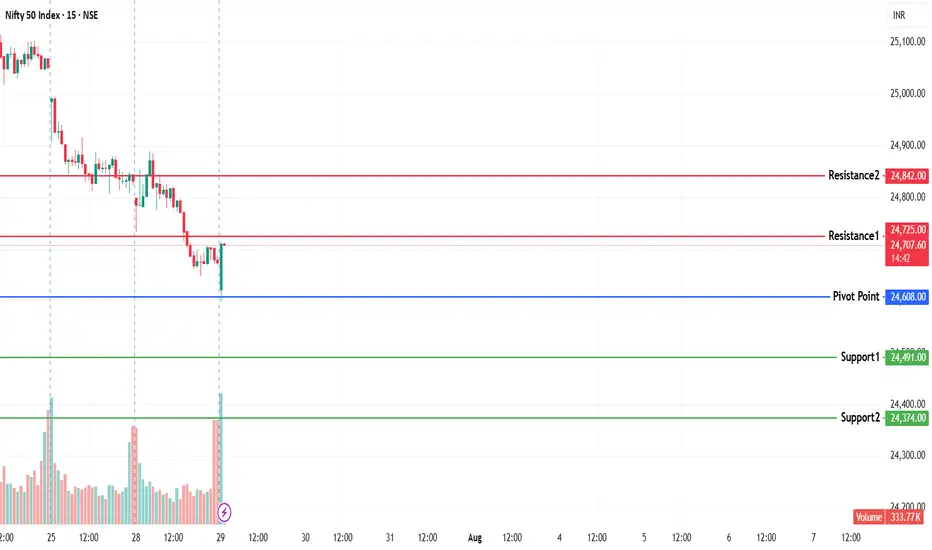
NIFTY KEY LEVELS FOR 29.07.2025NIFTY KEY LEVELS FOR 29.07.2025
If the candle stays above the pivot point, it is considered a bullish bias; if it remains below, it indicates a bearish bias. Price may reverse near Resistance 1 or Support 1. If it moves further, the next potential reversal zone is near Resistance 2 or Support 2. If these levels are also broken, we can expect the trend.
If the range(R2-S2) is narrow, the market may become volatile or trend strongly. If the range is wide, the market is more likely to remain sideways
📢 Disclaimer
I am not a SEBI-registered financial adviser.
The information, views, and ideas shared here are purely for educational and informational purposes only. They are not intended as investment advice or a recommendation to buy, sell, or hold any financial instruments.
Please consult with your SEBI-registered financial advisor before making any trading or investment decisions.
Trading and investing in the stock market involves risk, and you should do your own research and analysis. You are solely responsible for any decisions made based on this research.
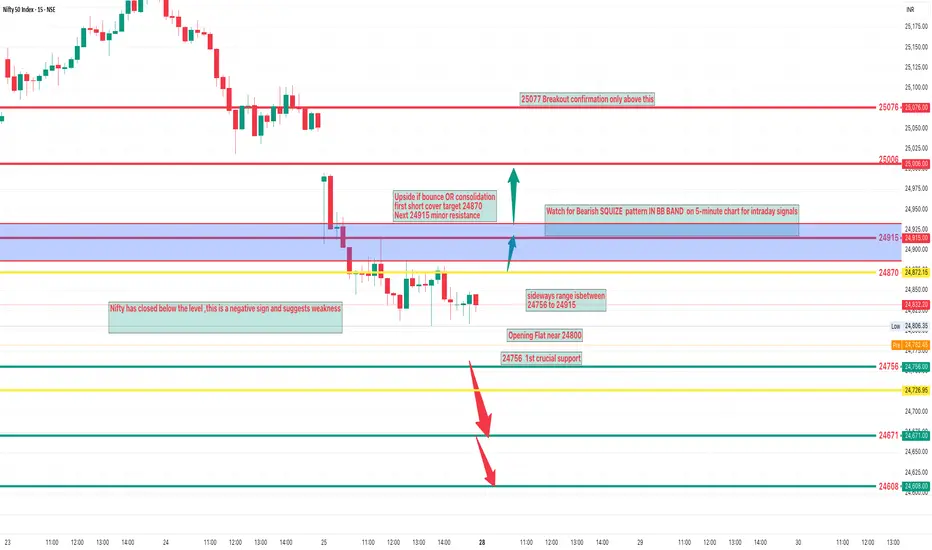
NIFTY KEY LEVELS FOR 28.07.2025NIFTY KEY LEVELS FOR 28.07.2025
If the candle stays above the pivot point, it is considered a bullish bias; if it remains below, it indicates a bearish bias. Price may reverse near Resistance 1 or Support 1. If it moves further, the next potential reversal zone is near Resistance 2 or Support 2. If these levels are also broken, we can expect the trend.
If the range is narrow, the market may become volatile or trend strongly. If the range is wide, the market is more likely to remain sideways
📢 Disclaimer
I am not a SEBI-registered financial adviser.
The information, views, and ideas shared here are purely for educational and informational purposes only. They are not intended as investment advice or a recommendation to buy, sell, or hold any financial instruments.
Please consult with your SEBI-registered financial advisor before making any trading or investment decisions.
Trading and investing in the stock market involves risk, and you should do your own research and analysis. You are solely responsible for any decisions made based on this research.

NIFTY Analysis – 28 july 2025 ,Morning update at 9 amExpected Opening & Movement Zones
Likely Opening Flat near 24800.
Immediate Downside Target (if weak)
First: 24756 important support.
Then: 246721– next support.
Upside if bounce or consolidation
First short-cover target: 24870.
Next: 24915 – minor resistance.
24756,Near today's flat open 1st crucial support
24671 If bottleneck confirmed –test this zone
24608 Extended weakness zone
Resistance Levels
24915 Short covering resistance
25,006 Important psychological and swing resistance
25076 Breakout confirmation only above this
the sideways range is likely between
24756 to 24915
Nifty may consolidate in this zone before giving any big move.
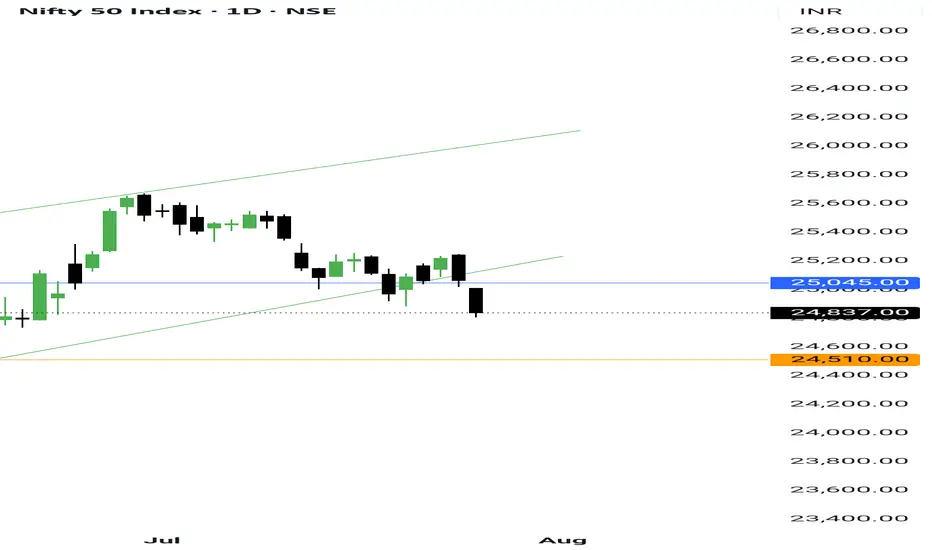
Nifty volatality range expanded - check the levels The market pulled back more than I expected, and now it’s starting to look like a proper correction. But there’s nothing surprising about it — that’s the market’s nature, to surprise you every time.
Nifty has dropped more than 400 points from its recent high this week. On the intraday chart, it closed below the 24839 support on a weekly basis.
With that, Nifty has formed its Decision Range (DR) at 24845 for tomorrow, and the Pivot percentile is 0.19%, which clearly suggests we might see a trending move tomorrow.
Two possible scenarios for tomorrow:
1. If Nifty opens above 24845 and breaks 24908, we might see a bounce due to short covering. However, the probability of this scenario seems low as the market is heavily bearish.
2. If Nifty opens below 24845, trades below it for the first hour, and breaks 24860, it can fall further towards 24710. The final support for this week, as per the chart, should be around 24502. But remember — the market won’t do what you want; it will do what it has to.
Talking about Friday’s session — the candle broke its range, and sellers’ volume was 43 million higher than buyers. Clearly, sellers are still dominating.
For the coming week, the volatility range on the chart is 25047 to 24502.
BankNifty levels:
- Decision Range: 56713
- Weekly Support: 55899
- Resistance: 56791
On the sectoral side, agriculture proxy stocks are showing some excellent setups. One of them, NSE:SHARDACROP , which I traded, gave a solid 19.63% move on Friday.
I am also holding another one from this sector.
And of course, I'm not ignoring my Earnings Pivot setups — because in this kind of market, that’s the only reliable way to generate consistent income.
And when Agri + Earnings Pivot come together — you know how explosive that can be!
That’s all for today.
Take care.
Have a profitable week ahead.
Master Institutional Trading🏛️ Master Institutional Trading
Unlock the secrets of how the smart money dominates the market
Learn to think, plan, and trade like top institutions and hedge funds.
What You’ll Master:
Advanced Market Structure – Breakouts, fakeouts & liquidity grabs
Smart Money Concepts – Accumulation & distribution like a pro
Order Flow & Volume Logic – Follow the real money
Entry & Exit Precision – Based on logic, not guesswork
Institutional Risk Management – Capital protection & scaling
Trader Psychology – Discipline, patience & strategy
No more random trades. No more emotional decisions.
This is structured, high-level trading built for serious traders.
📌 Master the mindset. Read the market. Trade like institutions.

NIFTY Intraday Trade Setup For 28 Jul 2025NIFTY Intraday Trade Setup For 28 Jul 2025
Sell_1- From 24990
Invalid-Above 25040
T- 24800
Bearish-Below 24800
Invalid-Above 24850
T- 24620
NIFTY has closed on a bearish note, ended near lowest point of the week. Index has closed below 50 and 21 EMA both. Its sell on rise market till it is below 50 EMA. Support lies near 24150, 24450 will be a confluence zone in between. Following the sell on rise approach, On Monday 25k zone will be a resistance area to plan a short. On flat opening, below 24800 will be a simple short planning towards 24600 zone.
In case of a big gap up/down, wait till 10 o'clock and mark the high and low of the trading range (5MIN). Trade on this range breakout.
==========
I am Not SEBI Registered
This is my personal analysis for my personal trading. Kindly consult your financial advisor before taking any actions based on this.

Nifty50 Trend Analysis Daily TFNifty 50 is currently in a corrective phase, forming wave 4 on the daily time frame. Given the long-term bullish outlook of the market, wave 4 is expected to be a shallow correction, potentially ending around 24,821 or 24,311. A deep correction down to 23,898 is also possible, but the probability of this is low—around 10%, unless wave 5 becomes trapped in a complex triple-three corrective pattern.
The direction of Nifty 50 is strongly correlated with Reliance Industries' price movement. If Reliance fails to reverse from the ₹1,373 level, it may drop further to ₹1,332. In that case, Nifty 50 is unlikely to regain bullish momentum and may continue to consolidate sideways until Reliance completes its correction.
Key Levels to Watch:
Nifty 50: 24,821 (shallow correction), 24,311 (support), 23,898 (deep correction - low probability)
Reliance Industries: ₹1,373 (key support), ₹1,332 (deep correction level)
A strong bullish rally in the broader market is likely only if Nifty 50 finds support around 24,821 and Reliance reverses from ₹1,373.

NIFTY Analysis – 25 july 2025 ,Morning update at 9 amPre-market Price Expectation
Forecasting an open near 25025 and expected slip to 25007 is helpful for pre-market planning.
Scenario Planning
Bearish Case: Break below 25008 Watch for bottleneck Next target WILL BE 24929
Bullish Case Hold above 25100 Move to 25150–25250
4. Clear Support AND Resistance Levels
Support:
25008
24928
24889
Resistance:
25150
25271
25309

Nifty is preparing for an upcoming event, stance stays bullish So, the market didn’t move as I expected today. My view was sideways to bullish, but the market clearly turned negative.
And that’s the beauty of the market — it has often beaten my 12 years of trading experience and has consistently forced me to learn, adapt, and refine my accuracy.
This is exactly why I love the market — it keeps challenging me, and yet, I’ve managed to stay balanced and continue to grow.
Now, talking about NSE:NIFTY — today’s volatility was completely expected. Remember, I had mentioned that as we move closer to monthly expiry and with earnings season ongoing, volatility will remain high till the end of this month.
For me, Nifty support is at 25000 and resistance at 25150.
The overall chart trend is still bullish, but the market seems to be preparing for some upcoming event — and I’m sure many of you already know what that could be.
Despite the volatility, my portfolio wasn't affected because we I am strictly trading my Earnings Pivot setups.
For example, NSE:SENORES gave a solid 15% move today. But considering market conditions, I booked 80% profit immediately after getting a top-alert.
🎯 In such markets, I will only trade Earnings Pivots.
My recent trades also performed strongly today:
NSE:OLECTRA – 15.45% UP
NSE:FORCEMOT – 11.72% UP
That’s all for today.
Take care.
Have a profitable tomorrow.

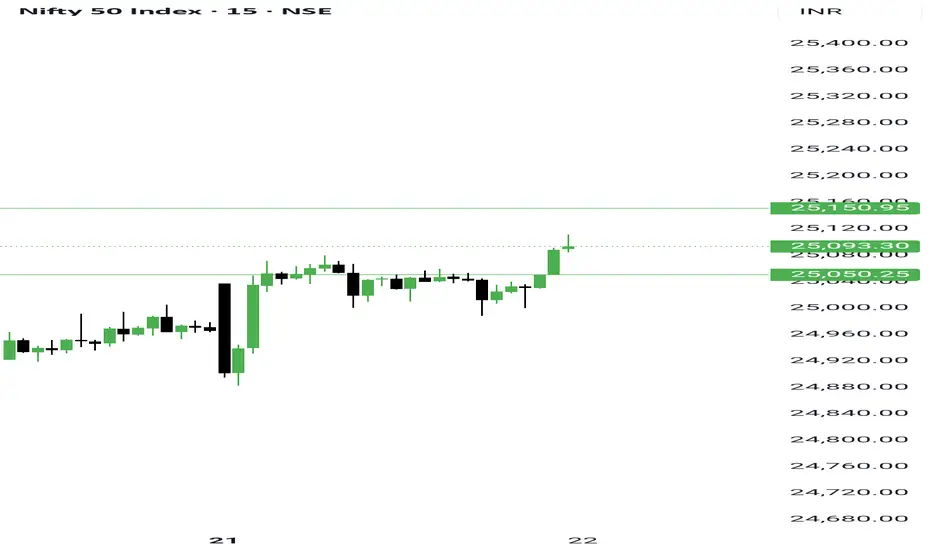
25400 coming soon!!As we can see despite the weak opening, NIFTY showed strong REVERSAL which not only shows good accuracy but also shows sticking to our plan with patience does pay off most of the times. Hence, following the view we should remain long on the position as in smaller TF, it can also be seen that it is forming more like a W pattern which can show good upmove till 25400 so plan your trades accordingly and keep watching everyone.

niftyin nifty tomorrow may be gap up and sideways. we can see a doji candle tomorrow. be cautious on upside.may be a we see reversal from friday.
NIFTY Analysis – 23 july 2025 ,Morning update at 9 amNIFTY Technical Outlook Today
Pre-Market Insight
NIFTY spot closed below 24% false level
Short covering is visible – a bullish sign.
Watch for price behavior around 25150, a crucial level.
Market Scenarios Today
Bullish Possibility (If holds above 25150)
May open near 25150
May rise to 25219, then possibly up to 25298 if a Bottle. ki. neck ki tarah ka pattern forms.
squize pattern is expected today in bb band track this carefully.
Bearish Possibility (If fails to sustain above 25150)
Downside targets:
25014
24896
24807

nifty1. if nifty touch raising channel resistance tomorrow then pattern will change then nifty is sideways to bullish in short-term .
2. if nifty touch resistance on 23 july then only we get perfect entry for short.
note: on 23 july we can see doji candle in daily .if not then wait.
tomorrow nifty is bullish. any day we see a doji candle above 25300. then we can sell on next day or on the same day after 3pm.
if you want to short on top then keep eye on 23 july. on 23 if touch rising channel resistance then we can short.
but,
on 23 nifty is sideways and form a doji candle in daily basis.

NIfty50 analysis for 23/07/2025nifty has been in a bearish trend over the past week and recently faced a strong rejection from the 25180–25200 zone, which aligns with a key resistance level on the daily time frame. price action suggests a possible retracement toward the 24780–24800 support zone. this area holds significance as a potential demand zone. it’s crucial to observe price behavior around this level — a strong reaction here could offer clues for the next directional move. wait for confirmation before taking any fresh positions.
Chart always tells the truth - Nifty and Banknifty The chart always tells the truth.
We studied that NSE:NIFTY would bounce, and it did — what a bounce!
But keep in mind, fear is still present in the market. Traders can sell even on the smallest negative trigger. Today’s move was largely because of short covering.
Today’s Nifty candle is bullish, but buyers’ volume is only 40 million higher than sellers, while on Friday sellers had 43 million more than buyers.
This clearly shows that sellers are still active.
So, a bullish candle + low volume + short covering = likely sideways action tomorrow.
Nifty levels:
- Support: 25050
- Resistance: 25175 — above this, we could see short covering up to 25350
The market remains bullish, and this is the right time to build a list of stocks where character or structure change has happened.
If you can spot such small-cap stocks, you can easily aim for 40-50% upside in next 3-4 months.
Talking about NSE:BANKNIFTY — even after such a big green candle, sellers outnumbered buyers by 7 million in volume. So be cautious while trading here.
BankNifty levels:
- Support: 56770
- Resistance: 57200
Sector-wise, the craze is still around IPOs. Focus on recently listed NSE:NIFTY_IPO stocks (1-2 years old) where character changed in the last rally.
Here’s how my recent picks performed today:
NSE:MASTEK - +7%
NSE:PARADEEP - +7.63%
NSE:JYOTICNC - +5%
NSE:BDL - +2.80%
NSE:LTF - +3.66%
NSE:UPL - +3.92%
NSE:CARRARO - +5.6%
NSE:KPEL - +4.7%
NSE:MMTC - +3.79%
That’s all for today.
Take care.
Have a profitable tomorrow.