NIFTY 50 - ICT & SMC Analysis (April 3, 2025)1. Market Structure & Trend Overview
1D Chart (Higher Timeframe Bias)
Bearish Market Structure: The market has been in a downtrend, breaking market structure (MSS) at key levels. The recent rally from March was a retracement into a premium zone.
Key Resistance Areas:
Order Block (OB) at ~23,600: Market is rejecting this supply zone.
Previous Daily High (PDH) & Premium Liquidity Zone: Price recently swept liquidity above PDH and is rejecting.
Key Support Areas:
Fair Value Gap (FVG) at 22,800-22,900: This is the next area where price may drop to seek liquidity.
PDL (Previous Daily Low): A liquidity pool where price may react.
📌 Prediction:
If price stays below 23,600, the market may seek liquidity at 23,000 or even 22,800.
If price reclaims 23,600, a move towards 24,000 is possible.
4H Chart (Mid-Timeframe Confirmation)
Bearish Market Structure: Price is forming lower highs and recently had a Change of Character (ChoCH) to the downside.
Key Levels to Watch:
23,600 OB & FVG: Market is rejecting this area.
23,200-23,250 (Liquidity Area): Price is building liquidity below.
22,900 (FVG & Key Support): If price breaks down, this will be a magnet.
Strong Resistance at 23,600: If price gets here, it could be a sell opportunity.
📌 Prediction:
A potential short trade if price retraces back to 23,500-23,600 (OB) with targets at 23,200 & 22,900.
If 23,200 holds, a bounce to 23,500 is possible.
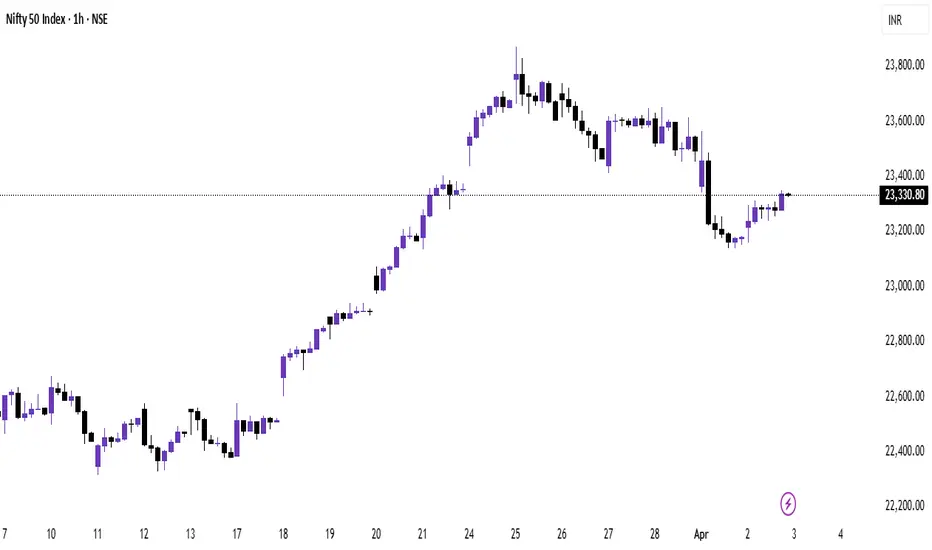
1H Chart (Execution Level)
Price Action Observations:
Liquidity Sweep at PDH: Market took out buy-side liquidity and is now retracing.
FVG Below 23,200: This is a draw on liquidity.
PWL (Previous Week’s Low) at 23,150-23,200: This could act as support before further downside.
📌 Trade Idea (Bearish Setup)
Entry: Sell near 23,500-23,600 (OB & FVG Zone).
Stop Loss: Above 23,650 (Above liquidity zone).
Take Profit Targets:
TP1: 23,200 (First liquidity pool).
TP2: 22,900 (FVG fill & support area).
🔹 Alternative Bullish Scenario: If price does not break 23,200 and forms bullish structure, a long towards 23,600 can be considered.
Niftytrendanalysis
NIFTY : Trading levels and Plan for 01-Apr-2025📌 NIFTY Trading Plan – 01-Apr-2025
📊 Market Overview:
NIFTY closed at 23,179, forming a consolidation base near the Opening Support Zone (23,164 – 23,210). The index has shown sharp volatility in previous sessions, and its next move will depend on how price reacts at key resistance and support levels.
For a disciplined and well-planned approach, let’s analyze all possible opening scenarios and formulate a structured trading plan accordingly.
🔼 Scenario 1: Gap-Up Opening (100+ points above 23,275)
A gap-up above 23,275 suggests bullish momentum, but whether it sustains or reverses will depend on the key resistance zone (23,351 – 23,385).
✅ Plan of Action:
If NIFTY sustains above 23,275, expect a bullish move towards 23,351 → 23,385. If it breaks and holds above 23,385, the rally could extend towards the major resistance at 23,502.
If price faces resistance at 23,351 – 23,385 and starts reversing, expect a pullback toward 23,275 → 23,210. A breakdown below 23,210 could signal further weakness.
Avoid entering long trades directly at 23,351 – 23,385, as this is a potential profit-booking zone. Look for either a clean breakout or a bearish rejection before making a move.
🎯 Pro Tip: If the gap-up starts fading in the first 15-30 minutes, it indicates weak buying pressure, increasing the probability of a sell-off.
⚖ Scenario 2: Flat Opening (Within ±100 points, around 23,179)
A flat opening near 23,179 suggests indecision, where price action will decide the next direction. The critical range to watch is 23,164 – 23,275.
✅ Plan of Action:
Upside case: If NIFTY breaks and sustains above 23,275, it may test 23,351 → 23,385. Monitor price action near these levels before entering fresh longs.
Downside case: If NIFTY breaks below 23,164, it could slide towards 23,067 → 22,907. A breakdown below 22,907 would confirm further downside pressure.
Avoid trading inside the No Trade Zone (23,164 – 23,275), as price might consolidate before a decisive move.
🎯 Pro Tip: In a flat opening, wait for a strong 15-minute candle close above/below key levels before taking any trade.
🔽 Scenario 3: Gap-Down Opening (100+ points below 23,067)
A gap-down below 23,067 could indicate selling pressure, but strong buyers might step in around the 22,907 support zone.
✅ Plan of Action:
If NIFTY sustains below 23,067, expect a decline towards 22,907. A breakdown below 22,907 could extend the fall to 22,800 – 22,750.
If NIFTY finds support at 22,907 and rebounds, expect a recovery towards 23,067 → 23,164. A strong close above 23,164 would signal buyer strength.
Be cautious of bear traps – If the market gaps down but quickly recovers, it could trigger short covering, leading to a sharp upside reversal.
🎯 Pro Tip: If the gap-down occurs near a major support zone, wait for bullish confirmation (e.g., reversal patterns) before going long.
⚠️ Risk Management Tips for Options Traders
🔹 Avoid over-leveraging – Proper position sizing is key to managing risk.
🔹 Theta Decay Awareness – If the market consolidates, option premiums will decay rapidly.
🔹 Use Spreads for Protection – Instead of naked options, use spreads to control risk and improve trade probabilities.
🔹 Trade at Key Levels – Avoid impulsive trades; focus on defined support and resistance zones.
📌 Summary & Conclusion
📍 Key Levels to Watch:
🟥 Resistance: 23,275 → 23,351 → 23,385 → 23,502
🟧 No Trade Zone: 23,164 – 23,275
🟩 Support: 23,067 → 22,907 → 22,800
🔸 Bullish Bias: Above 23,275, targeting 23,351 – 23,502
🔸 Bearish Bias: Below 23,067, expecting a fall towards 22,907 – 22,800
🔸 Neutral/Choppy: Inside 23,164 – 23,275, avoid unnecessary trades
🎯 Final Advice:
Stick to the structured trading plan and execute only at key levels.
Avoid emotional trading—wait for confirmation before entering trades.
The first 15-30 minutes after market open will provide better clarity—observe price action before committing to a trade.
📢 Disclaimer
I am not a SEBI-registered analyst. This trading plan is for educational purposes only. Please conduct your own research or consult a financial advisor before making any trades.

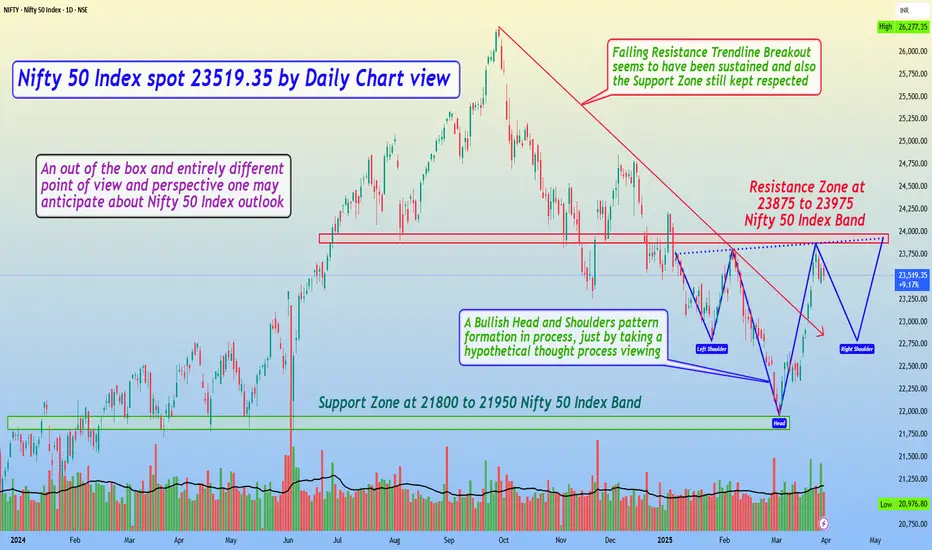
Nifty 50 Index spot 23519.35 by Daily Chart view - Weekly updateNifty 50 Index spot 23519.35 by Daily Chart view - Weekly update
- Support Zone at 21800 to 21950 Nifty 50 Index Band
- Resistance Zone at 23875 to 23975 Nifty 50 Index Band
- Falling Resistance Trendline Breakout seems to have been sustained and also Support Zone still kept respected
- A Bullish Head and Shoulders pattern formation in process, just by taking a hypothetical thought process viewing
- An out of the box and entirely different point of view and perspective one may anticipate about Nifty 50 Index outlook
- Going by this Hypothetical H&S probability for the Nifty 50 Index Chart, we may anticipate good fire crackers to observe
- As such this is just a high level technical chart pattern formation and the Market are always Supreme to work in their own ways
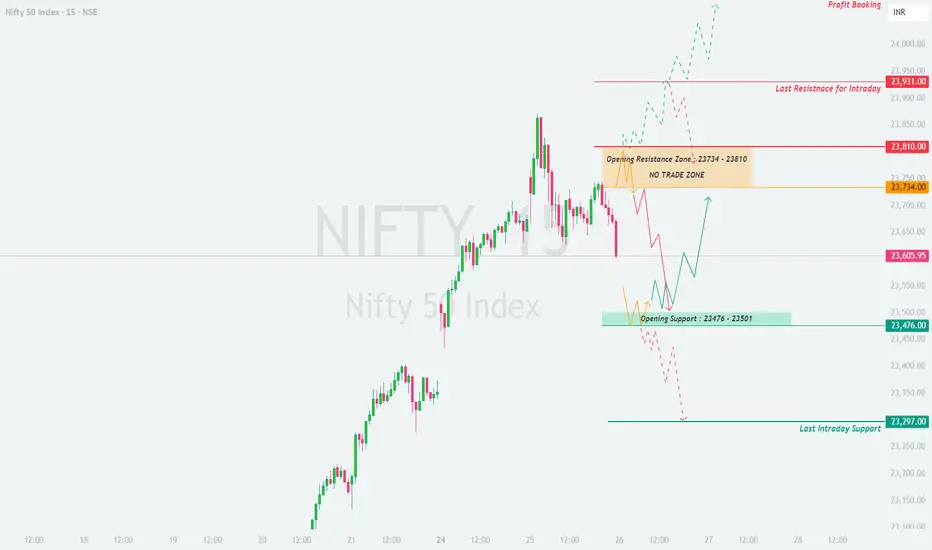
NIFTY : Intraday Trading levels and Plan for 26-Mar-2025
📊 Current Market Status:
NIFTY closed at 23,605.95, showing a decline from recent highs. The price action suggests that the index is at a crucial juncture, with key resistance and support levels defining tomorrow’s possible movement. Let’s analyze the plan for different opening scenarios.
🔼 Scenario 1: Gap-Up Opening (100+ points)
If NIFTY opens above 23,734, it will enter the Opening Resistance Zone (23,734 – 23,810), which is a crucial level for bulls. A sustained breakout above this zone will determine further upside movement.
✅ Plan of Action:
If NIFTY sustains above 23,810, expect a move towards 23,931 (last intraday resistance). A further breakout above 23,931 could take it towards 24,087 (Profit Booking Zone).
If the index rejects 23,810 and starts reversing, look for short opportunities targeting 23,734 → 23,605.
Avoid trading within the No Trade Zone (23,734 – 23,810) unless a clear breakout or breakdown occurs.
🎯 Pro Tip: A strong gap-up near 23,810 might trigger profit booking, so avoid aggressive longs unless momentum is confirmed.
⚖ Scenario 2: Flat Opening (Within ±100 points)
A flat opening around 23,605 means NIFTY is indecisive, requiring confirmation at key levels before entering trades.
✅ Plan of Action:
Upside case: If NIFTY breaks above 23,734, it could retest 23,810, and a breakout above that can push it towards 23,931 – 24,087.
Downside case: If the index breaks below 23,605, expect selling pressure towards the Opening Support Zone (23,476 – 23,501).
Neutral Approach: Avoid trading within the No Trade Zone (23,734 – 23,810) unless a strong breakout occurs.
🎯 Pro Tip: If volatility is low, options traders can use Iron Condors or Straddle Sells for range-bound strategies.
🔽 Scenario 3: Gap-Down Opening (100+ points)
If NIFTY opens below 23,476, bearish sentiment might take control, and we must assess the strength of support zones.
✅ Plan of Action:
If price sustains below 23,476, expect a decline towards 23,297 (Last Intraday Support).
If price takes support at 23,476 – 23,501 and rebounds, a potential pullback entry can be considered, targeting 23,605 – 23,734.
Watch for trap setups—if NIFTY opens low but quickly reverses above 23,476, it could be a bear trap leading to a short squeeze.
🎯 Pro Tip: In a gap-down scenario, avoid panic selling and wait for a breakdown retest before entering trades.
⚠️ Risk Management Tips for Options Traders
🔹 Avoid over-leveraging – Trade within your risk capacity and manage exposure wisely.
🔹 Theta Decay Awareness – Options traders should be mindful of premium decay, especially near expiry.
🔹 Hedge Your Positions – Use spreads instead of naked options to reduce risk.
🔹 Wait for Confirmation – Never enter trades based on emotions; always wait for price action confirmation.
📌 Summary & Conclusion
📍 Key Levels to Watch:
🟥 Resistance: 23,734 → 23,810 → 23,931 → 24,087
🟧 No Trade Zone: 23,734 – 23,810
🟦 Support: 23,476 – 23,501 → 23,297
🔸 Bullish Bias: Above 23,810 for targets of 23,931 – 24,087
🔸 Bearish Bias: Below 23,476 for a move towards 23,297
🔸 Neutral/Range-Bound: If price remains between 23,734 – 23,810
🎯 Final Advice:
Follow levels with discipline.
Avoid overtrading in No Trade Zones.
Let the first 15-30 minutes settle before making aggressive trades.
📢 Disclaimer
I am not a SEBI-registered analyst. This analysis is for educational purposes only. Please do your research or consult with a financial advisor before making trading decisions.
🚀 Stay updated on live trading levels & setups!
NIFTY : Intraday Trading Levels and Plan for 25-Mar-2025📅 NIFTY 50 Trading Plan – 25th March 2025
⏰ Timeframe: 15-min | 📊 Index Spot Reference: 23,674
🔍 Opening Scenario 1: GAP-UP Opening (100+ points)
If NIFTY opens significantly higher and trades above the 23,750 mark:
Keep a close eye on the Opening Resistance Zone between 23,863–23,931 . This area has historically acted as supply pressure, and price may show signs of rejection or pause here. If price action shows exhaustion in this zone (long upper wicks or bearish reversal candles), it can offer a high-probability short opportunity with tight risk. If a 15-min candle sustains and closes above 23,931 , Nifty may continue its bullish momentum towards the next level around 24,089 – marked as the “Last and Strong Resistance for Intraday.” Avoid aggressive buying near resistance. Instead, look for a pullback entry post-breakout with SL below the breakout candle’s low.
🧠 Tip: Don’t chase price. Let it stabilize before entry. In options, use OTM puts to short with defined SL and strict risk reward of at least 1:2.
🔍 Opening Scenario 2: FLAT Opening (±100 points)
If NIFTY opens near Friday’s close (23,651–23,674):
Wait for the first 15–30 mins to settle volatility. The price is currently in the middle of a decision zone. Watch for directional cues near 23,582–23,651 . Holding above this zone with strength can signal a move towards resistance zones mentioned above. If the index breaks below 23,582 , it may test the next demand zone between 23,507–23,491 . For bullish bias, price must sustain above 23,651 with volume and momentum. Look for bullish reversal candles like Hammer or Bullish Engulfing for confirmation.
🧠 Tip: For flat openings, straddles or strangles can be considered in options, but manage the premiums with strict SL, especially if the index remains range-bound.
🔍 Opening Scenario 3: GAP-DOWN Opening (100+ points)
If NIFTY opens around or below 23,500:
Watch 23,507–23,491 zone for any immediate bounce-back reaction. If buyers step in with volume, a quick pullback to 23,582+ is possible. If price slips below 23,491 , then 23,368 becomes the last support for the day. Breakdown below 23,368 could lead to a sharp fall toward lower psychological supports. Reversal trades should only be taken if there’s a bullish candle confirmation near support zones with increasing volume. If Nifty stabilizes and forms a base near 23,368, short-covering rallies can be sharp and tradeable.
🧠 Tip: Use spreads (bear call or bull put) in high volatility gaps. Avoid naked options with aggressive sizing post gap-down as premiums get inflated.
💡 Risk Management Tips for Options Traders:
Always trade with a fixed capital allocation per setup – ideally 2–5% of total capital. Don’t hold losing positions past your defined stop loss – honor SL with discipline. For intraday option trades, use 5-min/15-min candles to trail SL for locking in profits. Avoid holding zero-value options till expiry unless it's part of a hedge. Focus more on setups with favorable risk-reward, not just option premiums.
📌 Summary & Conclusion:
✅ Upside Zones to Watch: 23,863–23,931 (resistance), 24,089 (extension target)
✅ Support Zones: 23,582 → 23,507 → 23,491 → 23,368
✅ Strategy Focus: Wait for clear price action in respective zones; avoid emotional trades on gap days. Respect the market structure and plan trades only with confirmations.
⚠️ Disclaimer: I am not a SEBI-registered analyst. This plan is shared purely for educational and informational purposes. Please consult with your financial advisor before making any trading decisions.

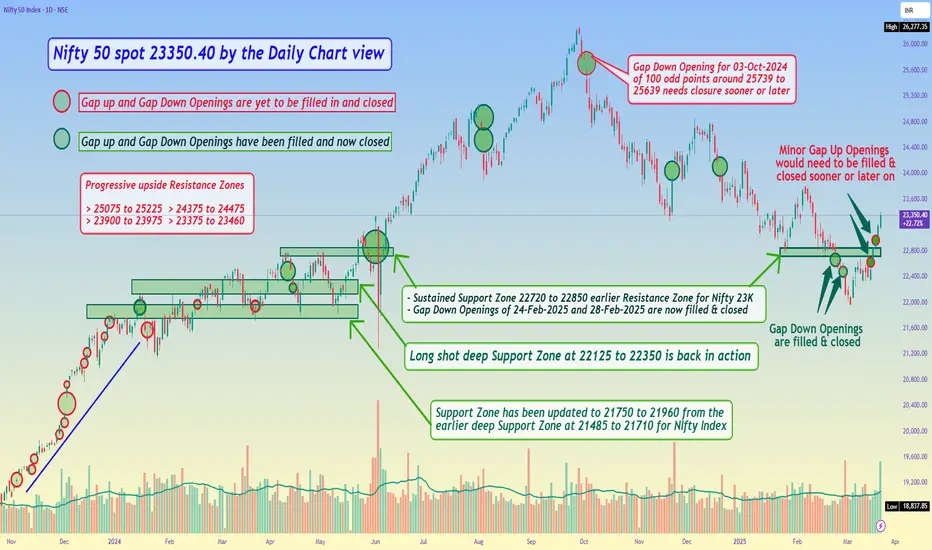
Nifty 50 spot 23350.40 by the Daily Chart view - Weekly updateNifty 50 spot 23350.40 by the Daily Chart view - Weekly update
- Sustained Support Zone 22720 to 22850 earlier Resistance Zone for Nifty 23K
- Minor Gap Up Openings around above Support Zone would need to be filled & closed sooner or later on
- Next set of Resistance Zones seen at indicative Nifty 50 Index levels of 23375 to 23460 and 23900 to 23975
Nifty 50 Daily Timeframe: Will the Downtrend Finally Break?The latest daily timeframe chart of Nifty 50 still shows the index trading within a well-defined descending channel, but it is now at a crucial resistance zone near the upper boundary of the trendline. This zone will determine whether the market is ready for a bullish breakout or if another round of selling pressure will push prices lower.
Key Observations:
1. Downward Channel Still Intact:- The index continues to respect the red trendlines, which have been guiding the downtrend for months.
Nifty 50 is currently testing the upper boundary of the channel, and this is a decisive moment for the market.
2. Resistance Zone Approaching:- 23,100 - 23,200 is acting as an immediate resistance level.
A break and close above this zone with strong volume could confirm a breakout and trigger bullish momentum.
Failure to break out could lead to another rejection, keeping the downtrend intact.
3. Bullish Momentum Strengthening:- The last few daily candles show strong bullish momentum with higher highs and higher lows.
If RSI moves beyond 65-70, it will signal strong buying interest.
Possible Scenarios:
Bullish Breakout Scenario:- If Nifty closes above 23,200 with strong volume, it could rally towards 23,500 - 24,000 in the coming sessions.
A confirmed breakout would invalidate the bearish trend and attract fresh buying interest.
Bearish Rejection Scenario:- If Nifty fails to break out and faces selling pressure, it may once again decline toward 22,750 - 22,500 support levels.
Traders should watch for a bearish rejection candle near the resistance zone, as it could signal another leg downward.
Conclusion:- Nifty 50 is at a make-or-break level, and the next few sessions will decide the trend direction. Traders should wait for confirmation before taking aggressive positions. If a bullish breakout occurs, we could see a trend reversal, but if the resistance holds, the downtrend may continue.
Watch the 23,200 level carefully! A decisive move above or below will dictate the next big move for Nifty 50.

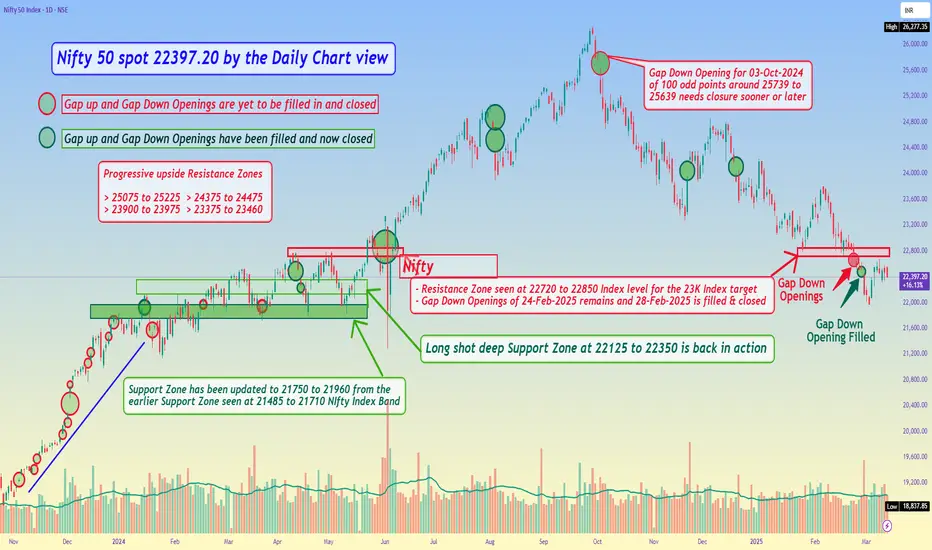
Nifty 50 spot 22397.20 by the Daily Chart view - Weekly updateNifty 50 spot 22397.20 by the Daily Chart view - Weekly update
- Resistance Zone seen at 22720 to 22850 Index level for the 23K Index target
- Gap Down Openings of 24-Feb-2025 remains and 28-Feb-2025 is filled & closed
- Long shot deep inline Support Zone seen at 22125 to 22350 is now back in action
Nifty50 If a hourly candle sustains or Close below white trend line then it could test 22490 -- 22505 within 11th March .
Disclaimer :
It's a personal view not a financial advice and I assume no responsibility and liability whatever outcome arises.

Nifty - Sell on RiseStrong supply area in multiple time frames like Daily / 125 / 75
Also a strong gap area
Expected resistance zone to fall between 22630 - 22730
Upside Sl above 22800
Downside targets 22400 & 22000
Entry with 15/25 min candle confirmation only

NIFTY - Fall is not done yet.Even though current week 500+ points upmove came, NIFTY failed to cross 1 week ago high, which is just 100 points around.
Meantime US policy impact is yet to be seen, as there are negotiations going on.
Due to Indian rupee fall, it may offset some of the tarrif increase - that just devalued indian exports to other countries, while internal inflation taxes every indian indirectly.
Till the white line is crossed, which can happen this week bias should be sell on raise.
I started believing in inside candle formations, as they provide least SL, and prefer 15 mins, 1hr or 4hr charts to make decision, while ensuring position sizing.
So, still sell on raise.

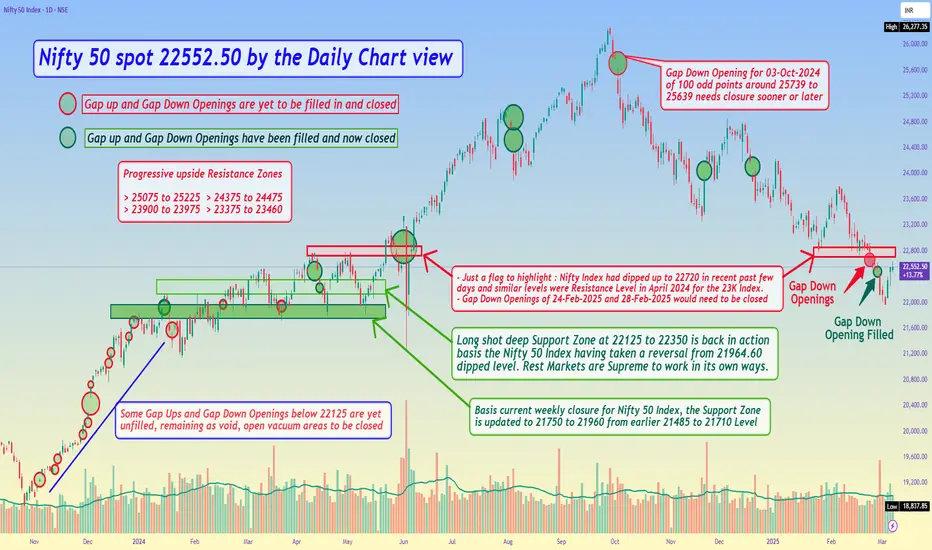
Nifty 50 spot 22552.50 by the Daily Chart view - Weekly Update*Nifty 50 spot 22552.50 by the Daily Chart view - Weekly Update*
- Gap Down Opening of 28th February, 2025 is now filled and has been closed
- Basis current weekly closure for Nifty 50 Index, the Support Zone is updated to 21750 to 21960 from earlier 21485 to 21710 Level
- Long shot deep Support Zone at 22125 to 22350 is back in action basis the Nifty 50 Index having taken a reversal from 21964.60 dipped level.
- Rest Markets are Supreme and work in their own ways. We can at most anticipate, expect and look forward for the best to happen by our assumptions
Nifty 50 upcoming expiry OTM options writing play.so Nifty succesfully has formed two harmonics pattern.
1. 5-0 pattern which typically pesents a bullish view.
2. Cypher pattern which presents a bearish view in a short term.
according to this, one must have to close their CE writing positions at 22180 or 22105.15 and start writing the PE options of 22150 strike or whichever they are comfortable in it. whoever had left their chance in writing it.
if someone is comfortable in futures, than with a tight hedge one can go long at these points.
our stoploss should be below recent low of 21964.60
target 22582 or nearby it.

Nifty Trading Strategyy for 03rd March 2025📈 Nifty Trade Setup 📉
💰 Entry Strategy:
🔼 Buy Above: The high of the 1-hour candle that closes above 22,250
🎯 Targets: 22,316 | 22,395 | 22,473
🔽 Sell Below: The low of the 15-minute candle that closes below 22,100
🎯 Targets: 22,029 | 21,934 | 21,855
📊 Trade Explanation:
Why wait for a candle close?
A 1-hour candle closing above 22,250 confirms bullish strength, filtering out false breakouts.
A 15-minute candle closing below 22,100 provides an early signal of bearish momentum.
Advantages of this approach:
Reduces false breakouts and whipsaws.
Aligns with price action confirmation, increasing trade accuracy.
Works well with additional indicators like RSI, MACD, Moving Averages, or Volume Analysis for extra confirmation.
⚠️ Disclaimer:
I am not a SEBI-registered analyst or advisor. The information provided here is for educational and informational purposes only and should not be considered as financial or investment advice. Trading in the stock market involves significant risk, and there is no guarantee of profit. You are solely responsible for your trading decisions, and it is strongly recommended to conduct your own research or consult a SEBI-registered financial professional before making any trading or investment decisions. Past performance is not indicative of future results.

Nifty 50 Index 22124.70 by Daily Chart view: Different ViewpointNifty 50 Index 22124.70 by the Daily Chart view - Different Viewpoint
A different point of view for the Nifty 50 Index Technical Chart Setup Analysis. This is solely and purely my personal perspective for the Bearish Head & Shoulders pattern's. I will be happy to welcome and get your fine line pointers for the improvement on the Technical Analysis for this Chart Setup. Thank you in advance to One and All.
The 1st H&S Bottom is broken down and now need to look forward, if ..... Nifty 50 Index touches the 2nd H&S Bottom or takes an early reversal ..... Hope for the best to happen and keeping fingers crossed. God Bless All.

Nifty 50 spot 22124.70 by the Daily Chart viewJust sharing an update in continuation over the last week Nifty 50 Index chart data reading.
Nifty 50 spot 22124.70 by the Daily Chart view
- Next Support Zone at 21485 to 21710 Level
- Gap Down Openings of 24-Feb-2025 and 28-Feb-2025 would need to be closed

Nifty 50 spot 22795.90 by the Daily Chart viewNifty 50 spot 22795.90 by the Daily Chart view
- Nifty 50 Index 22775 to 22950 Support Band is yet sustained
- Long shot deep Support Zone seen at 22125 to 22350 which for now seems bit (un)likely by current technical chart status setup
- Just a flag to highlight : Nifty Index had dipped up to 22720 in recent past few days and similar levels was Resistance Level in April 2024 for 23K Index target
- Few of the Gap Ups and Gap Down openings, yet are remaining to get closed and filled in below the Old Long Shot Support Zone at 22125 to 22350 for Nifty Index levels

NIFTY50 - A RETRACEMENT IS EXPECTED BEFORE FURTHER FALLSymbol - Nifty50
CMP - 23772
The Nifty50 continues to trade within a falling channel pattern, indicating a bearish technical structure. Currently, the index is testing key support levels near 22800-22700, which were identified as critical support zones in the previous analysis. Given the strong & key support area at these levels, there is a high likelihood of a short-term bounce before the continuation of the downtrend.
As of now, Nifty is encountering support around the 22800-22700 region, and I expect a potential retracement towards the 23170-23200 and 23420 levels before the downtrend continues. These levels are supported by the retracement nature of the fall, providing a good opportunity to enter long positions with favorable risk-reward at current price.
When Nifty was around 23720, I shared my short trade plan on Nifty, anticipating a 700-1000 point fall, with expectations for Nifty to test the 23000 and 22800 areas again. That fall has now played out, and we successfully captured a strong down move. As Nifty is trading at key support levels once again, I am anticipating a bounce from here before the downtrend resumes.
Given the current technical setup, long positions can be initiated around current prices, with additional positions being added towards the 22680-22650 area. A stop-loss should be placed below 22600. I expect a retracement of this fall, which could push Nifty to the 23170-23200 range and then 23420 levels.
The risk-reward at these levels is favorable for long positions. However, my overall outlook remains bearish, and I expect the downtrend to continue after Nifty touches the 23400 zone.
Key resistance levels remain around 23700-23850. Any sustained move above this range could signal a shift from a downtrend to a sideways or even bullish trend. Until then, the preferred strategy will be to sell at resistance zones and buy at key support levels for a retracement.
Disclaimer - Do not consider this as a buy/sell recommendation. I'm sharing my analysis & my trading position. You can track it for educational purposes. Thanks!

Key Levels: Nifty at a Crucial Turning Point! What's Next? Nifty's price structure is showing a clear pattern of lower highs and lower lows, indicating a prevailing downtrend. However, the market is now at an interesting Demand Zone that could determine its next big move.
📊 Key Observations
On January 27, Nifty took support from an old demand zone, and formed new lower high.
This minor reversal also led to the creation of a new demand zone.
Currently, Nifty is approaching this fresh Demand zone & old Demand Zone, making it a highly significant area to watch.
🔍 Possible Scenarios Ahead
Reversal from the Demand Zone : If Nifty respects this demand zones and reverses, we may see a potential bottom forming.
Sideways Consolidation : Nifty may move sideways, indicating indecision before a breakout.
Breakdown Below Demand Zone : If the demand zone is breached, Nifty could make a new lower low, continuing its downward trend.
🔄 What’s Next?
The next few sessions will be crucial in determining whether Nifty finds strength or continues its downward trajectory. Traders should closely monitor price action and key levels to gauge market sentiment.
Lastly, thank you for your support, your likes & comments. Feel free to ask if you have questions.
🌟 “Patience and discipline separate the successful trader from the rest.”
This analysis is for educational purposes only and is not a trading or investment recommendation. I am not a SEBI-registered analyst.

Nifty 50 Index spot 22929.25 by Monthly Chart viewNifty 50 Index spot 22929.25 by Monthly Chart view
- Nifty 50 Index trending along the Rising Support Trendline 4th time over since March 2020.
- Support point starting March 2020, next in March 2023 followed in Nov 2023 and now in Feb 2025.
- *What can we anticipate and can we hope for some upside reversal from here ????*

Nifty’s Eight-Day Slump: Is a Reversal Brewing at 22,800?● Last week proved to be a challenging period for the Nifty, as the index experienced a sharp decline of over 2.5%, extending its losing streak to eight consecutive trading sessions.
● A key support level to watch is at 22,800, which could act as a crucial floor for the index.
● This level gains further significance as Open Interest (OI) data reveals a substantial buildup of put writers at the 22,800 strike price, reinforcing the potential support zone.
● Market participants will closely monitor whether the index manages to hold above this level or breaches it in the coming sessions.
● Adding to the intrigue, a bullish RSI divergence has emerged, hinting at the possibility of a trend reversal in the near term.

Nifty 50 spot 22929.25 by the Daily Chart viewNifty 50 spot 22929.25 by the Daily Chart view
- Just an FYI to note, for the current status of the Nifty 50 Index Daily Closure
- Nifty 50 Index 22775 to 22950 Support Band is yet sustained and nothing more to quote

Nifty 50 spot 22985.25 by the Daily Chart viewNifty 50 spot 22985.25 by the Daily Chart view
- Sustained Support Zone for Nifty 50 Index 22775 to 22950 levels
- Will the Support Zone pass the 2nd retest after 1st test done on 27-January-2025
- Let's hope for the best to happen and look forward to see how things unfold going ahead
