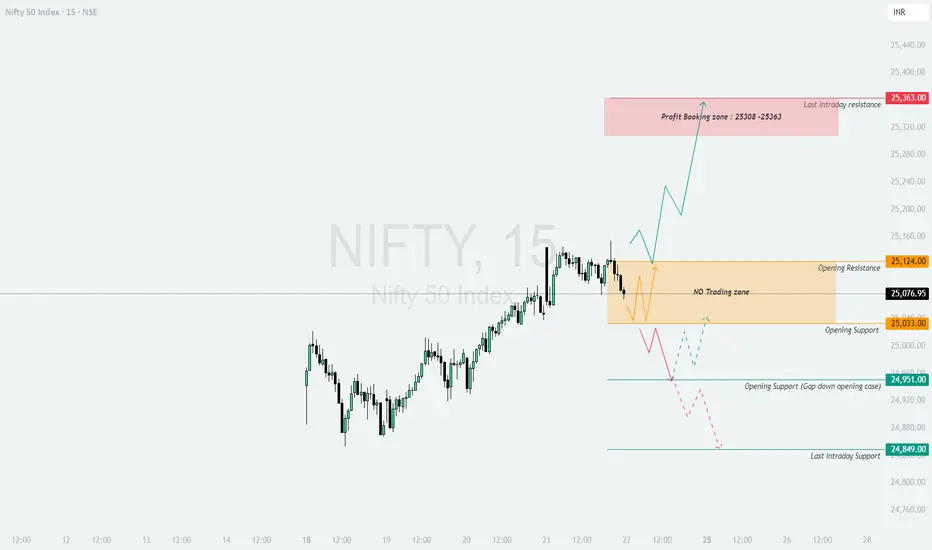
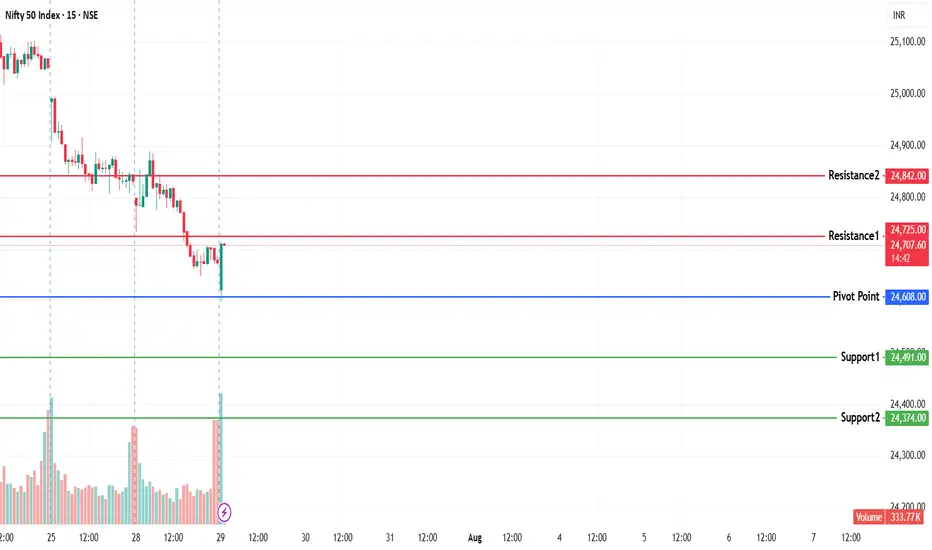
NIFTY : Trading levels and plan for 22_Aug-2025📌 Nifty Trading Plan for 22-Aug-2025
Key Levels from Chart:
Opening Resistance → 25,124
Opening Support → 25,033
Profit Booking Zone (Last Intraday Resistance) → 25,308 – 25,363
Opening Support in Gap Down Case → 24,951
Last Intraday Support → 24,849
Previous Close → 25,076.95
🚀 Scenario 1: Gap Up Opening (100+ points above previous close)
If Nifty opens above 25,175+, bullish sentiment will dominate the early session.
Immediate hurdle is 25,308 – 25,363 (Profit Booking Zone). Traders should expect selling pressure here as short-term players may book gains.
Sustaining above 25,363 can extend momentum further, but risk-reward weakens for fresh longs.
If rejection happens from 25,308–25,363, index could retest 25,124 support.
💡 Plan of Action : Look for long trades above 25,124 with confirmation, targeting 25,308–25,363. Trail stop-loss below 25,033. Book partials at resistance and avoid fresh longs if market looks tired near highs.
📊 Scenario 2: Flat Opening (within ±50–80 points of 25,077)
Flat openings often cause range-bound moves until a breakout.
Price between 25,033 – 25,124 is a No Trading Zone . Avoid entering inside this range to prevent whipsaws.
Breakout above 25,124 can trigger a rally toward 25,308 – 25,363 zone.
Breakdown below 25,033 opens weakness toward 24,951.
💡 Plan of Action : Stay patient. Go long only above 25,124 or short below 25,033. Inside range, avoid overtrading and save capital for directional clarity.
⚠️ Scenario 3: Gap Down Opening (100+ points below previous close)
If Nifty opens near 24,950 or below, sellers will dominate.
Support at 24,951 may attract intraday buying or short-covering bounce toward 25,033.
If 24,951 breaks decisively, expect further downside toward 24,849 (Last Intraday Support).
Failure to sustain below 24,951 can trap shorts, leading to a recovery back to 25,124 resistance zone.
💡 Plan of Action : Go short only if 24,951 breaks with volume, keeping stop-loss above 25,033. For scalpers, a bounce from 24,951 can be used for quick longs with strict SL.
📌 Risk Management Tips for Options Traders 💡
Never chase option premiums after a big gap — premiums are inflated, wait for retracements.
Stick to defined-risk strategies (spreads, butterflies) instead of naked buying.
Always use stop-loss on options since time decay works against buyers.
Avoid over-leveraging — allocate not more than 2–3% capital per trade.
Book partial profits near key levels 🎯 and trail the rest.
📝 Summary & Conclusion
Above 25,124, momentum can extend toward 25,308 – 25,363, where profit booking is expected 🚀.
Between 25,033 – 25,124, market is in a No Trading Zone ⚖️. Avoid traps.
Below 25,033, weakness toward 24,951, and if broken → 24,849 ⚠️.
👉 The day will be highly level-driven, and patience is key. Trade only at breakouts/breakdowns for clear setups.
⚠️ Disclaimer
I am not a SEBI registered analyst. This analysis is purely for educational purposes . Please consult your financial advisor before making any trading or investment decision.
Niftytrendanalysis
14 Aug 2025 - Change of stance on Nifty at 24500 levelsNifty Stance Bullish 🐂
Nifty changed its stance from bearish to bullish on 12th August, Tuesday. If you are following me on Trading view, you would have got the email once this EMA crossover happened. Interestingly, Nifty made this reversal after a decent trend of 473 points.
Even though the reversal came, Nifty is still unable to break out from the resistance level of 24620. We are still hovering around 40 points away from the last crossover signal at 24580.
US markets, which are hitting a new high every day, compare this to our markets, which are tired and lacking momentum. We might need fresh triggers to escape from these levels and the US-India trade deal could be a big reason.
A possible trigger could be either a monetary policy relaxation (reduction of repo rates) or a fiscal policy relaxation (decrease in taxes) to boost production/consumption. We cannot reduce our repo rates, as the current 5.5% rate is only 1% higher than the US Fed rate of 4.5%. If we reduce our repo further, our debt and money market will crash, which points us to the only option of a tax cut.

August 13, 2025 trading plan prediction for tomorrow24,728 –
Above: 10m closing → Short Cover Zone.
Below: 10m hold PE → Safe Zone for Puts.
24,628 –
Above: 10m hold CE → Entry Level for Calls.
Below: 10m hold PE → Risky Zone for Puts.
24,528 –
Above: Positive trade bias.
Below: Negative trade bias.
24,428 –
Above Opening S1: 10m hold CE → Bullish bias.
Below Opening R1: 10m hold PE → Bearish bias.
24,330 –
Above: 10m hold CE → Buy Level for Calls.
Below: 10m hold PE → Sell Level for Puts.
24,210 –
Above: 10m hold CE → Safe Zone for Calls.
Below: 10m hold → Unwinding Level.
24,173 –
Day UP Fibonacci Support 0.382.

12 August 2025 Nifty50 brekout and Breakdown leval1. Bullish Trade Plan (Call Side – CE)
Above 24,818 →
Strong upside breakout. Expect short covering rally; positional traders may hold CE.
Above 24,718 →
CE entry zone for swing/positional buying. Targets can be 24,818+ with trailing SL below 24,650.
Above 24,650 →
Market bias turns positive; intraday momentum likely to stay bullish. Can scalp CE with strict SL.
Above 24,432 (Opening S1) →
CE buy zone for intraday. Use for quick trades if supported by volume.
Above 24,350 →
CE buy trigger; minor bullish push possible. Keep SL just below level.
Above 24,220 →
CE safe zone; market sentiment remains positive unless price falls back below.
2. Bearish Trade Plan (Put Side – PE)
Below 24,818 →
First sign of weakness if rejection happens here; safe PE zone starts.
Below 24,718 →
Risky PE zone; may lead to quick downside movement if selling pressure builds.
Below 24,600 →
Intraday negative trade view; bears get control.
Below 24,400 (Opening R1) →
PE buy trigger for intraday shorts.
Below 24,330 →
Clear downside intraday setup; scalpers can enter PE with SL above level.
Below 24,200 →
Safe zone for PE; trend likely to continue down.
Below 24,170 →
Unwinding zone; fall may accelerate quickly to next supports.

12 August 2025 Nifty50 brekout and Breakdown leval
📊 Key Levels & Trade View
24,690 –
Above 10m close: Short Cover Level (CE bullish momentum)
Below 10m: Hold PE in safe zone.
24,523 –
Above 10m: CE buy (entry level)
Below 10m: PE hold (risky zone).
24,423 –
Above 10m: Positive trade view.
Below 10m: Negative trade view.
24,310 –
Above Opening S1: Hold CE.
Below Opening R1: Hold PE.
24,173 (Fib 0.382 Support) –
Watch for reversal or breakdown.
24,110 –
Above 10m: CE buy level.
Below 10m: PE buy level.
23,990 –
Above 10m: CE safe zone level.
Below 10m: Unwinding zone (bearish).
23,711 (Fib 0.5 Support) –
Strong support; breakdown could extend selling.
💡 Trading Bias for Today
Bullish above 24,423 with targets 24,523 → 24,690.
Bearish below 24,310 with targets 24,173 → 24,110 → 23,990.
Avoid trading in between 24,310–24,423 unless there’s strong momentum

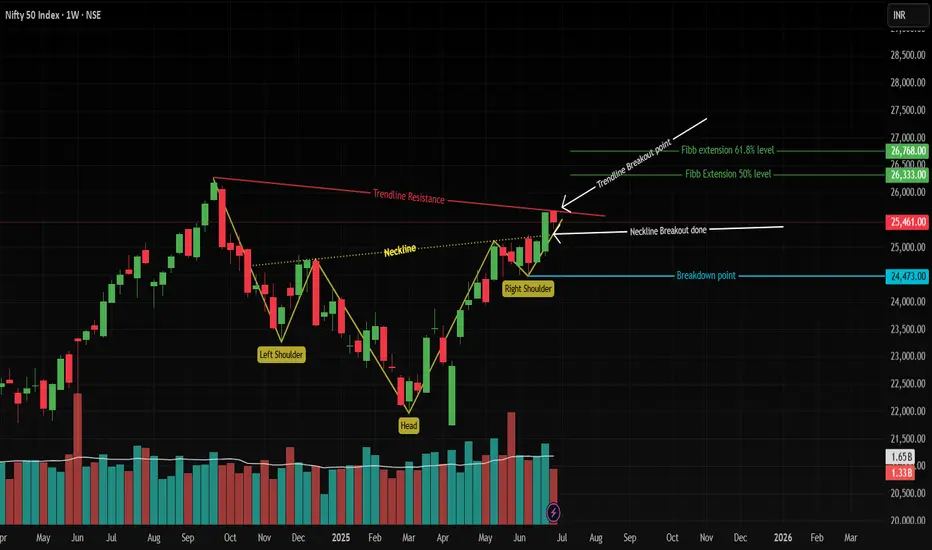
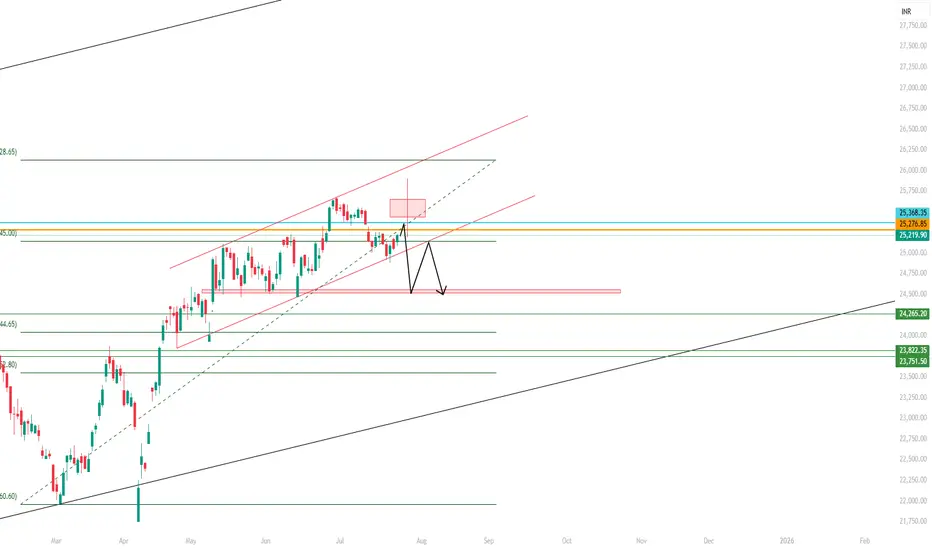
Nifty 50 Weekly: Inverted H&S Breakout Confirmation Awaited!Pattern & Breakout:
Inverted Head & Shoulders formed on the weekly chart (bullish reversal pattern). ✅
Neckline breakout occurred last week, but confirmation pending! This week failed to close above breakout level.
Confluence Alert: Weekly close above breakout level = Trendline resistance (red) breakout! 🚀
Targets (If Confirmed):
50% Fib extension: 26,333 📈
61.8% Fib extension: 26,768 🎯
(Fib drawn from 3rd March 2025 swing)
Key Invalidation:
Right Shoulder Low: 24,473 (blue line). Break below = pattern failed! ⚠️
Action Plan:
Wait for weekly close ABOVE neckline breakout.
Enter longs on confirmation (targets: 26,333 → 26,768).
Stop loss: Below 24,473.
Disclaimer:
This analysis is for educational purposes only. Trade at your own risk. Past performance isn’t indicative of future results. Always conduct your own research or consult a financial advisor. 📉💰
Boost visibility: 👍 Like | 💬 Comment | 🔔 Follow
Nifty Bullish Confluence Set up ( Swing+ positional)Hello,
Nifty spot 24610 from low of 21780 made high around 25650 april to june in 2 months now Its retrace to 24600 i.e almost more than 50% retracement another is RSI squezze with bullish divergence in lowertimeframe with EMA 200 support and making pattern of falling wedge .
expecting bullish reversal set up for new lifetime high possibilties in next 2 months
NIFTY Analysis 5 AUGUEST, 2025 ,Morning update at 9 amProfit booking and consolidation in a narrow range
Technical Pattern Indicates weakness above resistance and price struggling to break higher levels
Observe whether Nifty closed below or above the derived my levels
Today Nifty is below my true level which signals possible sideways or downward movement unless reclaimed
Expected Price Action Today
Flat Opening Expected Around 24700
Range for the Day 24657 to 24751 (consolidation zone)
Upside Trigger: If Nifty breaks above and holds 24751 especially with bb pattern in the 5 minute chart the next target could be 24862
Downside Trigger If Nifty breaks and stays below 24657 it may fall to 24577
Support 24657 ,24577 , 24500
Resistance 24784 ,24862 , 24951
if you have any problem too undestanding my levels or in trading msg me.
5th August 2025 trade plan prediction🔼 Bullish Triggers
✅ Above 24,790 = Hold CE by positive trade view
✅ Above 24,920 = Strong bullish breakout (Entry zone for CE)
✅ Above 25,028 = Shot Cover Level → Upside acceleration likely
CE (Call Option) Strategy:
Buy CE above 24,790 for 24,920 / 25,000 targets
Add CE above 25,028 for quick upside move
🔽 Bearish Triggers
🔻 Below 24,700 = Slightly negative bias starts
🔻 Below 24,670 = Below Opening R1 → PE can be bought cautiously
🔻 Below 24,533 = Risk zone → Hold PE by level
🔻 Below 24,433 = UNWINDING zone → Strong bearish momentum
🔻 Below 25,000 = Safe Zone for PE if reversal happens from higher levels
PE (Put Option) Strategy:
Buy PE if breaks 24,670 for 24,533 / 24,433 targets
Add below 24,423 for deeper downside move

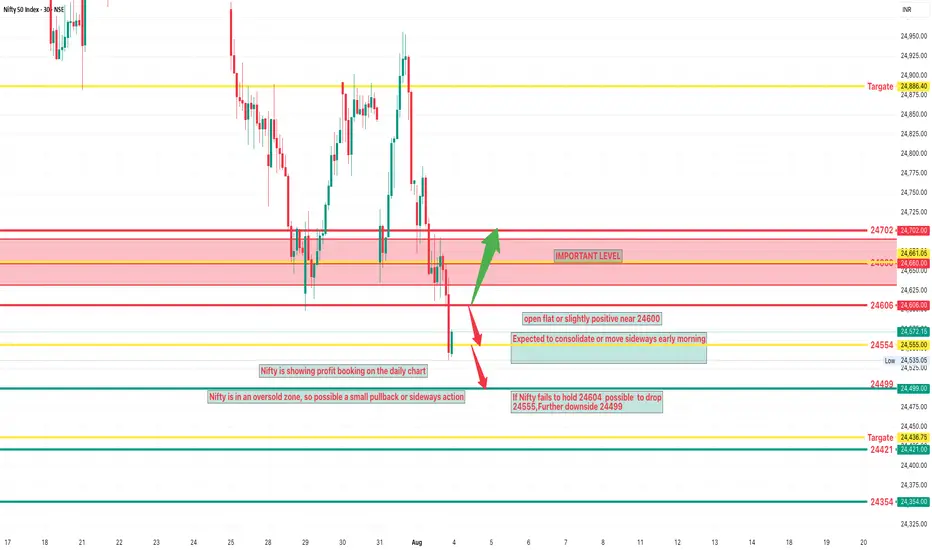
NIFTY Analysis 4 AUGUEST, 2025 ,Morning update at 9 amHowever, Nifty is in an oversold zone, so a small pullback or sideways action is likely.
Opening Expectation:
Likely to open flat or slightly positive near 24600.
Expected to consolidate or move sideways early in the day.
Bullish Scenario:
If a bb pattern forms around 24600 on the 5-min chart expect an upward move.
Potential targets: 24662 and 24702.
Bearish Scenario:
If Nifty fails to hold 24604 likely to drop:
First target: 24554
Further downside: 24499
Key Support & Resistance Levels (Unique & Precise):
Type Levels
Support 24,499 , 24421 ,24354
Resistance 24606 , 24660 , 24702
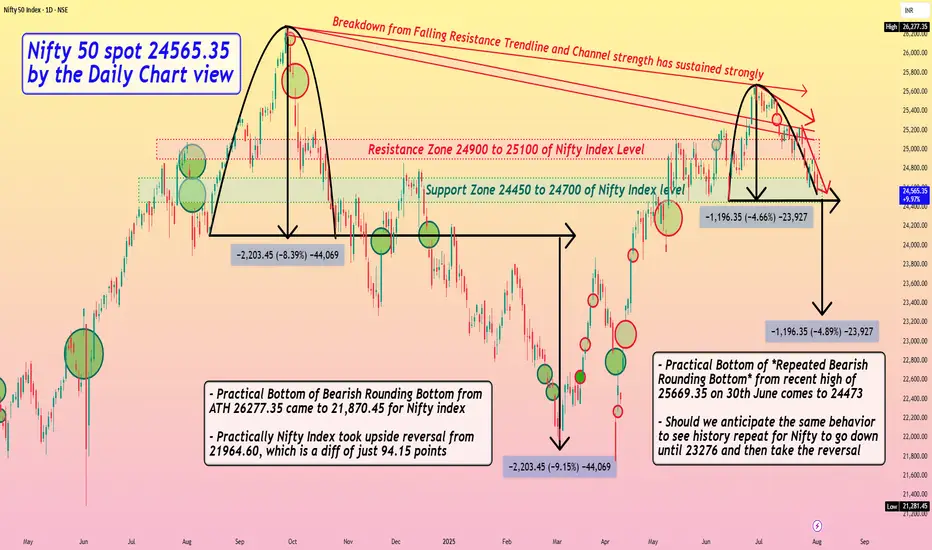
Nifty 50 spot 24565.35 by the Daily Chart view - Weekly update*Nifty 50 spot 24565.35 by the Daily Chart view - Weekly update*
- Resistance Zone 24900 to 25100 of Nifty Index Level
- Support Zone 24450 to 24700 of Nifty Index level still seen sustained
- Bearish Rounding Bottom after ATH level seen repeated at current week closure
- Practical Bottom of *Bearish Rounding Bottom* from ATH 26277.35 came to 21,870.45 for Nifty index
- Practically Nifty 50 Index later took an upside reversal from 21964.60, which is a diff of just 94.15 points
- Practical Bottom of *Repeated Bearish Rounding Bottom* from recent high of 25669.35 on 30th June comes to 24473
- Should we anticipate the same behavior to see history repeat for Nifty to go down until 23276 and then take the reversal
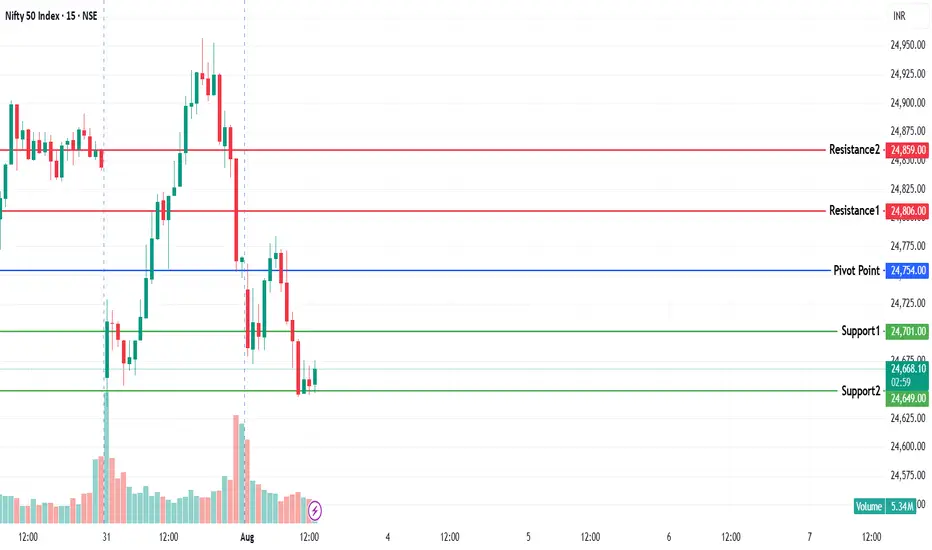
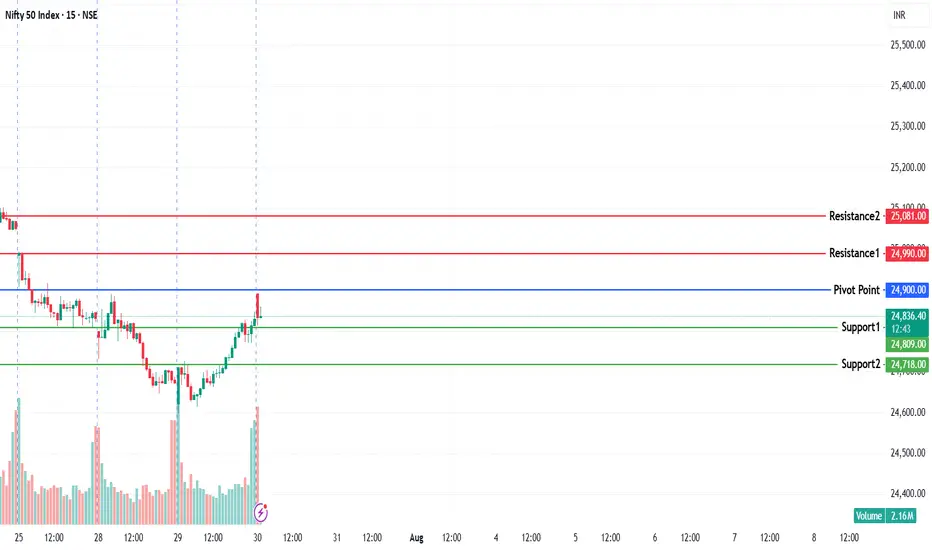
NIFTY KEY LEVELS FOR 01.08.2025NIFTY KEY LEVELS FOR 01.08.2025
If the candle stays above the pivot point, it is considered a bullish bias; if it remains below, it indicates a bearish bias. Price may reverse near Resistance 1 or Support 1. If it moves further, the next potential reversal zone is near Resistance 2 or Support 2. If these levels are also broken, we can expect the trend.
If the range(R2-S2) is narrow, the market may become volatile or trend strongly. If the range is wide, the market is more likely to remain sideways
📢 Disclaimer
I am not a SEBI-registered financial adviser.
The information, views, and ideas shared here are purely for educational and informational purposes only. They are not intended as investment advice or a recommendation to buy, sell, or hold any financial instruments.
Please consult with your SEBI-registered financial advisor before making any trading or investment decisions.
Trading and investing in the stock market involves risk, and you should do your own research and analysis. You are solely responsible for any decisions made based on this research.
Nifty 50 Analysis and Market AnalysisIn this video, we have discussed -
What is the current structure of Nifty 50?
Smaller swing formations can lead to smaller correction.
Significance of current candles.
If the market continues to fall, then we can get Dow top.
People should not jump into trading just by seeing the green candles.

NIFTY KEY LEVELS FOR 30.07.2025NIFTY KEY LEVELS FOR 30.07.2025
If the candle stays above the pivot point, it is considered a bullish bias; if it remains below, it indicates a bearish bias. Price may reverse near Resistance 1 or Support 1. If it moves further, the next potential reversal zone is near Resistance 2 or Support 2. If these levels are also broken, we can expect the trend.
If the range(R2-S2) is narrow, the market may become volatile or trend strongly. If the range is wide, the market is more likely to remain sideways
📢 Disclaimer
I am not a SEBI-registered financial adviser.
The information, views, and ideas shared here are purely for educational and informational purposes only. They are not intended as investment advice or a recommendation to buy, sell, or hold any financial instruments.
Please consult with your SEBI-registered financial advisor before making any trading or investment decisions.
Trading and investing in the stock market involves risk, and you should do your own research and analysis. You are solely responsible for any decisions made based on this research.
NIFTY KEY LEVELS FOR 29.07.2025NIFTY KEY LEVELS FOR 29.07.2025
If the candle stays above the pivot point, it is considered a bullish bias; if it remains below, it indicates a bearish bias. Price may reverse near Resistance 1 or Support 1. If it moves further, the next potential reversal zone is near Resistance 2 or Support 2. If these levels are also broken, we can expect the trend.
If the range(R2-S2) is narrow, the market may become volatile or trend strongly. If the range is wide, the market is more likely to remain sideways
📢 Disclaimer
I am not a SEBI-registered financial adviser.
The information, views, and ideas shared here are purely for educational and informational purposes only. They are not intended as investment advice or a recommendation to buy, sell, or hold any financial instruments.
Please consult with your SEBI-registered financial advisor before making any trading or investment decisions.
Trading and investing in the stock market involves risk, and you should do your own research and analysis. You are solely responsible for any decisions made based on this research.
NIFTY KEY LEVELS FOR 28.07.2025NIFTY KEY LEVELS FOR 28.07.2025
If the candle stays above the pivot point, it is considered a bullish bias; if it remains below, it indicates a bearish bias. Price may reverse near Resistance 1 or Support 1. If it moves further, the next potential reversal zone is near Resistance 2 or Support 2. If these levels are also broken, we can expect the trend.
If the range is narrow, the market may become volatile or trend strongly. If the range is wide, the market is more likely to remain sideways
📢 Disclaimer
I am not a SEBI-registered financial adviser.
The information, views, and ideas shared here are purely for educational and informational purposes only. They are not intended as investment advice or a recommendation to buy, sell, or hold any financial instruments.
Please consult with your SEBI-registered financial advisor before making any trading or investment decisions.
Trading and investing in the stock market involves risk, and you should do your own research and analysis. You are solely responsible for any decisions made based on this research.

Learn Advanced Institutional Trading🎓 Learn Advanced Institutional Trading
Advanced Institutional Trading is the high-level skill of trading financial markets the way professional institutions do — using big data, smart tools, and strategic decision-making to consistently win in the market. 💼📊
Learning this means going beyond basic charts or trendlines. It’s about understanding how big money moves, and how to:
🧠 Read institutional order flow
📉 Trade with algorithms and dark pools
📈 Use volume, liquidity zones & smart money indicators
🛡️ Apply institutional-level risk management
⚙️ Trade options, futures, and other derivatives at scale
💬 Interpret economic data like banks and funds do
You’ll learn to:
Identify entry and exit points based on institutional footprints
Use macro and micro market analysis
Build a trading system with logic and consistency
React to live news, earnings, and global events the way hedge funds do
📌 In simple words:
Learning Advanced Institutional Trading gives you the mindset, tools, and strategies used by the top 1% of traders — so you can trade smart, calculated, and professional just like the big players.

niftyin nifty tomorrow may be gap up and sideways. we can see a doji candle tomorrow. be cautious on upside.may be a we see reversal from friday.
NIFTY KEY LEVELS FOR 23.07.2025NIFTY KEY LEVELS FOR 23.07.2025
If the candle stays above the pivot point, it is considered a bullish bias; if it remains below, it indicates a bearish bias. Price may reverse near Resistance 1 or Support 1. If it moves further, the next potential reversal zone is near Resistance 2 or Support 2. If these levels are also broken, we can expect the trend.
If the range is narrow, the market may become volatile or trend strongly. If the range is wide, the market is more likely to remain sideways
📢 Disclaimer
I am not a SEBI-registered financial adviser.
The information, views, and ideas shared here are purely for educational and informational purposes only. They are not intended as investment advice or a recommendation to buy, sell, or hold any financial instruments.
Please consult with your SEBI-registered financial advisor before making any trading or investment decisions.
Trading and investing in the stock market involves risk, and you should do your own research and analysis. You are solely responsible for any decisions made based on this research.
nifty1. if nifty touch raising channel resistance tomorrow then pattern will change then nifty is sideways to bullish in short-term .
2. if nifty touch resistance on 23 july then only we get perfect entry for short.
note: on 23 july we can see doji candle in daily .if not then wait.
tomorrow nifty is bullish. any day we see a doji candle above 25300. then we can sell on next day or on the same day after 3pm.
if you want to short on top then keep eye on 23 july. on 23 if touch rising channel resistance then we can short.
but,
on 23 nifty is sideways and form a doji candle in daily basis.

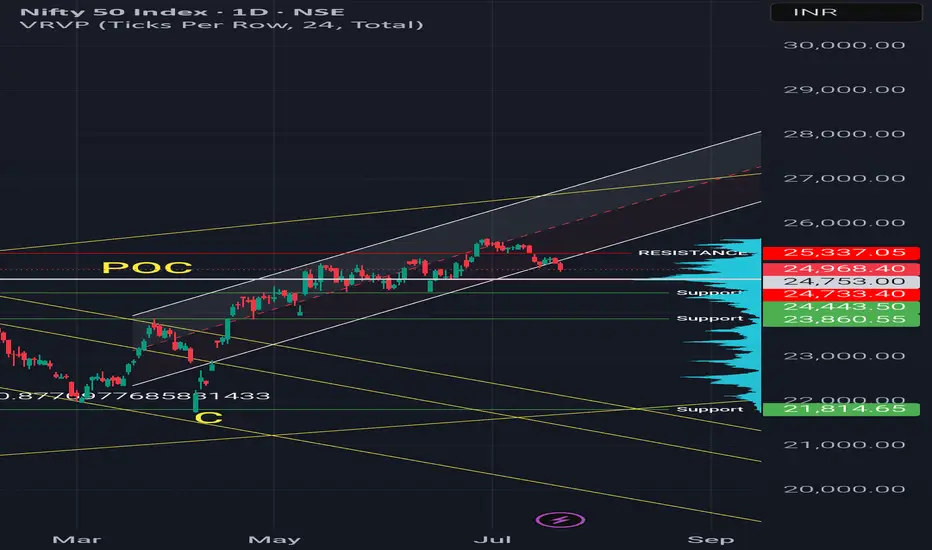
Regression channel breakout - Short term Shift1. Price is out of regression channel — signaling short-term weakness.
2. POC around 24,750 — That is most traded level.
Option Chain Data:
Call writing at 25,300 & 25,500 — clear resistance
But
Yesterday we got positive earnings of ICICI & HDFC Bank.
There is a expectation of pullback as long as nifty is above 24450, long term view is positive
renderwithme | Nifty 50 July 21-25, 2025 TechnicalFor the week of July 21-25, 2025, the Nifty 50 is expected to trade in a range-bound manner with a slightly bearish bias, influenced by mixed global cues, ongoing Q1 earnings, and macroeconomic data. Key support lies at 24,800-25,000, with resistance at 25,300-25,500. Traders should monitor sectoral performance, FII/DII activity, and global trade developments for potential market shifts.

Monday Trade Plan (Nifty 50) 🔼 Bullish Levels (Call Side Entry):
Above 25,008
🔹 Hold CE (Call) — Positive trade view.
Above 25,118
🔹 Hold CE by Entry Level
🚨 Below this: Risky Zone for PE (Put)
Above 25,218
🔹 10 min Closing Short Cover Level
✅ Strong momentum expected above this zone
🔽 Bearish Levels (Put Side Entry):
Below 25,000
🔻 Hold PE — Negative trade view.
Below 24,888
🔻 Opening R1 10m — Hold PE by level
Below 24,788
🔻 Hold PE by level
Below 24,688
🔻 Hold PE by Safe Zone level
Below 24,600 (Approx)
🧯 UNWINDING ZONE
🔻 Strong downward momentum expected
⚠️ Mid-Zone / Risk Areas:
Between 25,000 – 25,008: No clear direction
Between 25,088 – 25,118: Risky Zone for PE
Between 24,788 – 24,888: Rangebound area, watch for breakout
