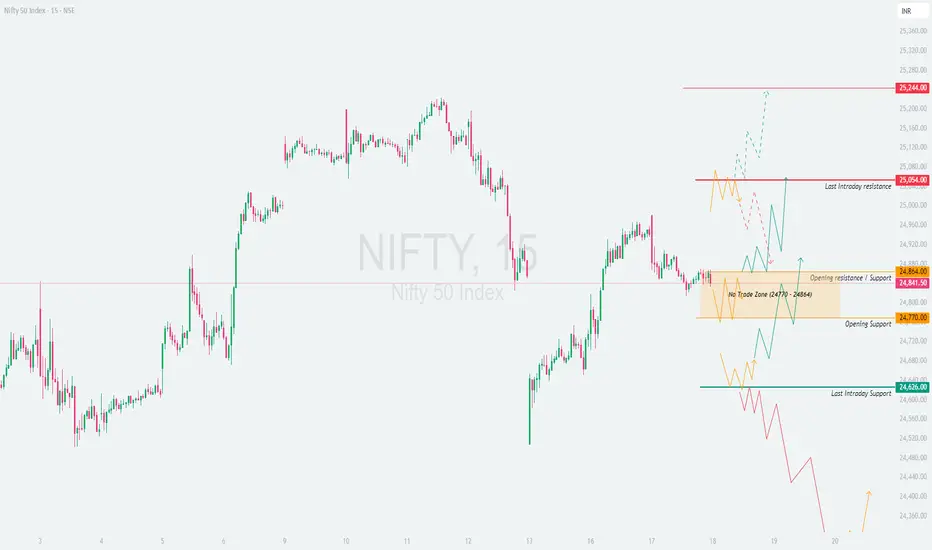
NIFTY : Trading levels for 18-Jun-2025📘 NIFTY TRADING PLAN – 18-Jun-2025
🕒 Chart Timeframe: 15-min | 📍 Previous Close: 24,841.50
📏 Gap Opening Threshold: 100+ points
🔼 GAP-UP OPENING (Above 24,964):
If NIFTY opens above the No Trade Zone (24,864) by more than 100 points, the price will likely test the upper resistance zone near 25,054 (Last Intraday Resistance) .
✅ Plan of Action:
• Avoid chasing right at open. Observe the first 15–30 mins for confirmation above 25,054.
• Sustainable move above 25,054: Look for long trades toward 25,244, with SL below 25,000.
• Rejection at 25,054 zone: Consider short trades only if there’s a clear reversal pattern, targeting back toward 24,864.
• Book profits partially near 25,150 if long, as market may consolidate.
📘 Educational Tip: Sharp gap-ups often face profit booking at resistance zones. Focus on confirmation via strong candles + volume to avoid false moves.
⚖️ FLAT OPENING (Between 24,770 – 24,864):
Flat open near the No Trade Zone (24,770 – 24,864) suggests indecision or potential sideways movement early in the session.
✅ Plan of Action:
• No Trade inside this band until clear breakout or breakdown is seen.
• Break above 24,864: Consider intraday longs toward 25,054, SL below 24,820.
• Break below 24,770: Enter shorts targeting 24,626, with SL above 24,800.
• Avoid trading between 24,770–24,864 during consolidation — it’s where stop losses typically get hit from both sides.
📘 Educational Tip: Trading in the No Trade Zone is like catching a coin toss — instead, let market pick a direction, then follow it with clarity .
🔽 GAP-DOWN OPENING (Below 24,670):
A gap-down below 24,770, especially near or under the Last Intraday Support – 24,626 , brings into play the Buyer’s Support Zone (24,253 – 24,320) .
✅ Plan of Action:
• If opening is near 24,626 and shows breakdown below, ride shorts till 24,420 – 24,320.
• Look for potential reversal setups inside 24,253–24,320 zone for long trades.
• Reclaiming 24,626 with bullish candles could invite short-covering.
• Avoid new shorts inside Buyer’s Zone unless breakdown below 24,253 happens with volume and structure.
📘 Educational Tip: Gaps near support zones give best long risk/reward, but never buy blindly — wait for confirmation candle + sustained buying interest .
🛡 OPTIONS TRADING RISK MANAGEMENT TIPS:
✅ 1. Wait 15–30 mins post-open to avoid false breakouts or reversal traps.
✅ 2. Avoid over-leveraging on gap days — increase accuracy, reduce lot size.
✅ 3. Prefer spreads (Bull Call/Bear Put) if volatility is high to control premium erosion.
✅ 4. Use SL on candle close basis (preferably 15-min), not just trigger wicks.
✅ 5. Exit intraday trades 10–15 mins before close if targets aren't hit to avoid time decay spikes.
📊 SUMMARY – KEY LEVELS TO WATCH:
• 🟢 Bullish Setup:
– Above 24,864 → Target: 25,054 → 25,244
– SL: Below 24,820 (on longs)
• 🔴 Bearish Setup:
– Below 24,770 → Target: 24,626 → 24,320
– Breakdown SL: Above 24,800
• 🟧 No Trade Zone: 24,770 – 24,864 — Let direction confirm
• 🟩 Support Zones: 24,626 / 24,320 / 24,253
• 🟥 Resistance Zones: 25,054 / 25,244
📌 Decision Point: Breakout above 24,864 or below 24,770 decides momentum.
⏱ Watch the first 15-min candle structure for decisive moves.
📢 DISCLAIMER: I am not a SEBI-registered analyst. This trading plan is purely for educational and learning purposes. Please consult your financial advisor before taking any trading or investment decision.
Niftytrendanalysis
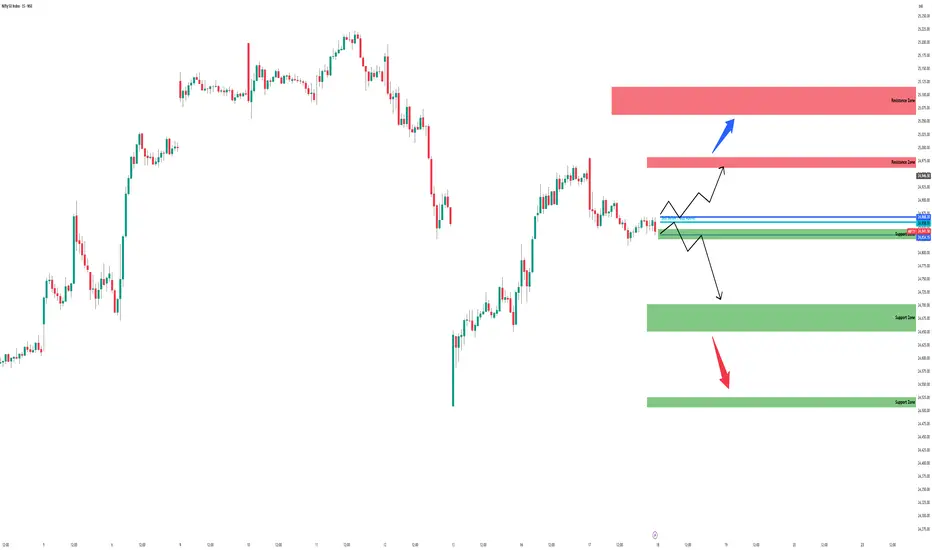
Nifty - Intraday levels & Prediction for - 18 Jun 2025Nifty Prediction for Tomorrow:
Trend : BEARISH Breakout
Sentiment : Negative
Expectation : Nifty closed below 24900, expecting BEARISH breakout tomorrow. Any close above 2510 only its Bullish trend, and price will move to test 25200.
Look for Buy/Sell at Demand and Supply zone for profitable trades.
Demand and Supply Zones - When price breaks the zone, Demand zone will become Resistance and Supply zone will become Support. If Nifty Sustains above 24900 tomorrow we can see good rally upto 25080 Resistance. Any breakout above 25100 and next resistance 25200
Refer the chart for detailed Intraday Support and Resistance levels.
Nifty chart for 17th june 2025Looks like Nifty is in a range. Also, it took support on 24500 level.
Disclaimer: All information provided here is for educational purposes and not a recommendation, advice, research report, or stock tip of any nature. Analysis Posted here is just our view/personal study method on the stocks, commodities or other instruments and assets.
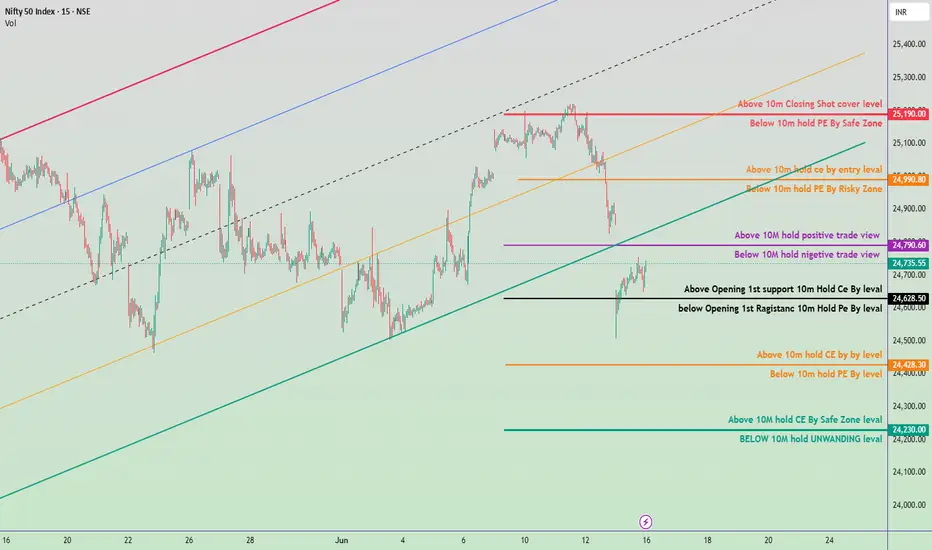
17 june Nifty50 brekout and Breakdown leval✅ Bullish Bias Above:
25,230 – Above 10m closing = Short Cover Zone
25,090 – Above 10m = CE Hold by Entry Level
24,990 – Above 10m = Positive Trade View
24,822 – Above Opening S1 = CE Hold Level
24,680 – Above 10m = CE Hold Level
24,530 – Above 10m = CE Safe Zone Level
⚠️ Neutral Zone:
24,990 ↔ 24,940 – Borderline area for trend confirmation.
Above 24,990 = bullish
Below 24,940 = start of negative bias
❌ Bearish Bias Below:
24,940.95 – Below 10m = Negative Trade View
24,822 – Below Opening R1 = PE Hold Level
24,680 – Below 10m = PE Hold Level
24,530 – Below 10m = Unwinding Level

nifty analysismay be nifty will positive in this month from monday. nifty next target is ATH. after that i aspecting a fake breakout . then nifty will fall upto 24100- 24000 levels . we see 24000 levels in the month of september.

14 june nifty50 breakout & breakdown levals🔍 NIFTY 50 LEVELS & TARGET PREDICTION (As per chart)
✅ Bullish Zones & CE (Call) Entry
24,230.00 – Safe Zone Buy for CE
Above this level, initiate CE buys for a safer trade.
📈 Target 1: 24,428.30
📈 Target 2: 24,790.60 Hold CE above each level, step by step.
24,428.30 – CE Buy Confirmation
Confirms momentum. Add to CE or trail SL.
📈 Target: 24,628.50
24,628.50 – Strong Support (1st Opening Support)
Major breakout level. If reclaimed and held:
📈 Target: 24,790.60 Above this, hold CE confidently.
24,990.80 – Entry-Level for Higher Bullish CE
If market holds above this, aggressive CE positions OK.
📈 Final Target: 25,190.00 (Closing Shot Cover)
❌ Bearish Zones & PE (Put) Entry
Below 24,230.00 – UNWINDING Zone
Strong negative zone; ideal for PE entry.
📉 Target 1: 24,100 (projected, not shown but logical)
📉 SL: 24,230 re-entry
Below 24,428.30 – Weakness Confirmed
Continue holding PE. Breakdown builds here.
📉 Target: 24,230.00
24,628.50 – 1st Opening Resistance
Below this, bias is negative.
📉 Target: 24,428.30
Below this = PE Hold, Avoid CE
Below 24,990.80 – Risky Zone for PE
Intraday negative cues. Short on rallies only if rejection seen.
🟪 Neutral Zone (No Trade / Wait for Confirmation)
24,735 (Current Price) is between 24,628. and 24,790
Wait for a breakout above 24,790 to go long.
Wait for a breakdown below 24,628 to go short.
Nifty Inverted Head and Shoulder Bullidh Breakout possibleNifty has confirmed an Inverted Head and Shoulder breakout around 22,650, indicating a strong bullish momentum. This classic reversal pattern suggests that buyers are gaining control, and further upside movement is expected.
Trade Setup:
Entry: Above 22,650
Stop Loss: 22,350 (below the right shoulder)
Target: 22,950 (measured move projection)
Technical Analysis:
The neckline breakout with good volume confirms bullish strength.
RSI is showing positive divergence, supporting the uptrend.
If Nifty sustains above the breakout level, we may witness further upward momentum.
Risk Management:
Always follow proper risk-reward management.
Keep position sizing appropriate to your risk appetite.
Avoid over-leveraging.
Disclaimer: This analysis is for educational and informational purposes only and should not be considered financial advice. Trading in the stock market involves risk. Please do your own research and consult a SEBI-registered financial advisor before making any investment decisions.

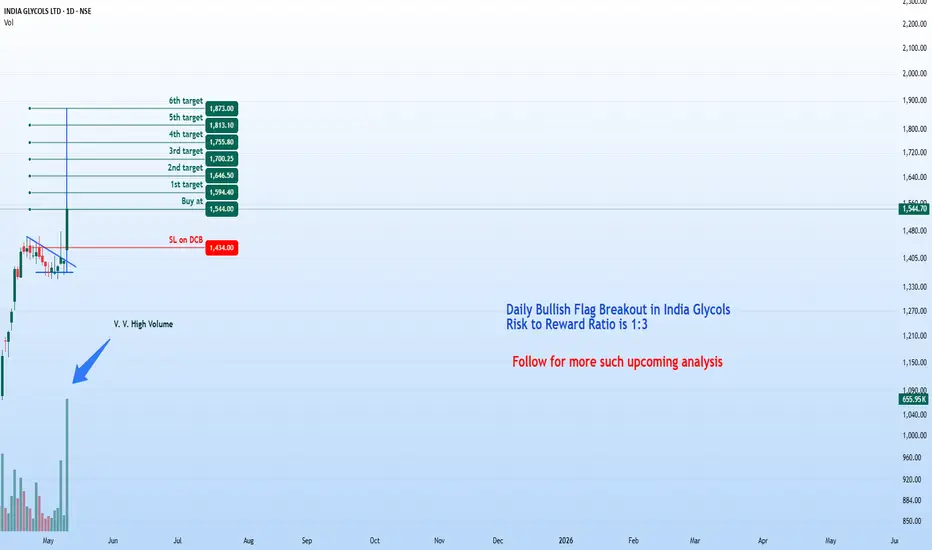
India Glycol Ltd – Bullish Breakout Setup (Daily Timeframe)Stock: India Glycol Ltd ( NSE:INDIAGLYCO )
Trend: Bullish Momentum 🚀 | Risk-Reward: 1:3
Trade Parameters
🎯 Entry: ₹1,544 (Breakout Confirmation)
🛑 Stop Loss: ₹1,434 (Daily Closing Basis | ~7.1% Risk)
🎯 Targets:
₹1,594.40
₹1,646.50
₹1,700.25
₹1,755.80
₹1,813.10
₹1,873.00 (Final Target)
Technical Rationale
✅ Bullish Flag Breakout – Price surged out of consolidation, signaling trend continuation.
✅ RSI Strength – Daily & Weekly RSI >60 (bullish momentum confirmed).
✅ Volume Surge – Breakout volume 656K (vs. previous day’s 75K – 8.7x spike!).
✅ Risk-Reward Advantage – Final target (₹1,873) offers 1:3 reward potential relative to risk.
Key Observations
High-volume breakout suggests institutional/strong hands participation.
Progressive targets allow for partial profit booking.
Stop loss on daily closing basis reduces intraday volatility risks.
Trade Management
Trail SL: Move stop loss to breakeven after Target 1 is hit.
Partial Booking: Secure profits incrementally at each target.
Discipline: Stick to the SL level to avoid emotional trading.
Disclaimer 📢
This analysis is strictly educational and does NOT constitute financial advice. Trading equities carries significant risk, including potential capital loss. Past performance is no guarantee of future results. Always conduct independent research or consult a certified financial advisor before making investment decisions. The author assumes no liability for financial outcomes based on this content.
Thoughts? Are you tracking NSE:INDIAGLYCO for this setup? Comment below!
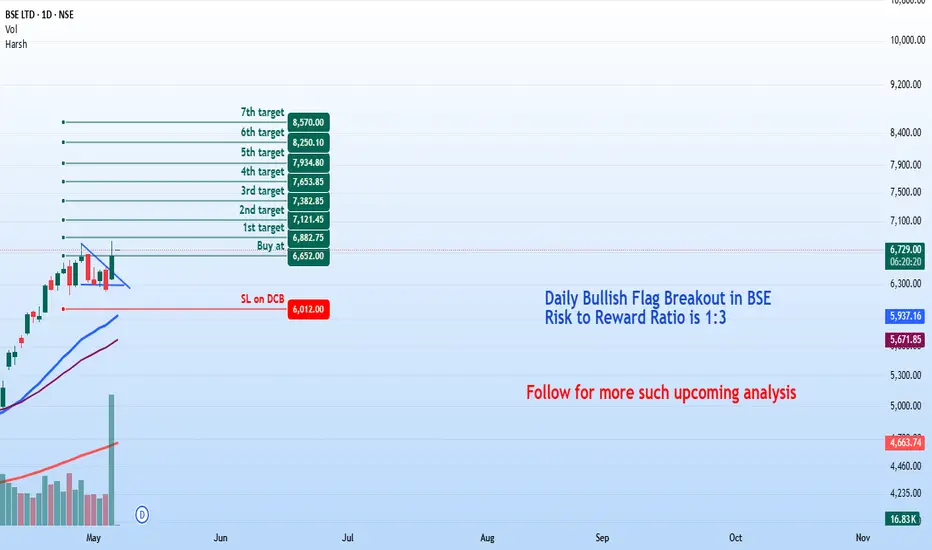
BSE Ltd - Bullish Breakout Setup (Daily Timeframe)Stock: BSE Limited ( NSE:BSE )
Trend: Strong Bullish Momentum 🚀
Risk-Reward Ratio: 1:3 (Favorable)
Trade Parameters
🎯 Entry Zone: ₹6,650 (Breakout Confirmation)
🛑 Stop Loss: ₹6,012 (Daily Closing Basis) (~9.6% Risk)
🎯 Target Levels:
₹6,882.75
₹7,121.45
₹7,382.85
₹7,653.85
₹7,934.80
₹8,250.10
₹8,570 (Final Target)
Technical Justification
✅ Bullish Flag Breakout - Price has broken out from a consolidation pattern, indicating continuation of uptrend
✅ Strong Momentum - Daily & Weekly RSI >60 (Bullish zone)
✅ Volume Confirmation - Breakout volume 10.8M vs previous day's 2.51M (4.3x surge!)
✅ Fundamental Catalyst - Very good quarterly results supporting bullish sentiment
Key Observations
• The breakout comes with exceptionally high volume, validating strength
• Multiple targets allow for progressive profit booking
• Risk-reward ratio of 1:3 makes this an attractive setup
Trade Management Tips
• Consider partial profit booking at each target level
• Move stop loss to breakeven after Target 1 is achieved
• Trail stop loss to protect profits as price progresses
Disclaimer 📢
This analysis is for educational purposes only and does not constitute financial advice. Trading in equities involves substantial risk of loss and is not suitable for every investor. Past performance is not indicative of future results. Always conduct your own research and consider your risk tolerance before making any investment decisions. The author assumes no responsibility for any trading losses that may occur from using this information.
MRF: Inverted Head & Shoulders Breakout |Targets Ahead! MRF has confirmed a breakout from an Inverted Head & Shoulders pattern on the daily chart, signaling a potential bullish trend reversal. The breakout has occurred with strong volumes, adding conviction to the move.
🔍 Trade Setup:
Buy Above: ₹115,579
Stop Loss: ₹111,230 (Closing Basis)
Targets:
🎯 Target 1: ₹118,028
🎯 Target 2: ₹120,443
🎯 Target 3: ₹123,358
🎯 Target 4: ₹126,157
🎯 Target 5: ₹129,019
The pattern structure aligns well with Fibonacci extension levels and previous resistance zones, providing a favorable risk-to-reward ratio.
📌 Chart Highlights:
Breakout above neckline with volume surge
Positive RSI momentum confirming breakout strength
Price sustaining above key moving averages
⚠️ Disclaimer:
I am not a SEBI-registered advisor. This analysis is shared for educational and informational purposes only. Please consult your financial advisor before making any investment or trading decisions. Trade at your own risk.

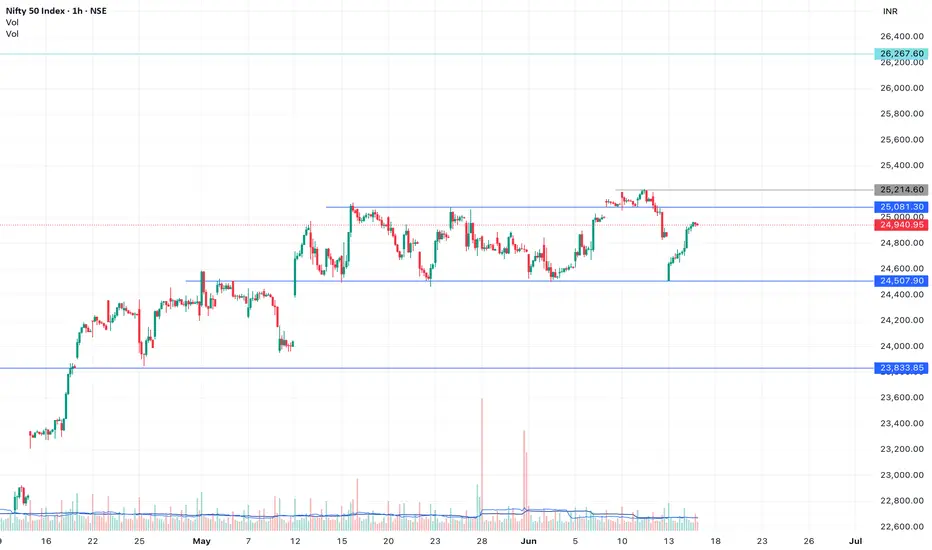
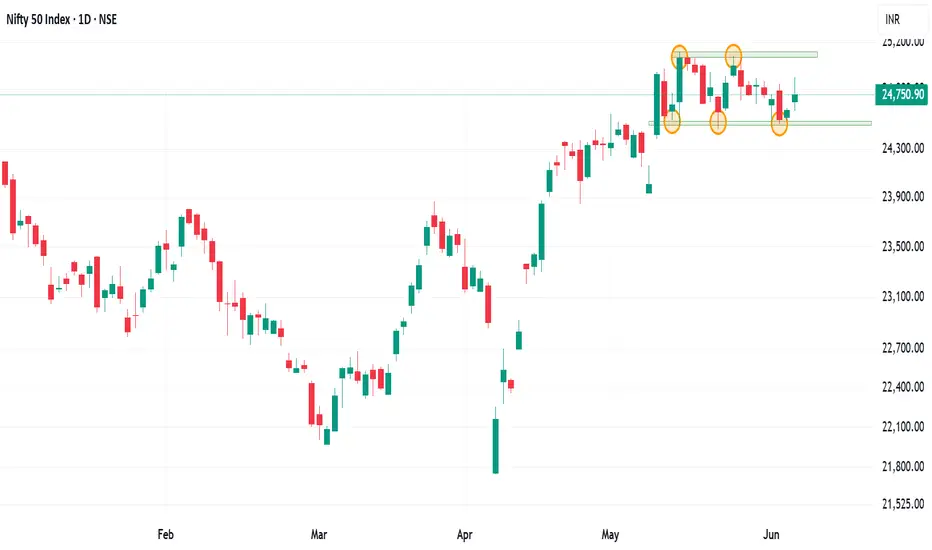
Outlook on nifty 50 for the next week. Is it going trending?Nifty 50 on the daily chart is trading in a range and has respected the zone quite effectively.
Index has remained sideways since a 3.82% move on 12th may. Market trade in cycle and after a sideways cycle, a trending market is predicted.
Either side movement can be seen in the index as 18 bars or 24 days it has remained in the range.
Major Resistance :- 25125, 25500
Major support :- 24500, 23930
This 600 range and change into same range of trending market.
Even the moving averages are coinciding and forming a MA gate which can give good momentum trading setup
Wait for the price action near the price levels before forming a trading basis. Trade only the setup and wait for the retest on either side.
Last one dance for NIFTY!!!!!!Scenario 1 ;
As per my analysis of nifty is declining with tight movement for last few days( consolidating lower)
Yesterday price rejected from one hour(1h) order block(ob) after that it moves quiet good.
For that reason ,today I am expecting more bullish in nifty( aggressive bullish).
Expecting +3% movement.
Scenario 2 ;
If nifty break and close below yesterday low, then it's all going to fall( sharp decline) from the sky to sharp edge of
the mountain( get support) and slowly tears ( after that slowly consolidating lower).
Expecting -5% movement.
Do your own analysis before taking trades. Peace.

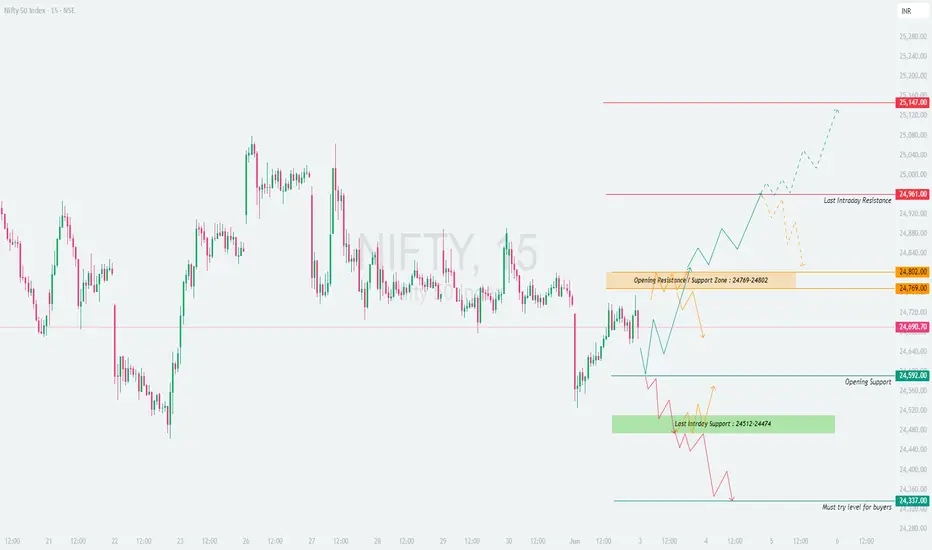
NIFTY : Trading levels and plan for 03-Jun-2025📘 NIFTY 50 – TRADING PLAN for 03-Jun-2025
🕒 Timeframe: 15-minute Chart Structure
📍 Gap Opening Threshold: 100+ points from the previous close of 24,690.70
🔼 GAP-UP OPENING (Above 24,802):
A gap-up above the Opening Resistance / Support Zone (24,769 – 24,802) signals early bullish sentiment. However, Nifty will face immediate resistance at 24,961, which is the Last Intraday Resistance . If that is crossed, the path opens toward 25,147, the next major resistance level.
✅ Plan of Action:
• Let the first 15–30 minutes unfold. If price sustains above 24,802, and forms a bullish 15-min structure (e.g., a higher high candle or retest + bounce), then consider going long above 24,820–24,840 zone.
• Targets:
→ First: 24,961
→ Extended: 25,147
• Stop-loss: Below the retest candle or under 24,769, depending on entry zone.
• Avoid chasing trades directly near 24,961. Let the level either break cleanly or give a pullback opportunity.
🧠 Educational Insight: Gap-ups tend to get tested. Don’t trade breakout levels blindly — instead, wait for a strong base formation or retest bounce before entering.
⚖️ FLAT OPENING (Between 24,690 – 24,769):
This zone lies within the broader consolidation area and right below the Opening Resistance Zone. It’s a sensitive area where the market may attempt either a base-building process or fake breakouts.
✅ Plan of Action:
• Avoid trading immediately at open. Let price test either side of the 24,769 – 24,802 resistance band.
• Long Setup: A clear 15-min candle close above 24,802 with volume support allows a long trade targeting 24,961 and possibly 25,147, with SL below 24,769.
• Short Setup: If price rejects 24,769 – 24,802 with a strong bearish pattern (e.g., evening star or shooting star), consider a short toward 24,592, with SL above 24,802.
• Treat this area as “No Trade Zone” unless a clear breakout or breakdown occurs.
🧠 Educational Insight: Most false breakouts happen in sideways zones like this. Let structure unfold with confirmation before you commit to a direction.
🔽 GAP-DOWN OPENING (Below 24,592):
A gap-down below 24,592 indicates early weakness, and price may head towards the Last Intraday Support Zone (24,512 – 24,474) . The final buyer defense level rests at 24,337, tagged as the Must Try Level for Buyers .
✅ Plan of Action:
• Allow 15–30 minutes to observe market reaction.
• If price holds above 24,512 – 24,474 zone and gives bullish reversal candles (hammer, bullish engulfing), it could offer a long trade toward 24,592 / 24,690.
• Aggressive Shorts: If price breaks and sustains below 24,474, look for quick scalps toward 24,337, with tight SL above 24,474.
• Reversal Longs: At 24,337, only buy if a clear bullish pattern confirms reversal; otherwise, avoid catching a falling knife.
🧠 Educational Insight: Don’t assume every support will bounce. Wait for bullish confirmation or trend shift signals. Panic selling is common on gap-downs, but reward comes only with patience.
🛡 RISK MANAGEMENT TIPS FOR OPTIONS TRADERS:
✅ 1. Avoid trading the first 5–15 minutes post-gap opening — especially with naked options. Let price stabilize.
✅ 2. Use spreads (Bull Call / Bear Put) to reduce risk and theta decay in directional bias.
✅ 3. Don’t overleverage just because premiums look cheap — IV crush can wipe you out fast.
✅ 4. Keep a time-based stop-loss for option buys — if price doesn’t move in your direction within 15–20 mins after entry, reassess.
✅ 5. Always follow the chart, not your emotions . Don’t hold losing trades hoping for a reversal.
📊 SUMMARY & CONCLUSION:
• 🟢 Bullish Above: 24,802, Targets: 24,961 / 25,147
• 🔴 Bearish Below: 24,592, Targets: 24,474 / 24,337
• 🟧 No Trade Zone: 24,690 – 24,769 → Wait for breakout/rejection structure
• 🟩 Support Zones: 24,592 / 24,474 / 24,337
• 🟥 Resistance Zones: 24,802 / 24,961 / 25,147
• ⏱ Time-based Rules: Let 15–30 mins develop to avoid false breakouts and overtrading
✨ Final Thought: Respect the plan. Let the chart tell you what to do — not your bias. The best trades are usually the most boring, disciplined ones.
📢 DISCLAIMER: I am not a SEBI-registered analyst. This trading plan is for educational and informational purposes only. Please consult a SEBI-registered financial advisor before taking any investment or trading decision.
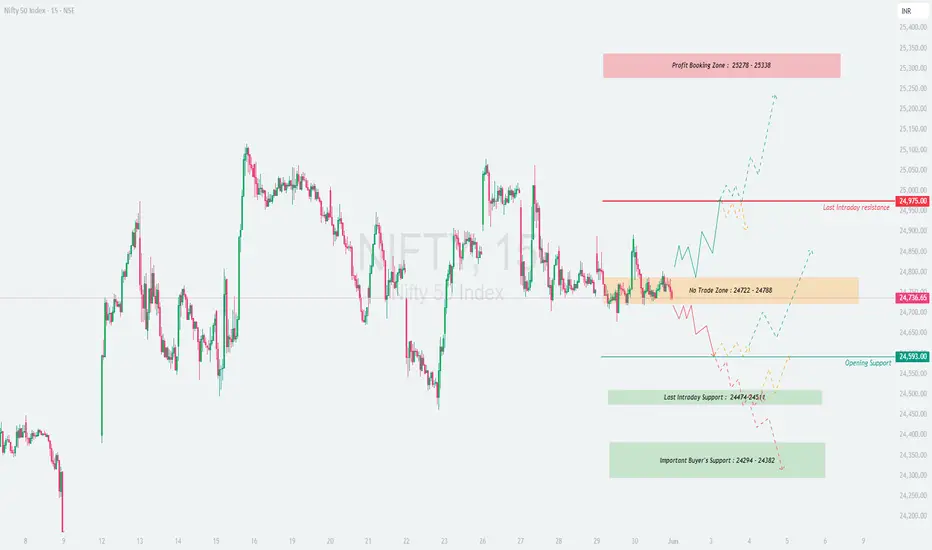
NIFTY : Trading Levels and Plan for 02-JUN-2025📘 NIFTY 50 – TRADING PLAN for 02-Jun-2025
🕒 Timeframe: 15-minute Chart Structure
📍 Gap Opening Threshold: 100+ points from previous close of 24,736.65
🔼 GAP-UP OPENING (Above 24,875):
If Nifty opens with a gap-up above the upper end of the No Trade Zone (24,722 – 24,788) , it indicates early strength and a potential breakout. However, it will face immediate resistance near the psychological mark of 24,975, which is the Last Intraday Resistance .
✅ Plan of Action:
• If the first 15–30 minutes show strength above 24,875 with bullish candles and follow-through volume, look to enter long above 24,900–24,975.
• Targets:
→ First: 24,975
→ Extended: 25,278 – 25,338 (Profit Booking Zone)
• Stop-loss: Below 15-min support candle or under 24,788 for confirmation-based trades.
• Avoid entering long trades directly near 24,975 unless a pullback-retest happens and sustains above.
🧠 Educational Tip: Don’t chase gap-ups blindly. Wait for confirmation like bullish engulfing or retest near breakout zone before taking the trade.
⚖️ FLAT OPENING (Between 24,722 – 24,788):
This is the No Trade Zone , meaning price is in indecision and trapped between key levels. Market may consolidate or build a base before directional movement.
✅ Plan of Action:
• Avoid trading the first 15–30 minutes. Let the price break out of this zone decisively.
• Break Above 24,788: Go long with SL below 24,722, targets: 24,975 / 25,278
• Break Below 24,722: Go short with SL above 24,788, targets: 24,593 / 24,474
• Watch for fakeouts – ensure breakout is supported by strong candle close and not just a wick.
🧠 Educational Tip: No Trade Zones are created for a reason – they usually trap impatient traders. Let the market choose direction and join the trend.
🔽 GAP-DOWN OPENING (Below 24,593):
A gap-down below Opening Support (24,593) suggests early weakness. Nifty may try to test deeper support levels near 24,474 – 24,451 (Last Intraday Support) and further toward 24,294 – 24,382 (Important Buyer’s Support).
✅ Plan of Action:
• Watch the 24,474 – 24,451 zone for signs of reversal. If a bullish reversal candle forms, a long entry can be attempted targeting:
→ 24,593
→ Extended: 24,722
• If 24,451 breaks decisively, expect momentum to carry prices toward 24,294 – 24,382.
• Short Trades: Can be taken only if price rejects bounce zones with bearish structure (e.g., bearish engulfing or retest failure).
🧠 Educational Tip: Don’t buy into weakness without confirmation. Bearish momentum tends to accelerate if support zones break early in the day.
🛡 RISK MANAGEMENT TIPS FOR OPTIONS TRADERS:
✅ 1. Avoid buying far OTM options after a gap opening – stick to ATM or near ATM strikes for better delta.
✅ 2. Use spreads (Bull Call/Bear Put) when expecting directional move with defined risk.
✅ 3. Never trade without a stop-loss ; even best setups fail in volatile markets.
✅ 4. Wait for the 15–30 minute structure to develop before taking directional trades.
✅ 5. Don’t average losers – instead, analyze the trade thesis and exit quickly if invalidated.
📊 SUMMARY & CONCLUSION:
• 🟢 Bullish Above: 24,788, Targets: 24,975 / 25,278 – 25,338
• 🔴 Bearish Below: 24,722, Targets: 24,593 / 24,451 / 24,294
• 🟧 No Trade Zone: 24,722 – 24,788 → Avoid initial trades, wait for breakout
• 🟩 Support Levels: 24,593 / 24,474 / 24,294
• 🟥 Resistance Levels: 24,975 / 25,278 / 25,338
• 📌 Key Rule: Let the structure confirm the bias – don't trade on emotions or pre-conceived notions.
✨ Final Note: Trade with discipline. Best trades don’t come every day — but risk-managed ones preserve your capital always.
📢 DISCLAIMER: I am not a SEBI-registered analyst. The trading plan shared above is strictly for educational purposes. Please consult with a SEBI-registered financial advisor before making any trading or investment decisions.
(june 2, 2025) trade plan for tomorrow🔥 99% Working Trading Plan 🔥
(For educational purposes only — trade at your own risk)
📈 Gap-Up Opening Strategy
➡️ If market opens above 24822 and holds for 15 min,
✅ Go LONG — Targets:
• 24940
• 25070
➡️ If market opens below 24822 but fails to break above in 15 min,
❌ Go SHORT — Targets:
• 24688
• 24610
📉 Gap-Down Opening Strategy
➡️ If market opens above 24688 and holds for 15 min,
✅ Go LONG — Targets:
• 24822
• 24940
• 25070
➡️ If market opens below 24688 and fails to break above in 15 min,
❌ Go SHORT — Targets:
• 24618
• 24520
🔒 Trading Rules (Must Follow):
📌 Never enter a trade without a 20-point stop loss
📌 Activate a trade only after 5M 2 candle closes above/below the level
📌 Don’t jump into trades immediately at level — wait for confirmation
📌 Full risk is your own, not me

(May 31, 2025) trade plan for tomorrow#Nifty50 #option trading
🚀 If you like my trading plan and levels, don't forget to boost the post
99% working trading plan
👉Gap up open 24822 above & 15m hold after positive trade target 24940, 25070
👉Gap up open 24822 below 15m not break upside after nigetive trade target 24688 , 24610
👉Gap down open 24688 above 15m hold after positive trade target 24822 ,24940, 25070
👉Gap down open 24688 below 15m not break upside after nigetive trade target 24618, 24520
📌 Trade plan for education purpose I'm not responsible your trade
More education follow social media and boost my idea
📌 koi bhi trade leval se 20 point ke sl ke bhina karan nahi hi
📌 koi trade app activate tabhi karana hota hi level pe 2 candle uper ya niche closing aati hai to
📌 leval par Ane pe turant trade plan na kare ...
📌 Full risk apaki hi hi meri nahi

Medium term trading opportunity in KIMS for >20% upsideHi,
NSE:KIMS has given a Bullish Flag Breakout on Weekly charts with very good volume.
MACD is also on the bullish side on Weekly time frames. RSI is also on the bullish side on daily, weekly and monthly time frames.
In the current market scenario, I am expecting that the bullish momentum will continue.
Complete price projection like entry, stop loss and targets mentioned on the charts for educational purpose.
Don't Forget to Follow me to get all the updates.
Please share your feedback or any queries on the study.
Disclaimer: Please consult your financial advisor before making any investment decision.

Bullish Flag Breakout in Marico. A Potential Upside OpportunityStock: Marico Ltd. (NSE: MARICO)
CMP: ₹715
Buy Above: ₹715
Stop Loss: ₹678
Target Levels: ₹729.50, ₹745.20, ₹761.25, ₹777.60, ₹794.30, and ₹810 (Final Target)
Time Frame: Short to Medium Term
🏢 About the Company: Marico Ltd.
Marico Limited is one of India's leading consumer goods companies operating in the beauty and wellness space. With well-known brands like Parachute, Saffola, Hair & Care, Set Wet, and Livon, Marico has a strong domestic presence and a growing international footprint across emerging markets in Asia and Africa. The company is known for consistent performance, strong cash flows, and product innovation in the fast-moving consumer goods (FMCG) sector.
Sector: FMCG
Market Cap: Approx. ₹91,000 Cr (as of April 2025)
Headquarters: Mumbai, Maharashtra
NSE/BSE Code: MARICO
🔍 Technical Analysis
A bullish flag breakout has been observed on the daily chart, indicating a potential continuation of the uptrend. Key observations:
Strong volume spike confirms buyer interest at breakout levels.
The price broke above the flag pattern with a decisive close above the resistance trendline.
Moving averages are aligned in a bullish formation (price > 20 EMA > 50 EMA).
RSI near 62 and rising, without being overbought, supports further upside.
This setup aligns with classic flag pattern breakout behavior, offering an excellent risk-reward ratio.
📊 Trade Setup
Entry Stop Loss Target 1 Target 2 Target 3 Target 4 Target 5 Final Target
₹715 ₹678 ₹729.50 ₹745.20 ₹761.25 ₹777.60 ₹794.30 ₹810
⚠️ Disclaimer
This analysis is for educational and informational purposes only.
I am not a SEBI-registered advisor. All trading and investment decisions should be made based on your own research or consultation with a qualified financial advisor. Stock markets involve risks, and past performance is not indicative of future results. Please use proper risk management and position sizing strategies when trading.
Don't forget to Follow for more such Ideas

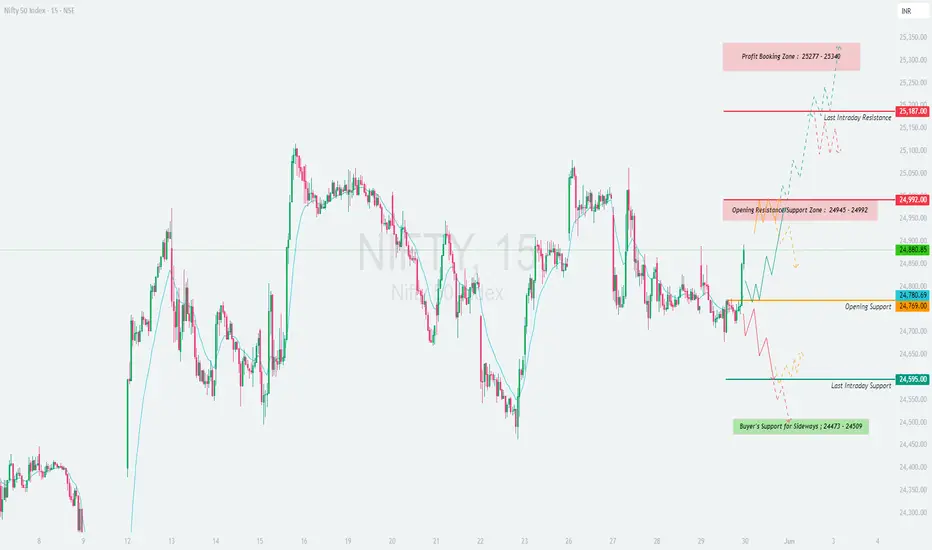
NIFTY : Trading Levels and Plan for 30-May-2025📘 NIFTY – TRADING PLAN for 30-May-2025
🕒 Based on 15-minute Chart Analysis
📍 Gap Opening Threshold: 100+ points from previous close of 24,880.85
🔼 GAP-UP OPENING (Above 24,992+):
If Nifty opens above the Opening Resistance zone (24,945 – 24,992) , it signals potential bullish continuation with strong upward momentum.
✅ Plan of Action:
• Wait for a 15-min candle close above 24,992 for breakout confirmation.
• Once confirmed, long trades may be initiated with upside targets:
→ 25,187 (Last Intraday Resistance)
→ 25,277 – 25,340 (Profit Booking Zone)
• Ideal stop-loss should be just below the breakout candle or beneath the 24,992 zone.
• If Nifty approaches 25,187 too quickly after open, expect minor profit booking or sideways move. Avoid aggressive buying near this resistance without proper structure.
🧠 Educational Insight: A gap-up above resistance is strong only if volume confirms and price sustains. Avoid chasing spikes; instead, wait for retest or consolidation above breakout levels to increase probability of success.
⚖️ FLAT OPENING (Between 24,780 – 24,945):
A flat open in this zone keeps the index in a balanced state with both opportunities and risks. Price action will dictate the day’s trend.
✅ Plan of Action:
• Mark the Opening Support: 24,780
• Mark the Resistance Supply zone: 24,945 – 24,992
• Wait for a range breakout:
→ Above 24,992 → Go long (targets: 25,187 → 25,340)
→ Below 24,780 → Go short (targets: 24,595 → 24,473)
• Do not trade within this zone unless price structure is clear and directional.
• Look for rejection wicks or engulfing patterns near support/resistance for potential scalps.
🧠 Educational Insight: Sideways zones are where traders lose most of their capital. Wait for confirmation before jumping in. A “No Trade” decision is also a trade that protects capital.
🔽 GAP-DOWN OPENING (Below 24,680):
A gap-down of more than 100 points brings Nifty near key supports: 24,595 (Last Intraday Support) and deeper into Buyer’s Support Zone (24,473 – 24,509).
✅ Plan of Action:
• Observe price behavior near 24,595.
• If this level holds, and you spot bullish reversal signs (hammer, bullish engulfing), go long toward:
→ 24,780 (Opening Support)
→ 24,880 (Previous Close)
• If price breaks below 24,473 with strong bearish candle, it opens up shorting possibilities with deeper targets.
• Stop-loss for reversal longs = below 24,473; for breakdown shorts = above 24,595.
• Avoid trading immediately at open; let the first 15–30 min range develop for clearer direction.
🧠 Educational Insight: Demand zones are highly reactive. Let the market show whether buyers are stepping in or fleeing. React, don’t predict.
🛡 RISK MANAGEMENT TIPS FOR OPTIONS TRADERS:
✅ Always use 15-min confirmation candles before taking a directional position.
✅ Don’t buy far OTM options post-gap openings ; use near ATM or spreads to control premium decay.
✅ Define your loss limit for the day and stick to it. One wrong revenge trade can ruin weeks of gains.
✅ Keep position sizing small on volatile or event days — focus on surviving first, thriving later.
✅ Use option spreads like debit spreads to reduce theta exposure during sideways market phases.
📊 SUMMARY & CONCLUSION:
• 🟢 Bullish Scenario: Above 24,992 → Targets: 25,187 / 25,340**
• 🔴 Bearish Scenario: Below 24,595 → Targets: 24,509 / 24,473**
• 🟧 Neutral Zone: 24,780 – 24,945 → Wait for breakout direction
• 🟩 Support Levels: 24,780 / 24,595 / 24,473
• 🟥 Resistance Levels: 24,992 / 25,187 / 25,340
• 🧠 Key Strategy: Avoid emotional trading during volatile opening. Wait, confirm, then act.
✨ Final Word: Trading is a skill of patience and preparation. Let levels guide you, not assumptions. The market rewards precision, not prediction.
📢 DISCLAIMER: I am not a SEBI-registered analyst. This trading plan is intended solely for educational purposes. Please consult your financial advisor before making any trading or investment decisions. Trade wisely. 📉📈
(May 30, 2025) trade plan for tomorrow#Nifty50 #option trading
🚀 If you like my trading plan and levels, don't forget to boost the post
99% working trading plan
👉Gap up open 24938 above & 15m hold after positive trade target 25170, 25370
👉Gap up open 24938 below 15m not break upside after nigetive trade target 24783, 24668
👉Gap down open 24783 above 15m hold after positive trade target 24938, 25170
👉Gap down open 24783 below 15m not break upside after nigetive trade target 24668, 24568
📌 Trade plan for education purpose I'm not responsible your trade
More education follow social media and boost my idea
📌 koi bhi trade leval se 20 point ke sl ke bhina karan nahi hi
📌 koi trade app activate tabhi karana hota hi level pe 2 candle uper ya niche closing aati hai to
📌 leval par Ane pe turant trade plan na kare ...
📌 Full risk apaki hi hi meri nahi

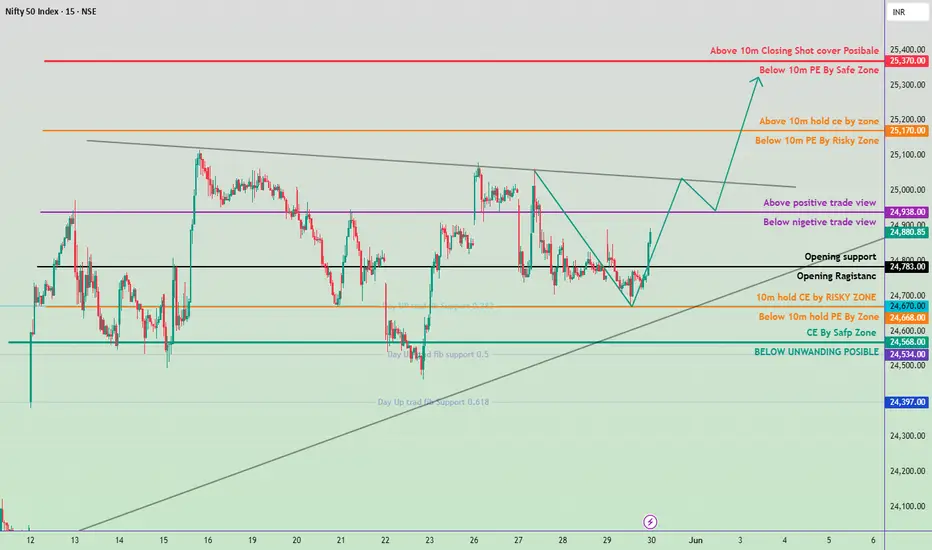
(May 30, 2025) trade plan for tomorrow 🔼 Bullish Scenarios (Buy above levels)
Above 24,938 (Purple Line)
View: Positive trade view
Target Levels: 25,170 25,370
Above 25,170
Zone: High call writing, if broken, signals strong bullishness.
Target: 25,370
🔽 Bearish Scenarios (Sell below levels)
Below 24,783 (Black Line)
View: Below opening resistance area
Target Levels 24,670 24568
NIFTY : Trading levels and Plan for 29-May-2025📘 NIFTY 50 – TRADING PLAN for 29-May-2025
📈 Based on 15-min structure and key zones
📍 Gap Opening Threshold: 100+ points from previous close of 24,757
🔼 GAP-UP OPENING (Above 24,857):
If Nifty opens above 24,857+, it will open above the current Opening Resistance Zone: 24,748 – 24,786 , creating early bullish momentum.
✅ Plan of Action:
• Let the price settle in the first 15–30 mins. Avoid chasing green candles in the first 5 mins.
• If Nifty sustains above 24,891 (Opening Resistance), bullish momentum is confirmed. You may initiate long trades (Call options or Futures) with targets at 24,997 (Last Intraday Resistance) and trail SL at 24,891 .
• Once price reaches 24,997, partial profit booking is advised, as it’s a strong resistance zone.
• In case of a sharp pullback toward the 24,748–24,786 zone, observe for bullish reversal patterns (hammer, engulfing) before considering re-entry.
• A failure to sustain above 24,891 followed by bearish price action may lead to a trap. Wait for confirmation before going short.
🧠 Educational Tip: A gap-up followed by sideways movement or rejection at resistance often leads to profit-booking. Be cautious if momentum fades quickly.
⚖️ FLAT OPENING (Between 24,748 – 24,786):
This is a tricky Opening Support-Resistance Zone , often referred to as the "No Trading Zone" due to choppy price action.
✅ Plan of Action:
• Stay out initially – wait for either a breakout above 24,786 or a breakdown below 24,748 to take a directional trade.
• A 15-min candle close above 24,786 with volume confirmation can lead to upward momentum targeting 24,891 → 24,997 .
• If Nifty breaks and sustains below 24,748 , consider short trades toward 24,702 → 24,667 .
• Avoid overtrading in this zone; wait for clean structure and direction. Sideways zones are premium killers in options.
🧠 Educational Tip: Price often consolidates near open when inside a resistance-support overlap. Don't anticipate the move — participate only when confirmation arrives.
🔽 GAP-DOWN OPENING (Below 24,657):
If Nifty opens more than 100 points lower (below 24,657), it opens near the Opening Support Zone: 24,667 – 24,702 or possibly close to Last Intraday Support: 24,592 .
✅ Plan of Action:
• Observe early reactions around 24,592 . If this level holds and bullish reversal patterns emerge, you can go long for an intraday bounce toward 24,702+ with a tight SL below 24,592.
• If Nifty breaks 24,592 and sustains below on 15-min candle close, you may initiate Put trades or shorts, targeting 24,391 → 24,326 (Important Buyer’s Support).
• Be cautious near 24,391–24,326 zone — sharp reversals often occur there as it’s a critical demand zone.
• Avoid emotional shorting just because of gap-down; confirm weakness through patterns like breakdown and retest.
🧠 Educational Tip: Many retail traders short gap-downs only to be trapped in V-shape recoveries. Patience and pattern confirmation matter more than the gap itself.
🛡 RISK MANAGEMENT TIPS FOR OPTIONS TRADERS:
📌 Always follow 15-min candle close SLs for directional confirmation.
📌 Use spread strategies like Bull Call/Bear Put spreads on high IV days to limit risk.
📌 Avoid trades inside overlapping zones like 24,748 – 24,786 unless a breakout/breakdown occurs.
📌 Stick to maximum 1–2 trades a day. Avoid overtrading due to boredom or FOMO.
📌 Define your Risk:Reward ≥ 1:2 before entering any trade.
📌 Don’t average losing positions. Respect your stop-loss.
📌 Protect profits using trailing SL once targets start hitting.
📊 SUMMARY & CONCLUSION:
• 🟢 Bullish Above: 24,891 → Targets: 24,997
• 🔴 Bearish Below: 24,592 → Targets: 24,391 / 24,326
• 🟧 Opening Support-Resistance Zone: 24,748 – 24,786
• 🟩 Support Zone: 24,667 – 24,702
• 🟥 Last Intraday Support: 24,592
• 💚 Strong Buyer's Zone: 24,391 – 24,326
✨ Key Rule: Follow the flow — don’t predict it. Let price tell you what it wants to do and then ride the wave.
📢 DISCLAIMER: I am not a SEBI-registered analyst. This plan is shared purely for educational purposes. Please consult a certified financial advisor before making any trading or investment decisions. Trade at your own risk. 💼📉📈

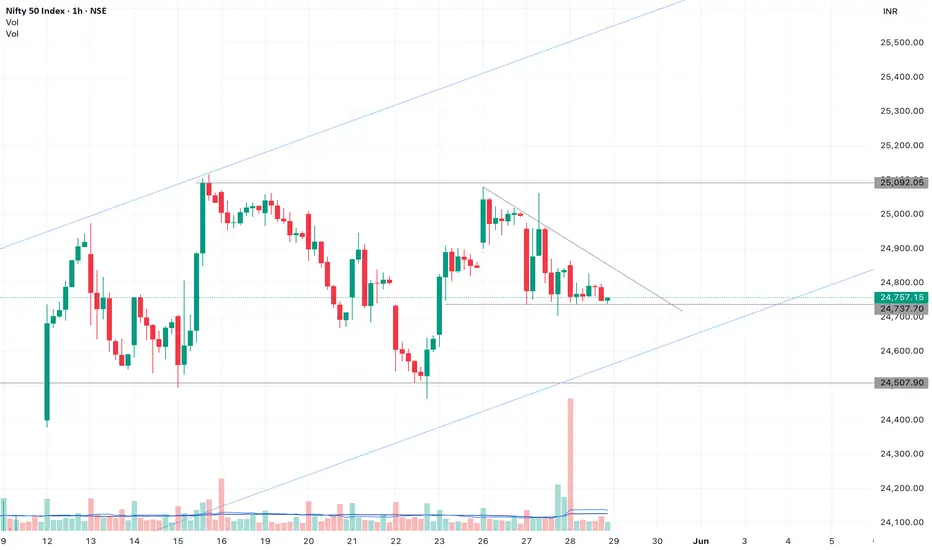
Nifty chart for 29th May 2025Looks like Nifty is forming a triangle pattern.
Disclaimer: All information provided here is for educational purposes and not a recommendation, advice, research report, or stock tip of any nature. Analysis Posted here is just our view/personal study method on the stocks, commodities or other instruments and assets.