NIPPONIND : is correction over on Wave 2 or B?INDO-NATIONAL LTD (NSE: NIPPONIND) 🚀
Weekly Chart Analysis – Potential Swing Opportunity!
1. Structure & Setup
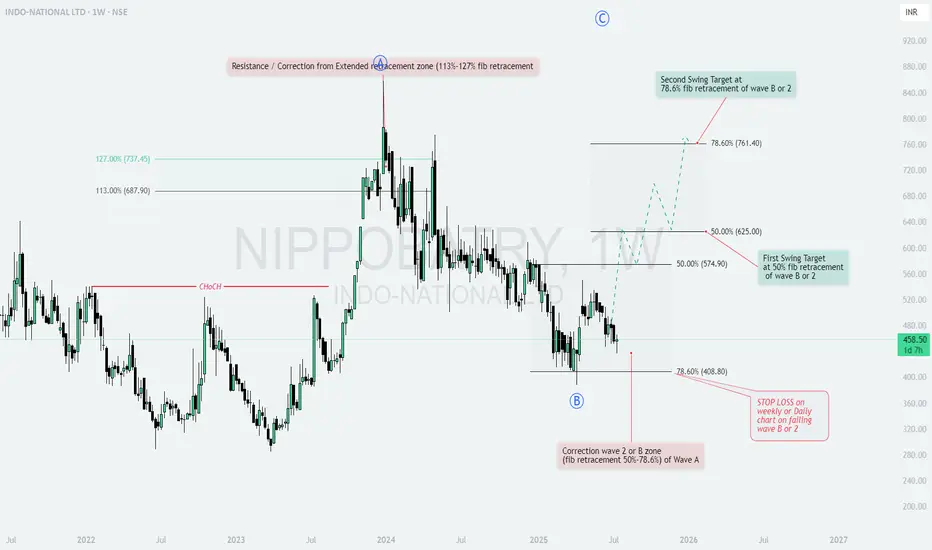
The stock has completed a major correction in the zone of 50%-78.6% Fibonacci retracement of Wave A (408.80–458.50).
Wave B or 2 seems to be in place, setting up for a potential bullish move.
Previous resistance and correction occurred from the extended retracement zone (113%-127% fib).
2. Key Levels & Targets
First Swing Target: 50% fib retracement of Wave B or 2 at ₹574.90–625.00 🥇
Second Swing Target: 78.6% fib retracement of Wave B or 2 at ₹761.40 🥈
Support: 78.6% fib retracement of Wave A at ₹408.80
3. Risk Management
STOP LOSS: On weekly or daily close below the correction zone (failing Wave B or 2), i.e., below ₹408.80 🚨
4. Observations & Strategy
1️⃣ Chances of a bullish reversal are high from the current zone, supported by fib retracement confluence.
2️⃣ Watch for a breakout above ₹500 for confirmation of momentum.
3️⃣ Risk/Reward is favorable for positional swing traders.
Summary:
A strong setup for a multi-month swing! Monitor price action near support and trail your stop as the move unfolds. 📈
Like & Follow for more setups! 👍✨
#NIPPONIND #SwingTrade #TechnicalAnalysis #Fibonacci #TradingView #Stocks #NSE
NIPPOBATRY
NIPPOBATRY - Ichimoku Bullish Breakout Stock Name - Indo-national Limited
Ichimoku Cloud Setup :
1). Today's close is above the Conversion Line
2). Future Kumo is Turning Bullish
3). Chikou span is slanting upwards
All these parameters are showing bullishness at Current Market Price
and more bullishness AFTER crossing 495
#This is not Buy and Sell recommendation to any one. This is for education purpose and a helping hand to learn trading in Market.
# Cloud Trading
# Ichimoku Cloud
# Ichimoku Followers
I hope you all like my analysis.
Please do share your thoughts into comment section.
Please give a like, it motivates me to do analysis.

NIPPO BATTERYSharing my idea on #NIPPOBATRY. Suggesting to buy above the mentioned trend line. Make sure it sustains the line before you buy.
Note: For educational purpose only. Do self analysis before you buy.

#JKPAPER CMP 162.65 #Target 181 #swingtrading #trading #stocks
#JKPAPER
NSE: JKPAPER
CMP 162.65
Target : 181.4
SL 150
RR Ratio > 1.5
Time Frame < 45D
Factors:
Trend Following
Rising Volume with rising Prices.
Flag pattern breakout.
Pennant Pattern Breakout with Bullish Candle.
Retest Successful.
Higher Highs & Higher Lows.
Broken above RESISTANCE levels
Trading at SUPPORT levels
Earnings are strong.
Bullish Wedge Breakout
Risk Return Ratio is healthy.
And
Rising from Double Bottom Pattern to Flag Pattern forming.
If you like my work KINDLY LIKE SHARE & FOLLOW this page for free Stock Recommendations.
With 💚 from Rachit Sethia
