NITCO LTD | Monthly Chart Analysis📊 NITCO LTD (NSE:NITCO) | Monthly Chart Analysis
📅 Date: June 1, 2025
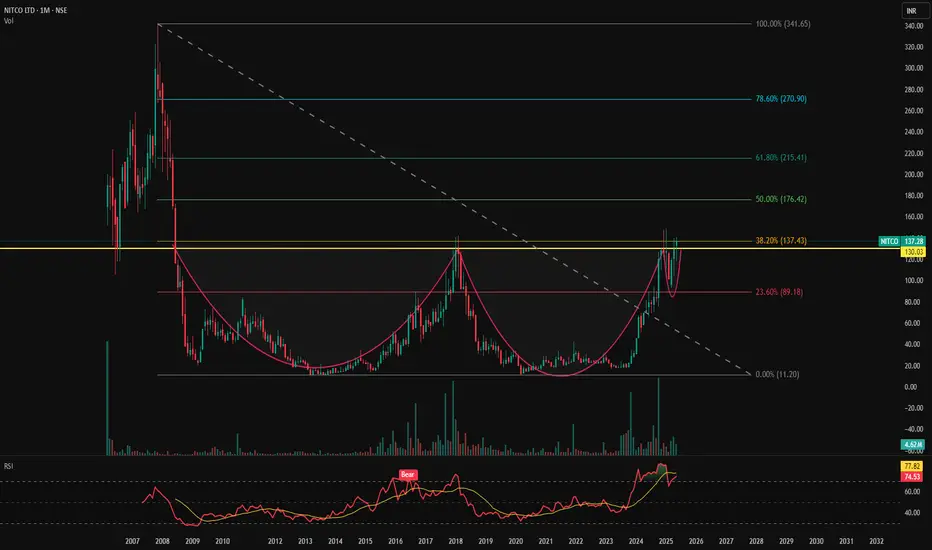
📈 CMP: ₹137.28 (+6.02%)
📌 Ticker: NSE:NITCO
📉 Chart Pattern Insight
🏆 Massive Cup and Handle Breakout Formation (18-Year Base)
NITCO is breaking out of a textbook multi-decade Cup and Handle pattern, forming over 17+ years. This type of structural breakout on a monthly timeframe is rare and typically leads to multi-fold rallies.
💥 The breakout zone lies around ₹130.03 – previously a strong resistance from 2007, 2017, and now being tested again with a strong monthly close above it.
📊 Indicator: RSI + Moving Average Cross (Icon shown)
🔎 RSI (Relative Strength Index): Currently at 74.53, signaling strong bullish momentum
📈 RSI has also crossed above its moving average, and the "Bear" label in the past has flipped, suggesting a shift in long-term trend direction.
🔑 Key Levels
🔸 Breakout Zone: ₹130.03 (now acting as support)
🎯 Target Zones (based on Fibonacci & historical zones):
₹180
₹250
₹320+
🛡️ Stop Loss (Monthly Close Below): ₹120
💡 Trading Strategy
Entry: On successful retest and hold above ₹130
SL: ₹120 (monthly candle close basis)
Target: Positional hold for ₹180–₹320+
Time Frame: Long-term multi-month to multi-year potential
⚠️ Disclaimer
This is for educational purposes only. Please do your own research or consult a registered advisor before taking positions.
NITCO
NITCO Ltd Box breakout Pattern in weekly chartNITCO is showing a good box breakout pattern in weekly with volumes
Weekly RSI is bullish
Relative Strength is strong
Price above 200ema, Trend is Bullish


nitcoNote:
1. Views are personal and for educational purposes only. Recheck and take the trade as per your RR.
2. Always remember SL is your lifeline, not the big target...
3. Follow us for more patterns and like, share so that we feel it is helpful to many and share more patterns...
3. Views given here is not a tip rather it is for educational purpose... Aftermarket opens, the condition might change so learn to handle different conditions...
4. To learn more about patterns, Psychology behind the trade, and price action trading... contact us... Thanks...
Keep an eye ladies and gentlemen. Cheers and Happy Trading

NITCOHi guys, this chart is for educational purpose only not for sale... plz do your own analysis too.. Thank Q

