NMDC LTD ANALYSISTHIS IS MY CHART OF THE WEEK PICK
FOR LEARNING PURPOSE
NMDC LTD- The current price of NMDC is 82.61 rupees
I am going to buy this stock because of the reasons as follows-
1. It has given a breakout of last 1.5 year resistance with some good volume and looks great.
2. This stock has seen some great buying in 2023. I bought this stock in 2023 and played some good move. It has got time and price correction which was required.
3. It is showing better relative strength as it stood strong in volatile times including last few weeks.
4. The risk and reward is favourable.
5. The stock is one of the outperformers in this market. The structure is great as of now. It has also outperformed it's sector in very short term but it was more of a lagging stock in mid term and probably it will show better strength in coming days.
6. Another good part- The overall sector has shown some decent strength and have good momentum.
I am expecting more from this in coming weeks.
I will buy it with minimum target of 35-40% and then will trail after that.
My SL is at 71.89 rupees.
I will be managing my risk.
NMDC

NMDC (D): Bullish, Knocking on the DoorTimeframe: Daily | Scale: Linear
The stock is on the verge of a major structural breakout from a 12-month accumulation zone (post-bonus). The move is backed by "Climax Volume" and a strong sectoral tailwind, signaling that smart money is aggressively entering.
🚀 1. The Fundamental Catalyst (The "Why")
The surge is not random; it is driven by a sector-wide re-rating:
> Sector Rally: The Nifty Metal index and global mining peers are surging, fueled by rising iron ore prices and expectations of demand recovery in China.
> Volume Significance: The 77.6 Million volume is an "Institutional Stamp." It indicates that big players are positioning for a breakout before it happens.
📈 2. The Chart Structure (The "Lid")
> The Box: The stock has been trapped in a wide consolidation since the 2:1 Bonus Issue in late 2024.
> Resistance: ₹82 – ₹83 . This level (the 52-week high) has capped every rally for the past year.
> Current Action: The stock hit an intraday high of ₹82.3 today, testing the ceiling. Closures near the high suggest buyers are eating up all supply.
📊 3. Technical Indicators
> RSI: Rising in all timeframes (Monthly/Weekly/Daily) confirms momentum is synchronized.
> Moving Averages: The stock is trading above all key EMAs, with a Golden Crossover (Short-term EMAs crossing Long-term EMAs) confirming the trend shift.
🎯 4. Future Scenarios & Key Levels
The stock is at the "Make or Break" point.
> 🐂 Bullish Breakout (The Trigger):
- Condition: A decisive Daily Close above ₹83 .
- Target: ₹91 .
> 🛡️ Support (The Safety Net):
- Immediate Support: ₹78 . The previous breakout level.
- Stop Loss: A close below ₹75 would invalidate the bullish view and send the stock back into the "boring" sideways range.
Conclusion
This is a Grade A Setup because of the volume.
> Strategy: The high volume suggests the breakout is likely real. Watch for the ₹83 level to be taken out decisively.

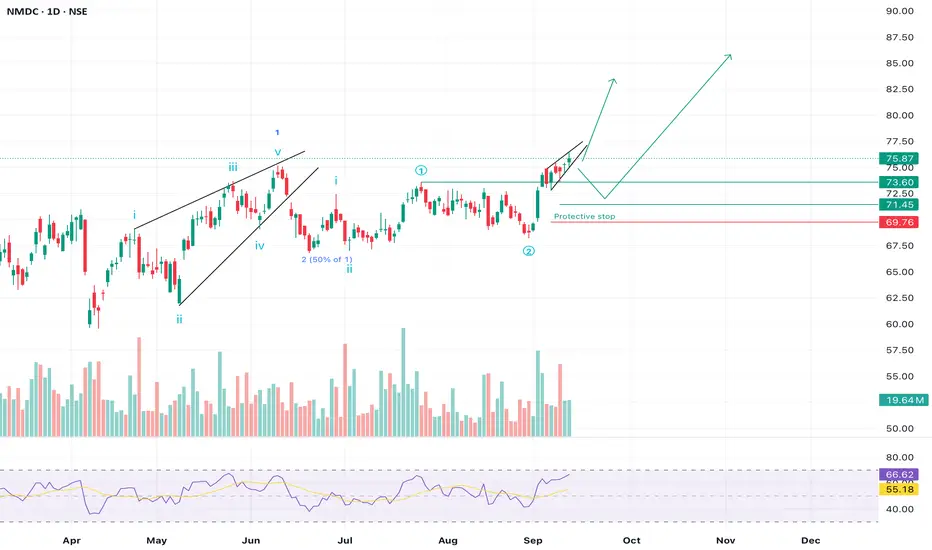
NMDC setting the stage for RALLYNMDC looks to be setting up for a potential impulsive rally after completing a corrective wave. The structure suggests strength, with protective levels clearly defined.
🧩 Elliott Wave Structure
• We can see a completed 5-wave move up earlier this year (Wave 1).
• That was followed by a healthy correction (Wave 2), which retraced close to 50% of Wave 1 — a textbook retracement zone.
• Now, price action is forming a new Wave 3 setup, which tends to be the strongest move in Elliott Wave cycles.
📈 Key Levels to Watch
• Current Price: ₹75.87
• Immediate Support: ₹73.60 – ₹73.37 zone
• Protective Stop: ₹71.45 (below recent swing low, Wave 2 invalidation area)
• Upside Path: If price sustains above ₹76, we may see a quick move towards ₹80–82 first, and eventually ₹85+ in the coming weeks.
🔍 Technical Indicators
✅ RSI is rising and trading around 66, showing bullish momentum but still shy of overbought levels.
✅ Moving averages are sloping upward, supporting the bullish bias.
✅ Volume spikes on green candles indicate strong participation from buyers.
📊 Possible Scenarios
1. Bullish Continuation: A breakout above ₹76 could trigger momentum buying, leading to higher targets quickly.
2. Pullback Before Rally: Price may retest the ₹73–74 zone before resuming the uptrend — a healthy retest would make the rally stronger.
Protective stop is marked near ₹71.45. If price falls below this, it may indicate that the wave structure has failed, and deeper correction could follow.
⸻
Disclaimer:
This analysis is for educational purposes only and not investment advice. Please consult a SEBI-registered financial advisor before making any trading or investing decisions.
NMDC By KRS Charts9th June 2025 / 19:01
Why NMDC?
1. Dow Theory , it turned into Bullish Trend with Higher Highs & Higher lows.
2. Huge Accumulations since many Years and as I said above HHs & HLs.👆
3. In major timeframes stock is above 100EMA which is sign that more upside might possible.
4. Wave counts are picture perfect with more than 0.618 retracement for wave(2) and Reversed to upside from 0.5 Retracement between wave(2) & wave4 bottom points.
Targets & SL is mentioned in Chart.
NSE:NMDC NSE:CNXMETAL

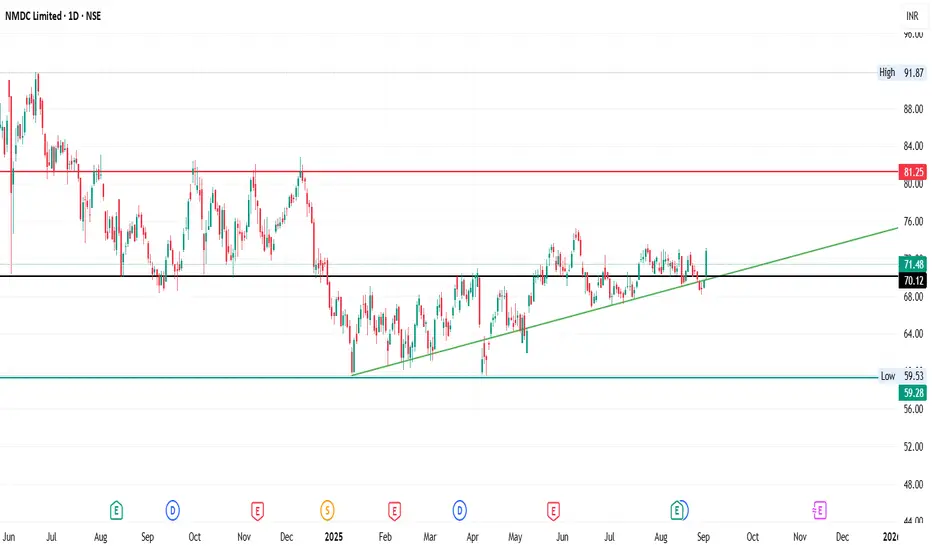
NMDC – Daily Chart | Range Bound SetupNMDC is consolidating in a range between:
Resistance : ₹73.50
Support : ₹67.50
Breakout above ₹73.50 → Upside target: ₹80–81.
Breakdown below ₹67.50 → Downside target: ₹60.
High volume of 46.54M traded today, signaling strong interest.
Disclaimer : This is for educational purposes only, not financial advice. Please do your own research before making trading decisions
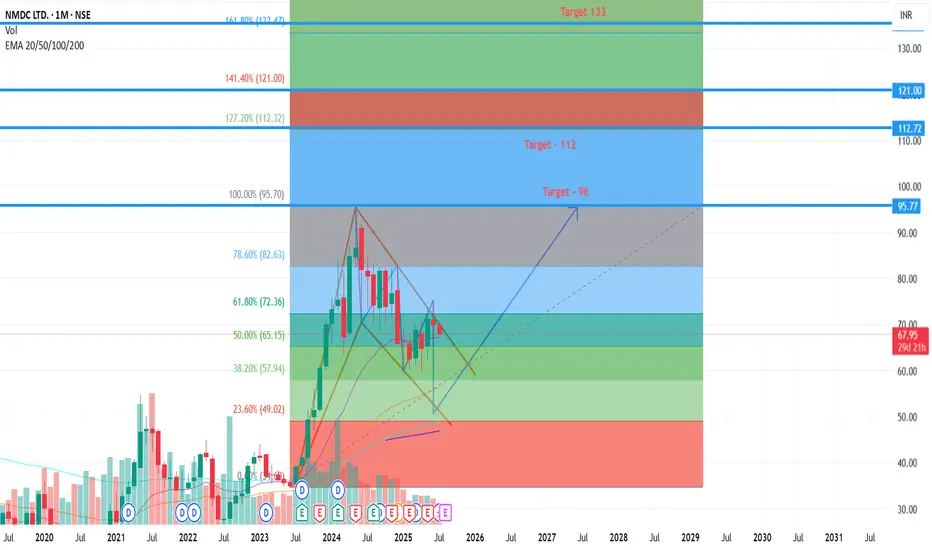
Accumulate NMDC Target - 133 Wait for BreakoutNMDC is currently trading in a channel and flag pattern.
Wait for breakout.
Target 1 - 96
Target 2 - 112
Target 3 - 121
Target 4- 133
NMDC - Sellers PointStock at supply zone ( D - B - D)
Area of supply ( 67 - 68)
Downside targets 60
View negation above 70
Entry after lower time frame confirmation (1 hour)

NMDCThere are multiple patterns visible here and it seems a breakout is being prepared considering all the patterns.
I see a large triangle formation breakout inside which a Wolfe Wave was already working and some of you know how much I love the Wolfe Wave.
Further the price action has taken supports multiple time from the same trend line.


NMDC by KRS Charts 24th September 2024 / 10:30 AM
Why NMDC ❓
1. Today Gap-up and Strong Green candle with Good Volume and with Higher Low.
2. In 1M, it's a retest for Accumulation on resistance it broke before.
3. Conclusion in series for Easy Understanding,
⚡ First Accumulations > Breakout > Retest > HL > Today's Breakout ⚡
Targets are in the Charts many more Upside but after current Targets achieved 👍
SL is 190 Rs.

KPI GREEN IS LOOKING BULLISHKPI GREEN is looking strong at current market price as this area giving strong support to the buyers. Also price rejected multiple times from this area. All views are my personal

Lux Industries Entered Strong Demand AreaLux industries entered into strong demand area and formed doubl bottom as an additional confirmation. All views are my personal, these posts are not a buy/sell recommendation. Contact your financial advisor before taking any buying decisions.

NMDC - The Fifth Can be Juicer then ThirdNMDC is very similar in chart structure with PNB only difference is NMDC has broken out of falling channel of wave 4 & has given confirmation of wave 5 which can head towards 360-390 levels.
NMDC is a good chart to study patterns (Not shown in this chart) but if you look carefully can spot 2 inverted H&S from where pattern has also played very well classical text book pattern & playing as per book is something which makes you conviction in charts very strong.

NMDC CHART IS LOOKING BULLISHNMDC chart is turned bullish after trend line breakout. These all my views are personal, not a buy sell .

NMDC Breakout Soon NSE:NMDC
1. Wait for a breakout from the descending channel.
2. Alternatively, wait for the stock to take support in the marked green zone and watch for a reversal.
3. If the support level is broken, a further downtrend is likely (the stock is already in a downtrend).

NMDC BULLISH AT SUPPORT.NMDC has came to its support area or say buying zone, Its has also made a bullish candle at its support. This shows Buying at the support.

NMDC is trading near prev support zone Stocks to Keep in Radar for Next Week
⏩ SBIN
⏩ NMDC
⏩ BHEL
⏩ DLF
NMDC If continues to holds the prev week support level,
recovery towards 270 could be possible.
However in case of Bearish pattern at higher level, it may come back to prev week's range
Important downside support is around 245 zone
whereas upside hurdle is aroud 270 level
*Election Results can create Volatility in the Maket
Keep Tracking Charts
*For Educational Purpose
Learn & Practice Price Action setups

NMDC - Ichimoku Breakout📈 Stock Name - NMDC Limited
🌐 Ichimoku Cloud Setup:
1️⃣ Today's close is above the Conversion Line.
2️⃣ Future Kumo is Turning Bullish.
3️⃣ Chikou span is slanting upwards.
All these parameters are shouting BULLISH at the Current Market Price and even more bullishness anticipated AFTER crossing 270.
🚨Disclaimer: This is not a Buy or Sell recommendation. It's for educational purposes and a guiding light to learn trading in the market.
#CloudTrading
#IchimokuCloud
#IchimokuFollowers
#Ichimokuexpert
Excited about this analysis? Share your thoughts in the comments below!
👍 Like, Share, and Subscribe for daily market insights! 🚀
#StockAnalysis #MarketWatch #TradingEducation #ichimoku #midcap #nmdc

NMDC BREAKOUT AFTER 12 YEARS ?cmp 147
1) RESITANCE RANGE FROM 12 YEARS -- 140-------160
2) Formation of Inverted H&S pattern is longer as well as smaller time frame.
3) Breakout Candidate
we can buy it in cash for minimum 50% target
TARGETS 155 / 160
{weekly closing above 160 will be considered as breakout}
For-- 180 / 200 / 220 / 240 / 260 / 280 / 300
CBSL 110
Just Buy and Forget.........
Regards...
Keshav..
01/10/2023
Disclaimer. I am not a SEBI registered advisor. All views shared on this channel and group are my personal opinions shared for educational purposes .. Good Luck 😉

breakout in nmdc self explanatory chart
breakout with huge vol..+ retest at 30m t.f
tgt 310 / 438
stop loss - 235
im not sebi registered kindly see this view as a learning material
please consult your financial advisor before investing or trading

TREND CHANGED IN NMDC - FROM BUYING ON DIPS TO SELL ON RISE ?NMDC is engaged in exploration and production of Iron Ore along with Diamond, production and sale of Sponge Iron and generation and sale of Wind Power.
This PSU stock has given great returns to investors as well as traders in last one year.
Although there exists so many positive talks about NMDC's volume growth, sales growth & capacity enhancement etc. which are fundamentally good but I think trend is changed in NMDC.
This stock was buy on dips since May-June 2023 but right now as per technical chart & price action, I think trend is changed from buy on dips to sell on rise.
I will find opportunity to sell it on each rise until it breaks 235-240 level.
So, Is it still buy on dips or has become sell on rise?
Only time will tell!
P.S. : This stock is on my main watchlist for a short trade.

Crossover Trade - NMDC📊 Script: NMDC
📊 Sector: Mining & Mineral products
📊 Industry: Mining / Minerals / Metals
Key highlights: 💡⚡
📈 Script is trading near middle band of BB.
📈 Already Crossover in MACD.
📈 Double Moving Averages are giving crossover.
📈 Right now RSI is around 57.
📈 One can go for Swing Trade.
⏱️ C.M.P 📑💰- 224
🟢 Target 🎯🏆 - 243
⚠️ Stoploss ☠️🚫 - 217
⚠️ Important: Always maintain your Risk & Reward Ratio.
✅Like and follow to never miss a new idea!✅
Disclaimer: I am not SEBI Registered Advisor. My posts are purely for training and educational purposes.
Eat🍜 Sleep😴 TradingView📈 Repeat 🔁
Happy learning with trading. Cheers!🥂

NMDC buy CallHi everyone i would like to inform you that if you are looking opportunity in NMDC then this is the good level to buy NMDC between 194 - 198 and we can expect the target 207 ,215,224 ,235 in short to long term and consider SL 177 - 175.
