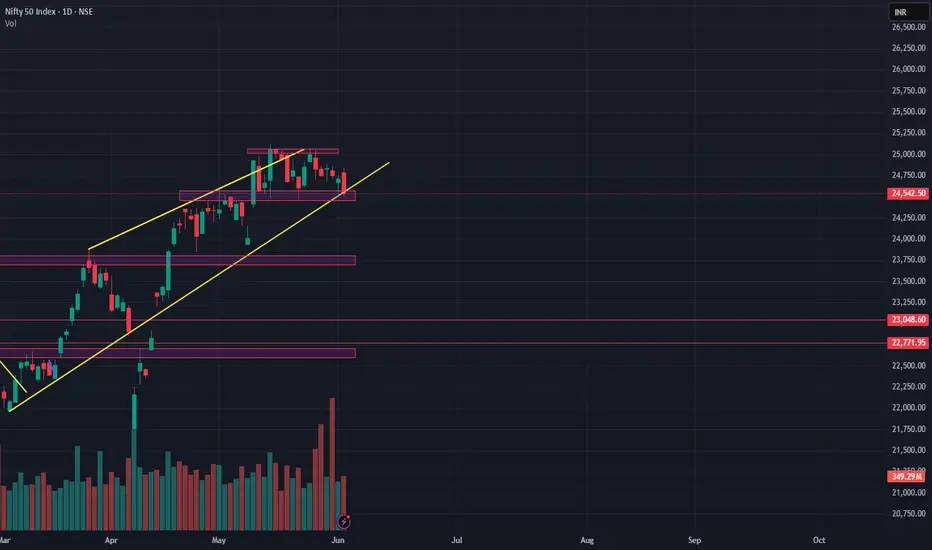
NIFTY 50 – Trendline Breakdown! What's Next?The NIFTY 50 has broken below a key rising trendline, signaling a potential end to the recent bullish momentum. This breakdown is supported by price action, volume analysis, and open interest data, indicating a shift in market structure.
📊 Chart 1: OI + Volume Profile Insights
Heavy Call OI buildup near 24,800–25,000, creating a strong resistance zone.
Price rejected from this area and broke below the ascending trendline.
Breakdown came with increased selling interest and a low volume node below 24,500, which could trigger a swift move downward.
Multiple expiry OI clusters confirm the bearish bias in the near term.
📈 Chart 2: Price Action + Volume Structure
Rising channel/wedge decisively broken on high volume.
Key support at 24,400–24,500 is being tested.
Below this zone, next supports lie at:
23,750 (horizontal demand zone)
23,048 (Feb–March consolidation zone)
22,771 (weekly demand)
Volume indicates increased participation at the top — possibly distribution.
⚙️ Trade Setups
🔻 Bearish Breakdown
Entry Trigger: Below 24,500
Targets: 24,200 → 23,750 → 23,050
Stop Loss: 24,620
🔁 Bullish Reversal
Entry Trigger: Close above 24,800
Targets: 25,000 → 25,200
Stop Loss: 24,600
⚠️ Rangebound Watch
Entry Trigger: Between 24,500–24,800
Targets: Wait & react
Stop Loss: –
🧠 Summary
This is more than a minor dip — it's a technical structure break:
✅ Trendline lost
✅ Rising wedge breakdown
✅ OI resistance above
✅ Volume confirming shift
Unless the bulls reclaim 24,800+ soon, the path of least resistance appears downward.
💬 What’s your bias — breakdown or bounce? Share your view in the comments.
Nse
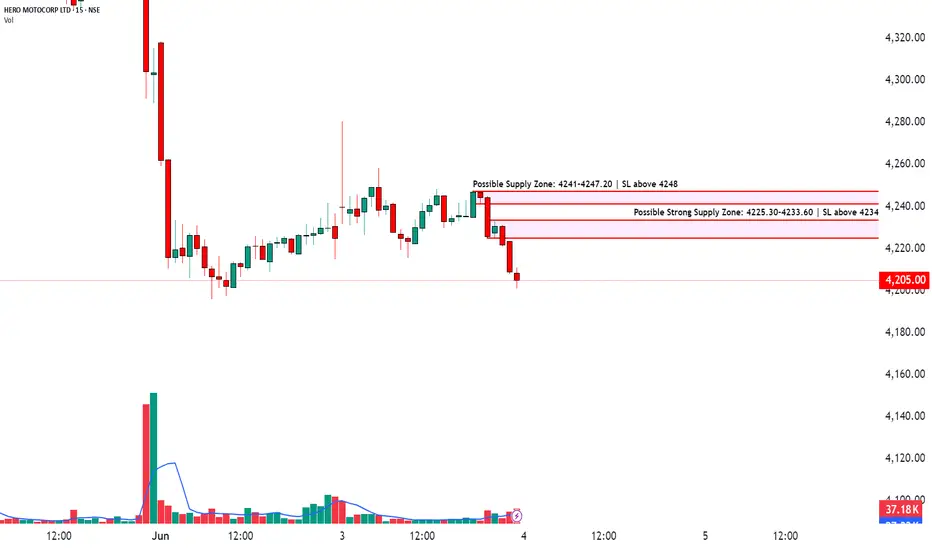
Identify Strong Supply Zones & Set Targets with RRR Logic📈HERO MOTOCORP LTD | 15-Min Chart Analysis
📆Date: June 3, 2025
Ticker: NSE:HEROMOTOCO
Price: ₹4,205.00
Chart Overview:
The chart shows a clear intraday rejection from a key supply zone followed by strong bearish price action. A decisive move below ₹4,220 indicates supply pressure.
Two critical supply zones are marked:
Possible Strong Supply Zone: 4225.30–4233.60 | SL above 4234
Possible Supply Zone: 4241–4247.20 | SL above 4248
Price is currently trading around ₹4,205, just below these zones, signaling a potential continuation of the short-term bearish trend.
Supply Zone Breakdown:
🟥🟥 Strong Supply Zone (4225–4233):
Multiple wick rejections seen previously.
Ideal for aggressive short entries with tight SL above 4234.
🟥 Upper Supply Zone (4241–4247):
Acts as a secondary resistance.
Conservative short traders can consider this zone with SL above 4248.
How to Trade Supply & Demand Zones:
When to Enter (Short Trade from Supply Zone):
Wait for price to retest the supply zone.
Watch for bearish confirmation candles like shooting stars, bearish engulfing, or rejections with volume.
Enter short near the top of the supply zone.
Keep a tight stop-loss just above the zone.
Stop-Loss Placement:
For Strong Supply Zone: SL above ₹4234.
For Higher Supply Zone: SL above ₹4248.
Targets: Book profits at logical RRR levels (1:2 or 1:3 for high probability setups).
Why Use Risk-Reward?
Helps you define targets objectively.
Protects capital with fixed stop-loss logic.
Avoids emotional exits; everything is pre-planned.
⚠️ Risk Management Tip: Always trade with a clearly defined stop loss. Avoid entering positions impulsively. It is advisable to start with a smaller quantity and increase your exposure only if the price action confirms the continuation of the trend. Capital protection should always be the priority.
📢 Disclaimer
This content is created purely for educational and informational purposes. It is not intended as investment advice, stock recommendations, or trading tips. Trading and investing in the stock market involves risk. Please consult with a SEBI-registered financial advisor before making any investment decisions. The author/creator is not registered with SEBI and shall not be held responsible for any losses incurred based on this information. Always do your own research and use proper risk management.
👉 If you found this analysis helpful, don’t forget to Follow, so you never miss out on a trade-worthy setup, breakout opportunity, or valuable educational insight again. Stay updated and trade smarter! 💡📈
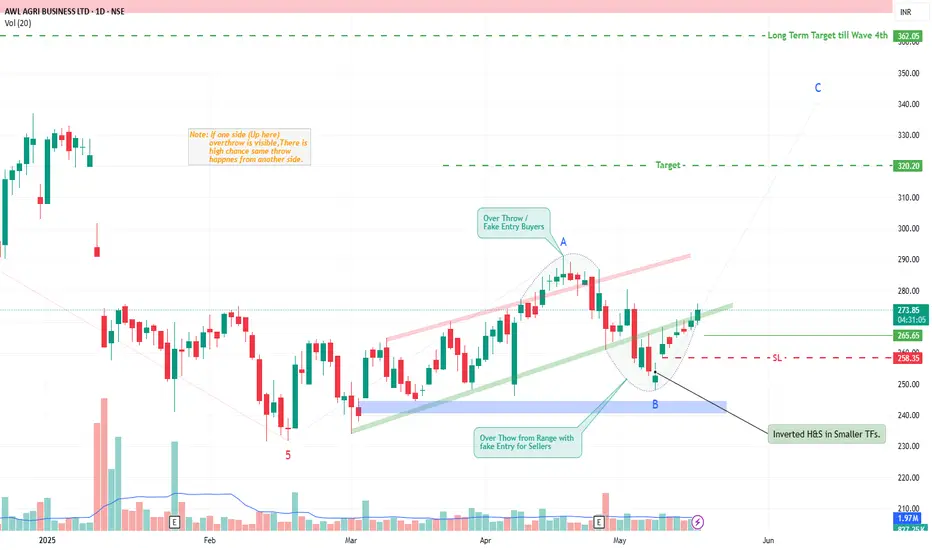
AWL Agri Business By KRS Charts 19th May 2025 / 10:42AM
Why AWL?
1. AWL was in Huge Correction mode after its first high after listed.
2. Correction path is showing clear Wave counts , finished Wave 5 downside and recently it likely in ABC Wave upside.
3. AWL was range bound for quite a time and recently shown upside overthrow (Fake Entry Buyside) from strong range and now likely same overthrow for downside also.
4. Price Action does this when some big move about to come it shakeout both Buyers & Sellers before going for final move.
5. Bullish traits like Inv. H&S and Wave counts , and Bullish Range bound is giving enough conviction to bet on this.
SL & Targets are pinned in Chart.
AWL has low P/E Ratio compared to its Industry.
Wave Count shown in Chart is rough prediction can be varied👍
Long Term Target SL will be 250 Rs.
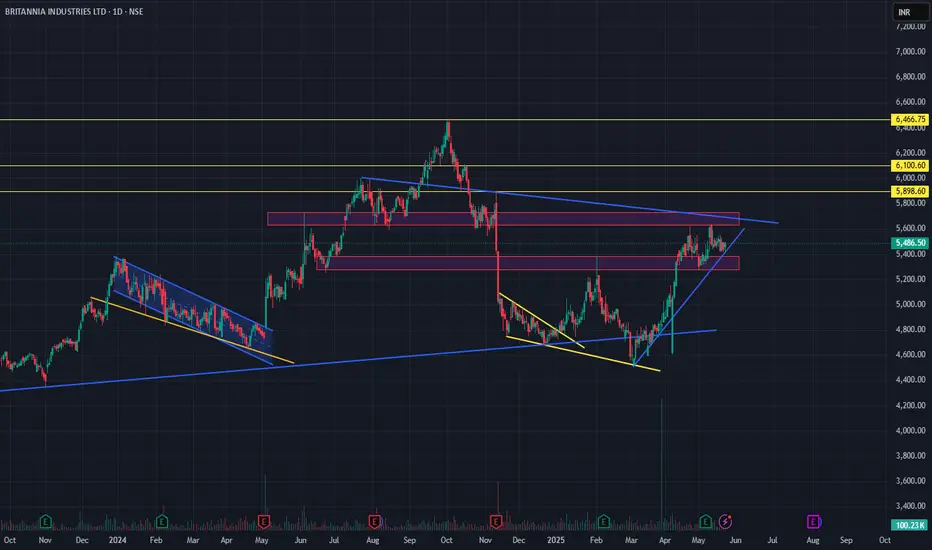
Britannia Industries – Triangle Breakout Loading?NSE: BRITANNIA | CMP: ₹5,486.50 | Timeframe: Daily
Britannia is approaching a crucial symmetrical triangle apex, formed by a long-term descending resistance and a recent ascending trendline. The price is compressing — signaling a potential breakout soon.
🔍 Key Levels:
Resistance: ₹5,890 (triangle top + horizontal zone)
Support: ₹5,280–5,400 (demand zone)
Targets on breakout: ₹6,100 → ₹6,466
📊 Structure Highlights:
Previous falling wedge breakout led to a solid uptrend.
Current price action shows higher lows, indicating strength.
Breakout + volume = bullish confirmation.
🧭 Strategy:
Bullish bias above ₹5,890 with volume.
Watch for invalidation if price breaks below ₹5,280.
📌 Tight consolidation = Big move ahead. Add to watchlist!
Vascon Engineers – Weekly CT BreakoutA clean Weekly CT breakout supported by strong volume (19M+), signaling strength. Key levels and structure:
🔍 Technical Breakdown:
📏 CT Line (White): Clean breakout from weekly closing-based counter-trendline
🕵️ Hidden Line (Dotted White): Secondary hidden resistance cleared
🟧 ₹45.49 Zone: Major gap-up area on DTF – key retracement demand zone
🔵 200 DEMA (Blue Line): Historical resistance now flipped – strength confirmed
🟥 Supply Zone (₹78–₹83): Overhead resistance – long-term target zone
📈 Volume: 🔥 Spiked to 19M+ – highest since Jan ‘24 – confirms breakout strength

Explosive Price Action in Premier Explosives – The Name Says It 🧠 Key Technical Insights:
✅ Main Counter-Trendline (CT) Breakout:
A clean breakout above the white CT line with a strong, high-volume bullish candle. This confirms a reversal of the prior corrective structure.
✅ Hidden Resistance Cleared:
The breakout also pierced a WTF hidden line (dotted white), further validating momentum.
✅ SD Conversion Zone Flip:
The green zone highlights a supply-to-demand flip. Price has respected this zone multiple times and now turned it into strong demand support — a textbook S→D conversion.
✅ Candle Structure:
The breakout candle not only has volume and size, but also follows a healthy higher low structure — signifying smart accumulation.

HEROMOTOCO | Weekly Breakout Analysis📉 Yellow Line — Weekly Counter-Trendline (WTF CT) resistance finally broken with conviction. This line guided the entire downtrend and its breach signals a strong structural shift.
📈 Red Parallel Channel — A hidden resistance channel formed during the recent consolidation phase. Price climbed within this tight range and has now broken out, confirming internal strength and directional intent.
🟧 Orange Horizontal Line — Major Monthly Time Frame (MTF) resistance, which now acts as the next crucial target. The breakout candle has enough space to breathe before testing this overhead level.
⚪ White Dotted Line — Daily Time Frame (DTF) counter-trendline that had already been broken earlier, providing early signs of reversal. Serves as a great precursor to the higher timeframe breakout.
📊 Volume: Weekly breakout accompanied by ~5.57M volume — exceeding the 50K benchmark required for WTF breakout validation. Strong institutional interest is evident.
🟩 Structure: Price has formed a higher low base and broke out cleanly above all marked resistances — a sign of strength across all timeframes.

Big Bank BREAKOUT! Canara Bank Ready📉 Breakdown of the Setup:
✅ WTF CT (White Lines): 3+ confirmed touches → clean descending counter-trendline.
✅ Hidden Resistance (Dotted White Line): Clear breakout above key hidden level. Historic reaction zone.
✅ MTF Resistance (Yellow Line): Long-term resistance just above; nearing test zone (confluence resistance area ahead).
✅ Green Zone (Support/Resistance Flip):
Acted as strong support in 2024.
Fake breakdown trap ✔️
Price back above = bullish bias reinstated.
✅ Volume Surge: 124M+ on breakout candle ➕ major bullish close.

TAJGVK – Bullish Reversal in Play | Swing Targets Ahead
Stock: TAJ GVK HOTELS & RESORTS (NSE: TAJGVK)
Date: May 13, 2025
CMP: ₹407.90 (+12.66%)
🔍 Technical Overview
TAJGVK has shown a strong bullish reversal from a major weekly support zone, indicating a potential end to the corrective structure (A)-(B)-(C) and opening room for a strong upside swing.
📊 Key Levels & Structure
🟧 Weekly Support Zone (₹330.60 – ₹340.00)
Major historical demand zone.
Price reversed sharply from this level, confirming bottom (C).
🔴 Stop Loss (₹369 – Daily Close Basis)
Any daily close below ₹369 invalidates the bullish outlook.
Crucial for risk management.
🎯 First Target: ₹500
Previous resistance zone and psychological level.
Likely to see initial profit booking or consolidation here.
🔄 Interim Pullback Zone: ₹460–₹470
Minor retracement zone before continuation toward second target.
Healthy correction expected before breakout.
✅ Second Swing Target: ₹549 – ₹576
Extension level based on Fibonacci projections.
Strong upside potential if ₹500 is breached with volume.
💡 Trade Plan
Entry Zone: ₹385 – ₹395 (on dips)
Stop Loss: ₹369 (daily close basis)
Targets:
📌 Target 1: ₹500
📌 Target 2: ₹549 – ₹576
Risk-Reward: ✔️ Attractive R:R setup with defined structure.
📌 Conclusion
TAJGVK is presenting a well-structured bullish reversal pattern with clear levels and a favorable entry zone. Strong bounce from weekly support suggests bulls are back in control. This setup is ideal for swing traders looking for a high probability move.
💬 Share your thoughts or similar setups you're watching!
👍 Like & Follow for more technical breakdowns and swing trade ideas!
#TAJGVK #SwingTrading #NSE #TechnicalAnalysis #PriceAction #TrendReversal #StocksToWatch

MAN INDUSTRIES – Explosive CT Breakout with Volume Cluster Surge🔴 CT Breakout: The red trendline marks a major weekly CT, now decisively breached by a strong bullish candle.
📈 Volume Cluster Breakout: This is not a one-week spike — it's a cluster of multiple high-volume weeks, indicating consistent accumulation before the breakout. Current volume stands tall at 2.23M+, validating this move.
🟢 Demand Zones Respected: Price respected key demand zones (green boxes) on multiple occasions, forming a strong base with higher lows.
⚪ Hidden Resistances Cleared: Two dotted white hidden resistance lines have been cleanly taken out, suggesting deeper supply has been absorbed.
🟥 Supply Zone Ahead: The next visible hurdle, giving the current move significant open air to run.

TATA MOTORS – Textbook CT Breakout on Weekly Chart🔍 Key Technical Highlights:
✅ CT Breakout: Clean break above a long-standing counter-trendline drawn from the November 2024 highs. The breakout is decisive, with the latest weekly candle closing convincingly above the CT.
✅ Volume Confirmation: Weekly volume surged to ~9M, confirming strong participation behind the breakout — a critical condition for higher timeframe setups.
✅ Simple Base at 200 EMA: Price formed a simple base right at the 200-week EMA, absorbing selling pressure and building strength before the breakout. This acts as a reliable launchpad, often seen in high-quality setups.
✅ EMA Recovery: The breakout candle reclaims the 200 EMA, a strong sign of trend reversal and institutional interest.

SEQUENT SCIENTIFIC By KRS Charts8th May 2025 / 10:30 AM
Why SEQUENT SCIENTIFIC?
1. Technically it is showing Potential for movement.
2. In Past Already Got More than 50% Returns but important thing is as per Dow Theory it is making Higher Low.
3. In 1D TF multiple Breakouts with Above avg Volume is visible.
4. This is 1M Time Frame , so View is Medium to Long term.
T1 is already Achieved in Past but again after Retracement T1 & T2 will be same as before from current price.

VRL LOGISTICS By KRS Charts19th March 2025 / 11:13 AM
Why VRLLOG?
1. Fundamentally, Good Stock Net profit is the proof further stock is at 45% Discount then its High and Net income is High compared to its price.
2. Technically, Stock has Completed its Correction Wave C with significant Shakeout before going for Breakout as we can see in above chart.
3. On Monthly and Weekly TFs VRLLOG is on its All-Time biggest Support.
4. Reversal is more convicted because 1st Shakeout was Huge for Buyers and 2nd There is potential for Inverted H&S is about to Formed with more upsides from here.
Targets are pinned in Charts with Stop Loss 1D closing Basis.

Glenmark Pharmaceuticals – Breakout**GLENMARK:**
The stock has recently attempted to break above a long-term descending trendline, but today’s rejection suggests a potential pullback.
Key Levels:
• Resistance: Trendline around ₹1,660 , ₹1,776
• Support: Horizontal support at ₹1,445

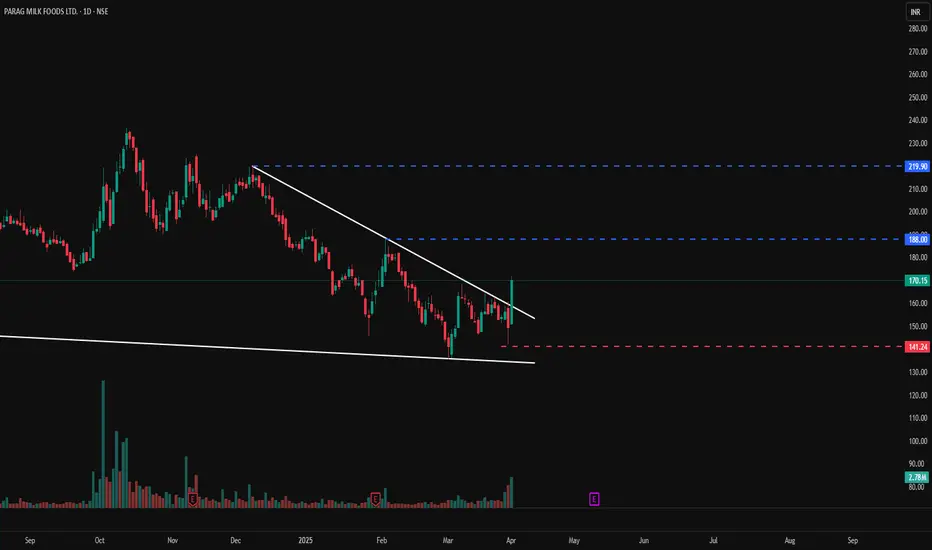
Parag Milk – Breakout**PARAGMILK:**
A one-day breakout has occurred, accompanied by a significant spike in volume.
Key Levels:
• Resistance: Trendline around ₹188.20 , ₹211.75
• Support: Horizontal support at ₹140
Multi time frame Simple analysis on SHKI make educational content videos for swing / positional trading

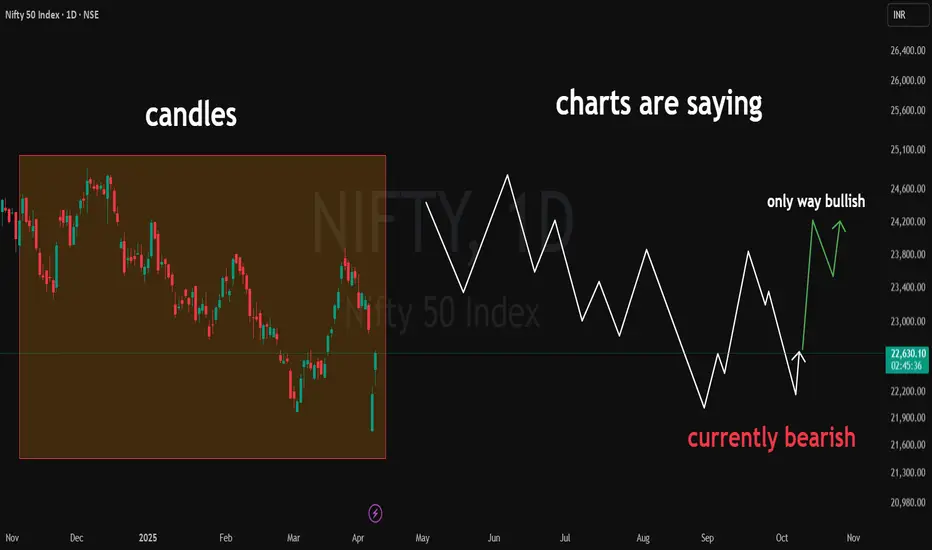
NIFTY 50 – Top-Down Analysis Amidst Tariff TurbulenceWith global markets shaken by Trump’s recent tariff rhetoric, it's time we zoom out and analyze what Nifty 50 is actually saying — from a multi-timeframe lens. Price tells a story, and here's how it's unfolding across the Monthly, Weekly, and Daily charts:
🟩 Monthly Chart (1M) – The Bigger Picture
The macro trend is nearing a critical MTF decision point.
🔁 This is the make-or-break zone for the larger structure.
🟥 Weekly Chart (1W) – Bearish Momentum Still in Play
Structure is currently bearish, with lower highs and lower lows.
🧠 Key Thought: Don’t assume trend change without structure breaking clearly.
🟧 Daily Chart (1D) – Battle Zone
Price action is noisy but insightful.
We have a potential bullish scenario unfolding — but it’s fragile
Only bullish structure is if price defends recent lows and breaks above resistance in a clean impulse-retrace-impulse fashion.
Despite external triggers like Trump’s tariff announcements, the technical structure across timeframes is telling us one thing:
⚠️ “No bias until structure confirms.”
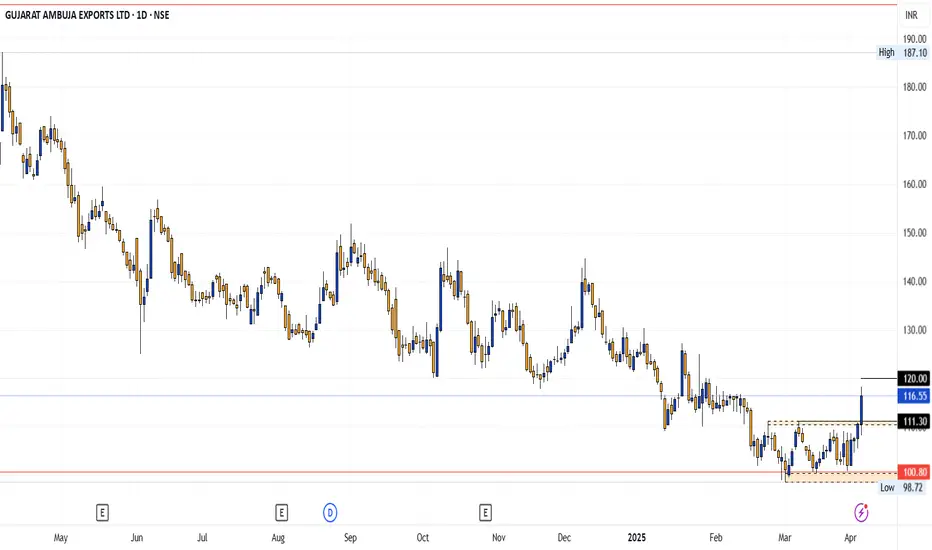
GAEL Stock Alert: Strong Setup After Days of SilenceGujarat Ambuja Exports Ltd (GAEL)
Current Market Price (CMP) : ₹116
Buy Level: Above ₹120
Add on Break Above: ₹120, with further additions up to ₹111
Stop Loss (SL): ₹96 (Weekly Closing Basis)
After a prolonged decline, Gujarat Ambuja Exports Ltd (GAEL) has shown promising movement following a substantial consolidation phase. This presents an opportune moment to consider a position in this stock. Here’s why:
Technical Analysis: GAEL has recently emerged from a significant consolidation period, indicating potential bullish momentum ahead. The buy signal triggers once the stock surpasses ₹120, with an option to accumulate additional positions as it continues above this level, targeting up to ₹111.
Investment Strategy: Positioning for the uptrend after consolidation suggests a favorable risk-reward ratio, with ₹96 serving as a critical stop-loss level on a weekly closing basis. This strategy aims to capitalize on the anticipated upward movement while effectively managing downside risk.
Conclusion: With GAEL poised for a potential breakout following a period of consolidation, this recommendation aligns with a strategic approach to capitalize on emerging market trends. Investors looking to leverage technical indicators and market sentiment can consider initiating positions above ₹120 with prudent risk management through the specified stop-loss level.
By leveraging this opportunity, investors can potentially benefit from the anticipated bullish movement in Gujarat Ambuja Exports Ltd (GAEL), making informed decisions based on market dynamics and technical analysis.
Disclaimer: This recommendation is based on technical analysis and market trends. Investors are advised to conduct their research and consider their risk tolerance before making investment decisions.
Feel free to adjust your strategy according to your investment goals and risk appetite. Happy investing!
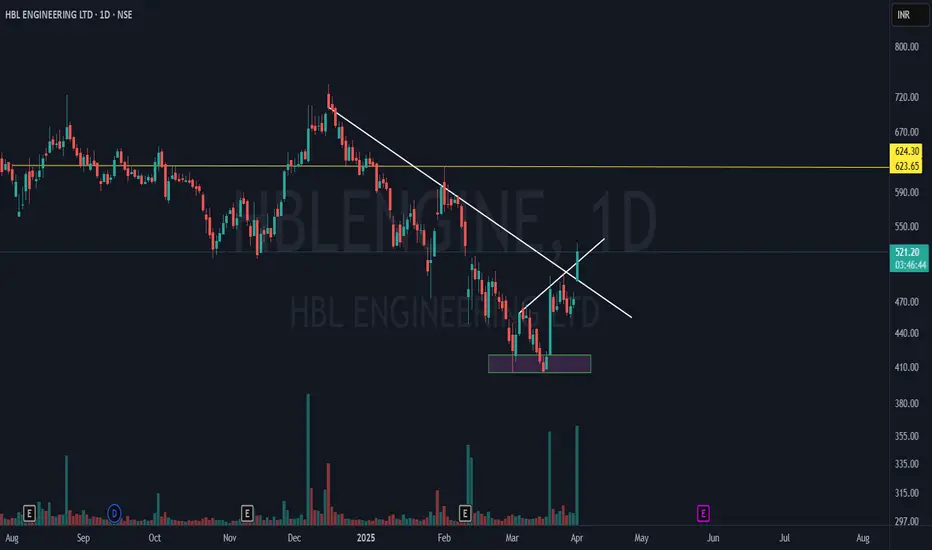
Hbl Engineering | Multi-Timeframe Breakout & Hidden Hurdles📈 Stock: HBL ENGINEERING LTD (NSE)
💰 CMP: ₹520.10 (+10.07%) - While making this Post
Key Highlights:
✅ Breakaway Gap: Opened above Critical Trendline (CT) resistance, confirming strength.
✅ Hidden Hurdle Cleared: The smaller trendline helped identify fakeouts vs. real breakouts.
✅ Strong Volume: High buying interest signals institutional participation.
✅ Next Resistance: ₹624.30 (MTF Hurdle) – a key level to watch.
🚀 Now watch for follow-through! Thoughts? Drop them below! 👇
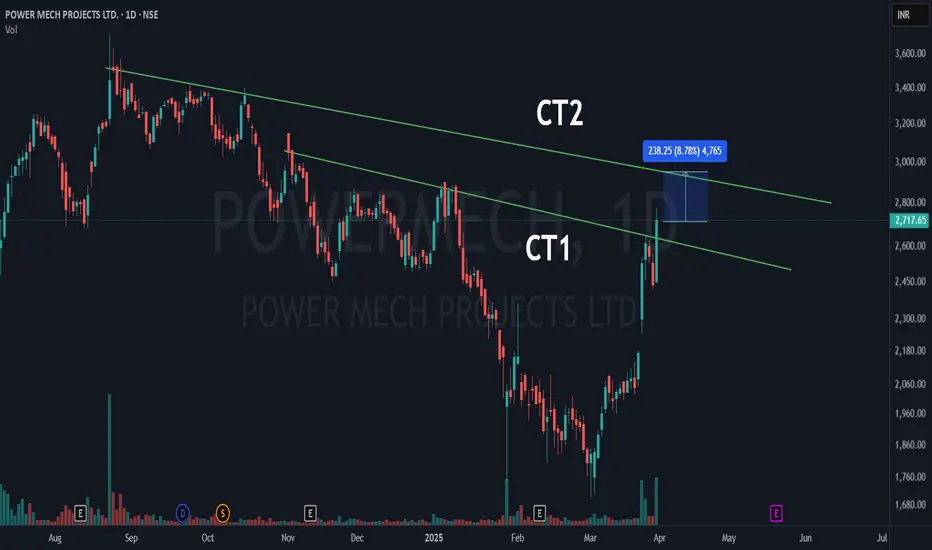
power mech projects ltd | unique DTF trade setup unfolding!📌 counter trendline 1 (ct1) – The first counter trendline (marked in green) has been successfully broken, indicating an early breakout and a shift in trend.
📌 counter trendline 2 (ct2) – The second counter trendline is the next key resistance. If the stock clears this level.
📌 two patterns in play – One pattern has already seen a breakout, while the second pattern’s resistance (ct2) still holds .
📊 volume confirmation – Increased volume supports the breakout, indicating strong participation from buyers.
Will ct2 break, or will it act as a resistance? 🤔📈
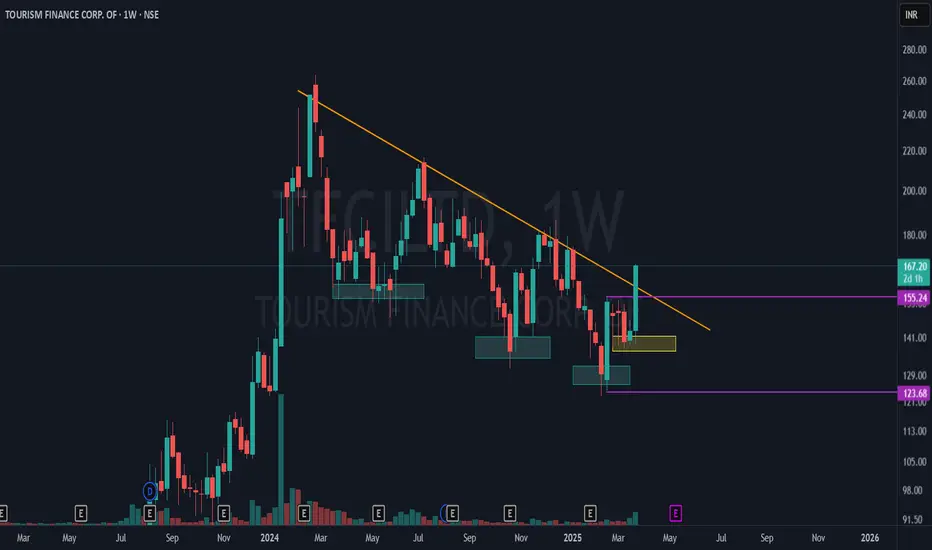
Tourism Finance Corp - Major Breakout in Progress!TFCI is showing a significant market structure shift on the weekly time frame (WTF) with strong confluence of technical signals! 📊
🔹 Lower Lows to Higher Low Transition:
Blue boxes indicate a series of lower lows, reflecting a prior downtrend.
The yellow box highlights a higher low, signaling a potential trend reversal!
🔹 Mother Candle Breakout:
The purple lines mark the high and low of the mother bar (key range).
Price is now breaking out from the upper side of the mother candle, confirming bullish momentum.
🔹 Counter Trendline (CTL) Breakout:
The orange line represents the main CTL on the weekly timeframe.
Price is successfully breaking out, indicating a potential trend shift to bullish!
Comment below your thoughts
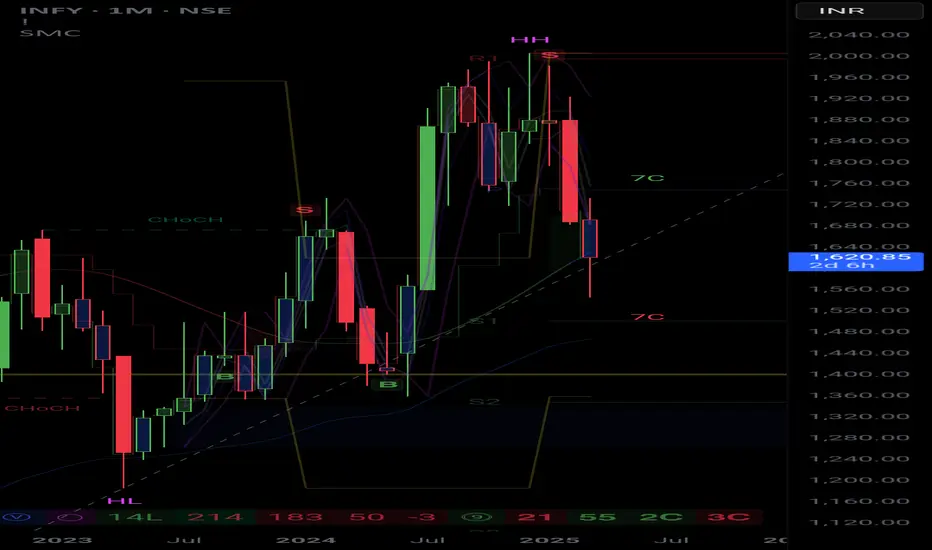
Infosys (INFY) Stock Forecast – March 2025Infosys (INFY) Stock Forecast – March 2025
Current Price: ₹1,619.50
Timeframe: Monthly Chart (1M)
Technical Analysis & Forecast
1. Trendline Support: The stock is currently testing a key trendline support on the monthly chart.
2. Breakdown Possibility: If INFY closes below this trendline, it may head towards the ₹1,400 level, aligning with the S2 support zone.
3. Resistance Levels: The recent rejection from ₹1,850-1,900 suggests strong selling pressure at those levels.
4. Market Structure:
Lower highs (LH) formation indicates a possible bearish continuation.
Change of character (ChoCH) signals uncertainty in trend direction.
5. Indicators:
Moving Averages: INFY is testing its long-term moving averages. A break below these could accelerate the downside.
Volume & Momentum: Selling pressure has increased, and bulls need to reclaim key resistance levels for a recovery.
My View
INFY is taking trendline support this month. If this support is broken, we can expect ₹1,400 as the next downside target. However, if buyers defend this level, a rebound towards ₹1,750 is possible.
Disclaimer
This analysis is for educational and informational purposes only. It is not financial advice. Please conduct your own research or consult with a professional before making any trading decisions.
2 Amazing swing trading ideas | Simple Price action I make educational content on swing / positional trading
