PVR INOX – Symmetrical Triangle Breakout | July 2025📊 PVR INOX – Symmetrical Triangle Breakout | July 2025
A potential breakout setup is forming on both the daily and weekly charts in PVR INOX:
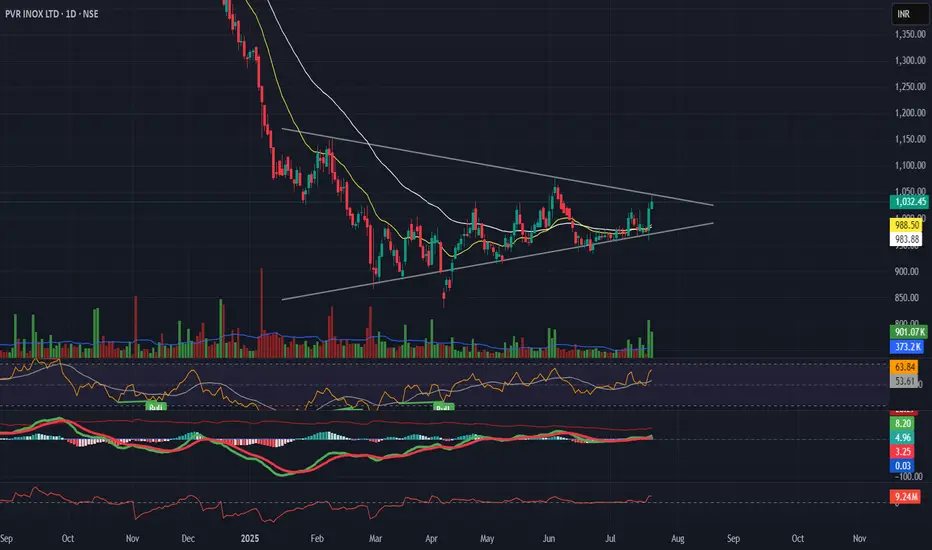
🔹 Structure: Symmetrical triangle on both timeframes, showing price contraction near ₹1040
🔹 Momentum: RSI holding above 50, MACD turning positive
🔹 Volume Spike: Breakout supported by increasing volume
🔹 Sector Rotation: Media & Entertainment sector showing improving relative strength
🔹 Macro Narrative: Theme of rising screen expansion + easing inflation supports business growth
---
📌 Strategy Overview:
• Entry on breakout above ₹1040
• Target 1: ₹1080
• Target 2: ₹1126
• Stop-loss: ₹955 (below pattern support)
Timeframes Aligned:
Weekly: Structure intact with price near resistance
Daily: Ready for breakout
Hourly: Momentum building near apex
---
🧠 Conclusion:
A multi-timeframe setup with technical + narrative alignment. Watch for confirmation with strong candle + above-average volume.
Nsestocks
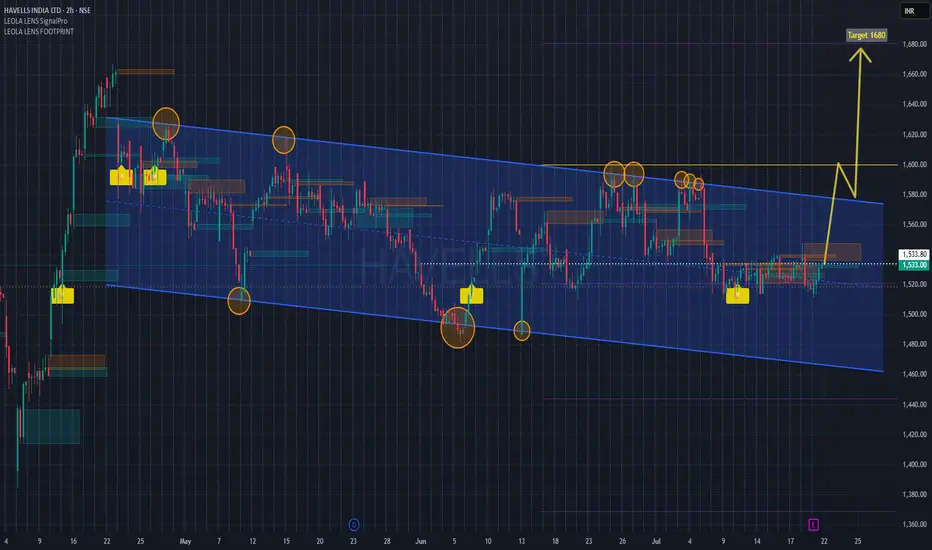
HAVELLS Channel Breakout Setup with Earnings Ahead Havells is approaching a crucial resistance trendline within a well-defined downward sloping channel. Price currently tests mid-channel and historical supply zones, with multiple Leola Lens SignalPro yellow caution labels plotted—historically seen before directional reversals.
📌 Structure Highlights:
Clear channel formation since April
Multiple resistance rejections near 1580 zone
Buy interest seen near lower boundary with SignalPro confirmation
Breakout projection suggests target zone near 1680, aligning with prior volume gap
📅 Earnings event likely to be a catalyst. Monitor price behavior post-results for potential breakout confirmation above 1580.
🧠 Leola Lens™ SignalPro Notes:
Yellow caution labels have repeatedly appeared near key turning points within the channel, suggesting possible trend transition zones. These zones highlight moments of institutional activity, where smart money behavior often shifts.
The yellow caution markers indicate potential trend change zones, based on historical conditions where price has shown institutional interest or liquidity shifts. These zones are not direct buy/sell signals, but highlight areas to monitor closely for structural confirmation.
🧠 This chart is intended for educational and structural analysis only. No financial advice.
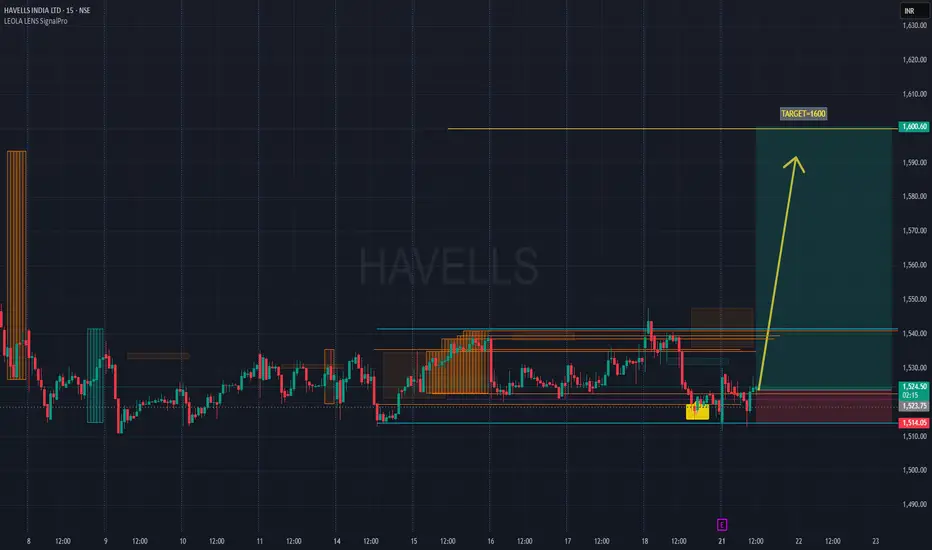
HAVELLS Pre-Result Reversal Watch I Holds for Potential 1600Chart Type: 15-minute | Tool Used: Leola Lens SignalPro
Price action has rebounded from a key liquidity zone (highlighted yellow) with visible accumulation below ₹1,520.
Key Observations:
Price retested prior demand zone (marked by SignalPro with structure and volume signals).
Potential bottom formation visible intraday with higher low attempt post 12 PM.
Rejection of downside wick near ₹1,514, aligning with earlier liquidity pockets.
Idea View:
If price sustains above ₹1,525–₹1,530, possible momentum expansion toward resistance zone at ₹1,600.60.
Clean structure break above previous order blocks may attract trend traders.
Result-based volatility expected — manage risk, especially with expected earnings post-market today.
Risk Reference Zone:
Invalid below ₹1,510 (red shaded zone)
This is not financial advice. Chart is for educational and structural reference only.
#HAVELLS #PriceAction #ChartAnalysis #MarketStructure #SignalPro #LiquidityZones #TechnicalAnalysis #TrendReversal #NSEStocks #EarningsSetup
BHARAT FORGE LTD. – INTRADAY ZONE ANALYSIS________________________________________________________________________________
📈 BHARAT FORGE LTD. – INTRADAY ZONE ANALYSIS
📆 Date: July 1, 2025 | ⏱ Timeframe: 15-Minute Chart
🔍 Educational Breakdown – For Learning & Study Use Only
________________________________________________________________________________
🔹 Price Action Zones
🔴 Top Range(Resistance): 1324.50
🟢 Bottom Range(Support): ₹1270
⚪ No Trade Zone: Mid-range, no clear directional bias
________________________________________________________________________________
🧩 Chart Pattern: No
There is no visible or marked chart pattern (e.g., flag, triangle, head and shoulders) on the chart.
________________________________________________________________________________
🔁 Reversal Candlestick Patterns:
🔴 Top Range: No visible reversal candle pattern at the supply zone on this chart snapshot, but the area has been marked for potential rejection.
🟢 Bottom Range: No textbook reversal candlestick (like pin bar, hammer, or engulfing) is clearly visible at ₹1270. However, the price bounced strongly from this level, indicating possible short-term support or buyer interest.
________________________________________________________________________________
🧠 1. Trade Plan (Based on Reason and Logic)
🔼 Bullish Trade:
Idea: If price retests ₹1270 and forms a bullish structure (strong bullish candle, reversal candles, volume support, long wick)
Stop Loss: Below ₹1269
Risk-Reward: 1:1 | 1:2+
Logic: you need to give an actual logic to this
________________________________________________________________________________
🔽 Bearish Trade:
Idea: If price rejects 1324.50 and forms a bearish structure (strong bearish candle, reversal candles, volume support, long wick)
Stop Loss: ₹1325
Risk-Reward: 1:1 | 1:2+
Logic: Historically rejected area as marked on chart.
________________________________________________________________________________
📦 2. Trade Plan Based on Demand/Supply Zones
🟥 Supply Zone Trade:
Zone: ₹1293.30 – ₹1299.90
SL: ₹1301.45
Plan: Trade the Supply Zone (only on rejection confirmation)
Risk-Reward: 1:1 | 1:2+
🟩 Demand Zone: No defined demand zone.
________________________________________________________________________________
📌 Disclaimer
This analysis is shared for educational and study purposes only. It does not constitute investment advice. The author is not SEBI-registered. Please consult a SEBI-registered advisor before making trading decisions. Always use proper risk management and trade only with confirmation.
________________________________________________________________________________
💬 Comments
What’s your view on Bharat Forge?
Will it reject from the supply zone or hold the bottom range?
Share your charts or thoughts below 👇
________________________________________________________________________________

Weekly CT & Hiddenline Cracked – Supply/Demand Zones In PlayThis weekly chart shows a well-defined price structure shaped around multi-timeframe supply and demand dynamics:
🟩 Green Zone – Broad demand zone, price has respected this area multiple times recently.
🟥 Red Zone – Long-standing WTF supply zone, tested multiple times in the past.
⚪️ White Solid Line – Active CT (corrective trendline), which has been broken cleanly on this week’s candle. Being a weekly close (Friday), the breakout carries more weight.
⚪️ Dotted White Line – A hidden resistance trendline, possibly acting as a confluence level for prior rejections. That too has been convincingly breached.
📊 Notice the strong volume spike on the breakout – always worth watching in a structure like this.
🔁 No predictions. Not a call. Just chart structure and context.

Trent Price Action Decoded – Simplicity Wins!No calls, no forecasting — just pure price action. In this post, I’m simply sharing how I see Trent’s chart. Clean structure, organic movement, and a simple approach to reading the price. For those who enjoy observing the market without noise or bias.

4 Stocks. 4 Stories. Here's How I See Them Without Predictions..Purely chart-based view. No bias. No advice. Just how I interpret these right now
I make educational content videos on Swing trading .

INDIAN TELEPHONE INDUSTRIED LTD - NSE | Daily Chart📊 INDIAN TELEPHONE INDUSTRIES LTD (ITI) – NSE | Daily Chart
📅 Date: May 28, 2025
📈 Current Price: ₹309.25 (+9.99%)
📌 Ticker: NSE:ITI
🧠 Technical Analysis Overview
✅ Cup & Handle Breakout 🍵📈
Price action has formed a classic Cup & Handle pattern — a bullish continuation setup indicating a potential uptrend continuation. The breakout is confirmed with a strong bullish candle and significant volume surge today.
✅ Volume Confirmation 📊
Today’s breakout above the ₹288 resistance comes with massive volume (~11.6M), validating strong buyer interest and momentum behind the move.
📍 Key Price Levels
📌 Breakout Level:
✅ ₹288.05 (Previous resistance flipped into support)
📌 Immediate Resistance / Targets
🎯 ₹340 – ₹360 (Short-term target based on pattern projection)
🎯 ₹400+ (Medium-term upside potential if momentum sustains)
📌 Support
🟨 ₹288 (Breakout retest zone)
🟥 ₹270 (Handle support)
📈 Trade Idea
Breakout Entry: ₹290–₹305
Retest Entry: Near ₹288 (if price revisits)
Stop Loss: Below ₹270
Target 1: ₹340
Target 2: ₹360
Target 3: ₹400
⚠️ Disclaimer
This chart analysis is for educational and informational purposes only. Not financial advice. Always do your own research before investing.

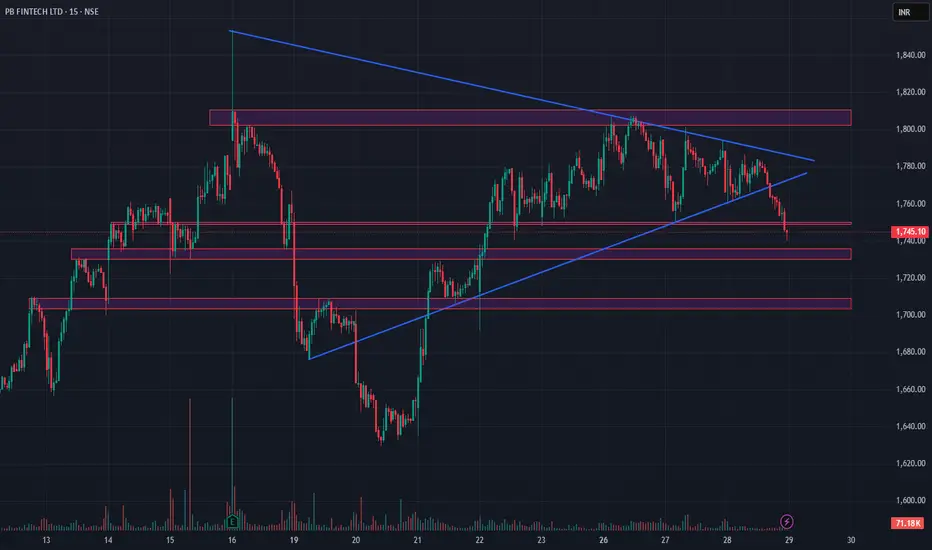
POLICYBZR — Triangle Breakdown + OI Clues = Short Bias?🧠 Breakdown: Symmetrical Triangle Breach + OI Data
PB Fintech has broken down from a well-formed symmetrical triangle, signaling a likely continuation of the bearish trend that started post-₹1,820 rejection.
🔻 Breakdown below trendline support confirms sellers are in control short term.
📐 Chart Structure Recap
Price formed a symmetrical triangle since mid-May.
Multiple support rejections along an ascending trendline.
Today, price convincingly broke down below ₹1,750–₹1,740, with volume spike confirmation.
Now trading near crucial support clusters, visible from past demand zones.
📊 OI Zones (Monthly Expiry)
🔺 Resistance:
₹1,780–₹1,800: Major call writing zone.
₹1,760: Added call writers post-breakdown.
🟢 Support:
₹1,740–₹1,720: Price hovering here — must hold.
₹1,700–₹1,680: Next significant put OI base.
₹1,660–₹1,620: Last buyer defense zone.
📌 Trade Plan (Short-Term View)
🔻 Bearish Setup (Short Bias):
• Entry: On breakdown retest near ₹1,745–₹1,750
• Stop Loss: Above ₹1,765
• Targets: ₹1,720 → ₹1,700
🔺 Bullish Setup (Reversal Possibility):
• Entry: On strong reclaim and hold above ₹1,760
• Stop Loss: Below ₹1,740
• Targets: ₹1,780 → ₹1,800
🎯 Summary
With both price action (triangle breakdown) and OI shifts (fresh calls at highs) aligning, PB Fintech may see further downside if it fails to reclaim the ₹1,745–₹1,750 zone quickly.
This is a great confluence case for intraday or short-swing setups. Patience for either a retest-reject or a reclaim-confirm will be key.
Bharat Dynamics Ltd (BDL)🚀 BDL - Technical Breakout in Play!
Weekly breakout above key resistance zone 🔥
Pattern: Double Bottom ➕ Break of Monthly Mother Candle High
Potential Upside:
🎯 Target 1: ₹1968.50
🎯 Target 2: ₹2590.00

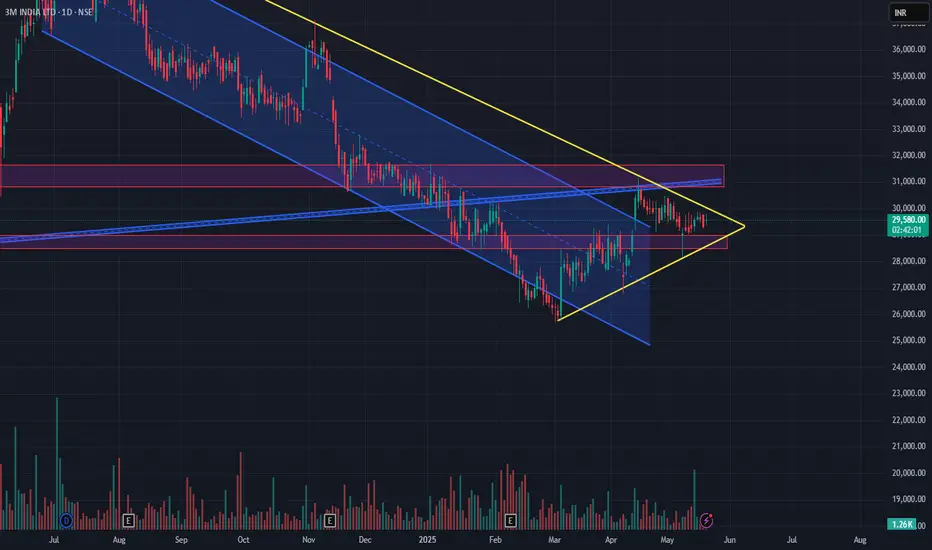
3MINDIA at Breakout Crossroads📅 Chart Type: Daily
📉 Structure Observed: Downtrend Channel → Breakout Attempt → Symmetrical Triangle
📌 Current Price: ₹29,620
🔍 Chart Analysis Summary:
3M India has been under a prolonged downtrend since mid-2023, clearly respecting the falling channel (highlighted in blue). However, since March 2025, a base seems to be forming, and price action has converged into a symmetrical triangle pattern (yellow lines), signaling a potential breakout.
💥 Trade Ideas
✅ Long Trade (High Risk, High Reward):
If price decisively breaks out above the triangle resistance (~₹30,000+), it could be the first real sign of trend reversal after months of weakness. Potential targets could be:
₹31,200 (resistance zone)
₹33,500+ (previous swing highs)
Stop-loss: Below ₹28,800 (lower triangle boundary)
Risk: Moderate-High (False breakout possibility due to low volume)
⚠️ Risky Trade:
Given the triangle formation at the end of a downtrend, this could also be a bearish continuation pattern. A fake breakout followed by rejection could trap bulls.
💡 Avoid trading until confirmation (volume spike + close above resistance or breakdown)
📉 Short Trade:
If price breaks below ₹28,800 with volume, the stock could revisit:
₹27,000 (March support)
₹25,000 (channel support retest)
Stop-loss: ₹30,100 (triangle resistance)
Risk: Medium
Reward: High if channel resumes downward
🔁 Swing Trade Perspective:
This setup is ideal for swing traders who thrive on breakouts or breakdowns from tight consolidations.
📈 Breakout Swing: Enter above ₹30,000 with target ₹33,500
📉 Breakdown Swing: Enter below ₹28,800 with target ₹25,000
🧠 Wait for confirmation candle (daily close + volume) before entry.
📌 Key Zones to Watch:
Resistance: ₹30,000 – ₹31,200
Support: ₹28,800, ₹27,000
Volume Spike: Needed to confirm move direction
🧠 Final Thoughts:
This is a make-or-break level for 3M India. Traders should be cautious but alert. Whether you're bullish or bearish, this consolidation is unlikely to last much longer — and a sharp move is imminent.
"In the market, the biggest profits often come from waiting for the right setup. This might be one."
📉💰 Trade responsibly. Always manage your risk.
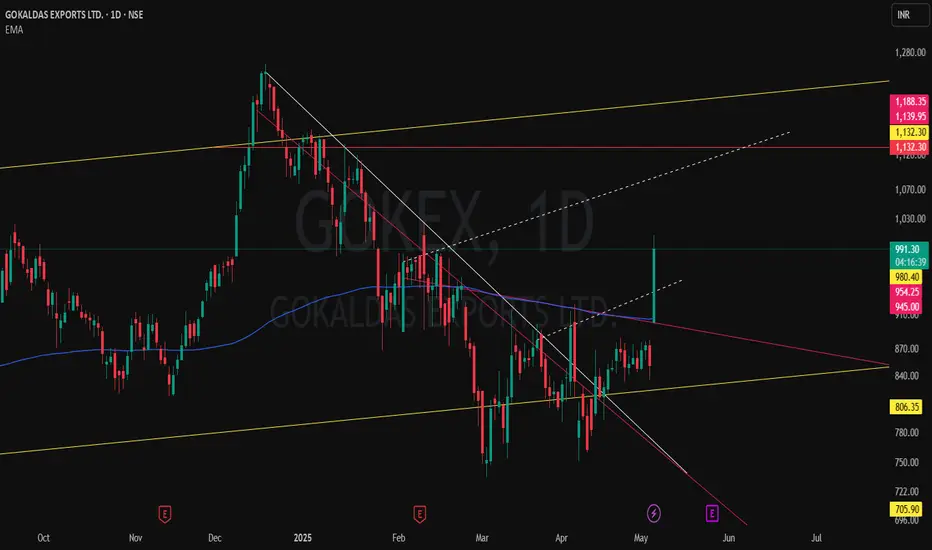
Massive Breakout Loading? GOKEX Smashes Through Triple TimeframeGOKALDAS EXPORTS LTD (GOKEX) is showing serious strength with a powerful breakout candle currently in play – but the real story is the multi-timeframe technical alignment:
📏 MTF Structure
Yellow Parallel Channel from Monthly shows a long-term structure still intact.
Red Horizontal Resistance marks the previous MTF peak – now under threat.
🔻 WTF Pressure
Pink Counter-Trendlines acted as significant resistance on the Weekly – both pierced.
⚡ DTF Precision
White CT Line (Daily) finally broken with conviction.
Dotted White Lines reveal multiple hidden resistances — all cleanly taken out by today's surge.
📊 Volume & Candle Strength
Volume spiking, price up over 16% intraday — just waiting on confirmation at close.
🧠 Watch Closely: A close above today’s highs could flip this into a full-blown A+ breakout setup.
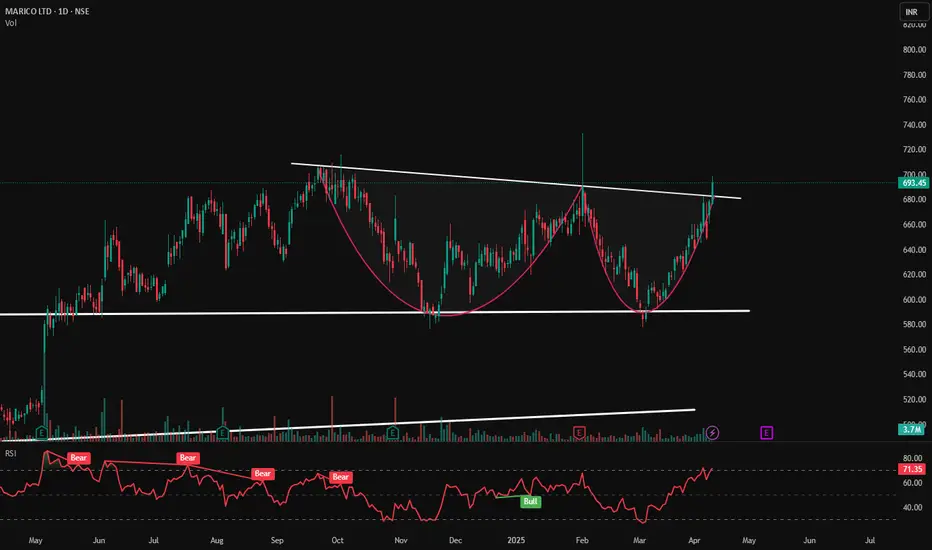
Marico Ltd- Cup & Handle Breakout Forming?Marico Ltd.—Cup & Handle Breakout Forming? ☕️📈
📆 Date: April 10, 2025
📊 Chart Analysis:
Marico is showing a classic "cup & handle" pattern, a bullish continuation setup. The price has successfully broken above the neckline resistance, indicating a potential for upward continuation if volume sustains.
📌 Key Levels:
🛑 Resistance (neckline—now flipped to support): ₹685
✅ Support (Base of Cup): ₹580
🔼 Immediate Resistance Targets: ₹710 ➡️ ₹735 ➡️ ₹765
📈 Indicators & Technicals:
☕ Cup & Handle Pattern clearly visible with a rounded bottom and breakout above resistance.
🔍 RSI at 71.35 shows bullish momentum but is slightly overbought —a sign of strength with caution.
💹 Volume steadily increasing — confirms accumulation phase and breakout intent.
🟥 Multiple "Bear" RSI icons (prior weakness) followed by a ✅ "Bull" label hinting at a momentum shift.
📉 Bearish divergence in RSI is now getting invalidated by price strength and pattern breakout.
🧠 Trade Plan:
📌 Entry near ₹685–₹695 breakout zone
🎯 Targets: ₹710 ➡️ ₹735 ➡️ ₹765
❌ SL: ₹670 (below neckline)
📌 Disclaimer: For educational purposes only. Do your own research or consult with a SEBI-registered advisor before trading or investing
Hindustan Foods Ltd-Symmetrical Triangle Breakout!Hindustan Foods Ltd.—Symmetrical Triangle Breakout! 🚀📈
📅 Published on: April 12, 2025
📊 Chart Insight:
HNDFDS has broken out of a well-formed symmetrical triangle pattern on the daily chart, signaling a potential bullish continuation. The breakout is accompanied by a solid green candle and volume surge, hinting at strong momentum ahead.
🔍 Key Technical Highlights:
🔺 Pattern: Symmetrical Triangle (Lower highs + Higher lows)
📏 Breakout Level: ₹560
📈 Current Price: ₹571.65 (+4.03%)
📊 Volume Spike: 109.28K—a notable increase compared to recent sessions
📌 Support & Resistance Levels:
Immediate Support: ₹560 (breakout level)
Next Support (lower trendline): ₹530
Resistance Levels to Watch:
₹586 (minor supply zone)
₹615
₹645 (swing high)
📉 RSI Indicator:
Current RSI: 60.40—strong upward move, not yet overbought
Hidden Bullish Divergence (visible on chart): RSI made higher lows while price was consolidating—early bullish signal
Bearish markers now invalidated post-breakout
🧠 Trade Idea / Strategy:
📥 Buy on dips near ₹560–₹565 if price retests breakout
🛑 Stop-loss: ₹530 (below ascending trendline)
🎯 Targets: ₹586 ➡ ₹615 ➡ ₹645
📘 Note: Triangle breakouts typically indicate strong price movement after consolidation. Volume confirmation adds conviction.
🔔 Disclaimer: This chart is for educational purposes only. Do your own analysis or consult a financial advisor before investing.

RBL Bank Ltd- Range Breakout + Trendline Break!RBL Bank Range Breakout + Trendline Break! 💥🚀
📅 Published on: April 16, 2025
📊 Chart Insight:
RBLBANK has given a dual breakout—piercing above a long-standing descending trendline and breaking out of a rectangle consolidation zone. This combo setup indicates a potential trend reversal or continuation rally from here on.
🔍 Technical Highlights:
🔺 Pattern: Rectangle range breakout + descending trendline breakout
🟪 Consolidation Range: ₹148–₹178 (marked in purple)
📈 Breakout Candle Close: ₹181.57
📊 Volume Surge: 218.23K—strong bullish confirmation
📌 Support & Resistance Levels:
🟢 Immediate Support: ₹178 (top of the rectangle zone)
🟢 Next Strong Support: ₹164 (middle of the rectangle)
🔴 Resistance Levels to Watch:
₹188 (trendline zone retest)
₹198
₹212 (gap fill level)
📈 Trendline Analysis:
Price has broken above the major descending trendline from April 2024 highs.
This trendline had been acting as dynamic resistance and is now a potential trend shifter.
🧠 Trade Idea/Strategy:
💹 Entry: Near ₹178–₹181 (post-breakout retest ideal)
🛑 Stop-loss: Below ₹164
🎯 Targets: ₹188 ➡ ₹198 ➡ ₹212
📍 Visual Indicators Used:
✅ Rectangle drawn to capture sideways accumulation
✅ Trendline from previous highs marking resistance
✅ Volume spike indicating strong buying interest
📘 Note: Multiple timeframe confirmation is advised. Volume and structure align well with bullish bias.
🔔 Disclaimer: Educational post only. Always do your own research or consult with a SEBI-registered advisor

Sunday Swings 20 April 2025 | Stocks and NiftyI make educational content videos for swing / positional trading
No Tips, calls or any future Predictions are done in the video, just sharing what the charts are talking .

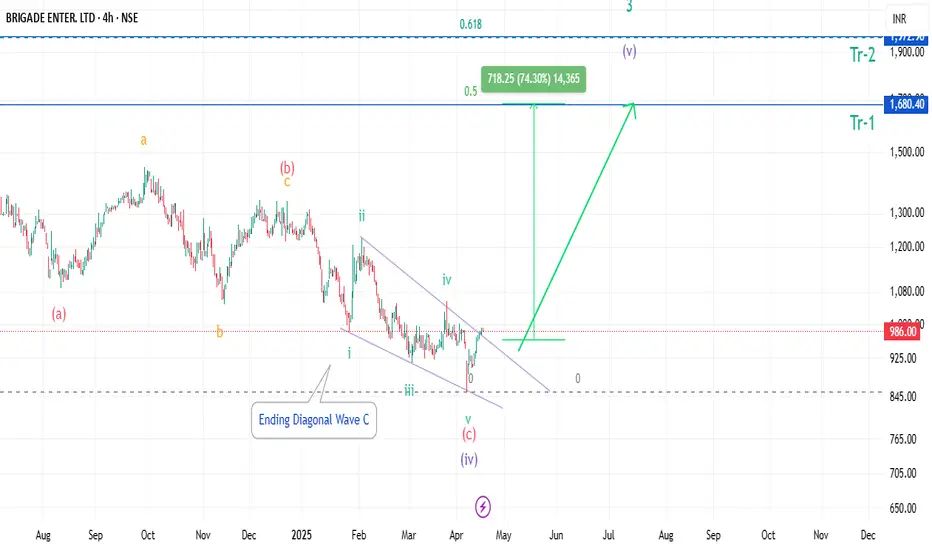
Brigade Ent falling wedge Breakout.Brigade Enterprises has made a falling wedge or ending Diagonal pattern, its near breakout. As per Elliott wave the Correction looks Complete, good for short-term Buy,
This Idea is shared purely on Technical basis,
Fundamental parameters are not considered,
take entry on your own risk.
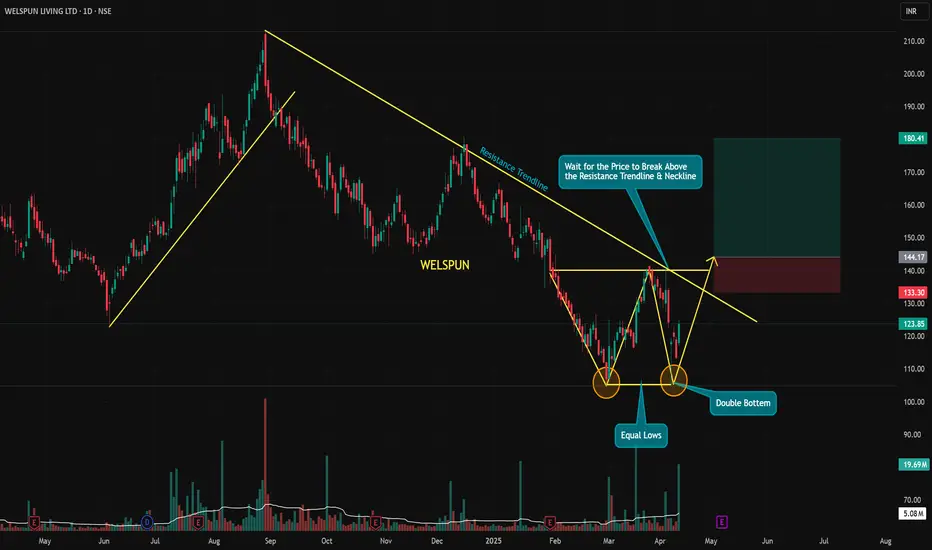
WELSPUN – Double Bottom Reversal with Trendline ConfluenceSetup Type: Reversal + Breakout | Conviction: Medium (Confirmation Needed)
Chart Framework: Price Action + Chart Patterns
WELSPUN is printing a strong bullish reversal structure, supported by both horizontal and diagonal resistance levels:
🟡 Double Bottom at Equal Lows – Classic reversal base forming after a downtrend.
📏 Equal Lows Liquidity Grab – Smart money may have hunted stops before pivoting.
🟢 Massive Volume Spike – Indicates strong interest building up.
📐 Bearish Trendline Resistance + Neckline acting as key breakout zones.
🧠 Trade Plan:
🕒 Wait for breakout above ₹133–135 zone (neckline + trendline overlap).
📍 Entry Confirmation = Daily close above ₹135 with strong volume.
🎯 Target = ₹180+ based on measured move from the pattern.
💡 High-Probability Trigger: Once the neckline breaks, momentum buyers will likely step in. Confluence of trendline + structure gives this trade extra juice.
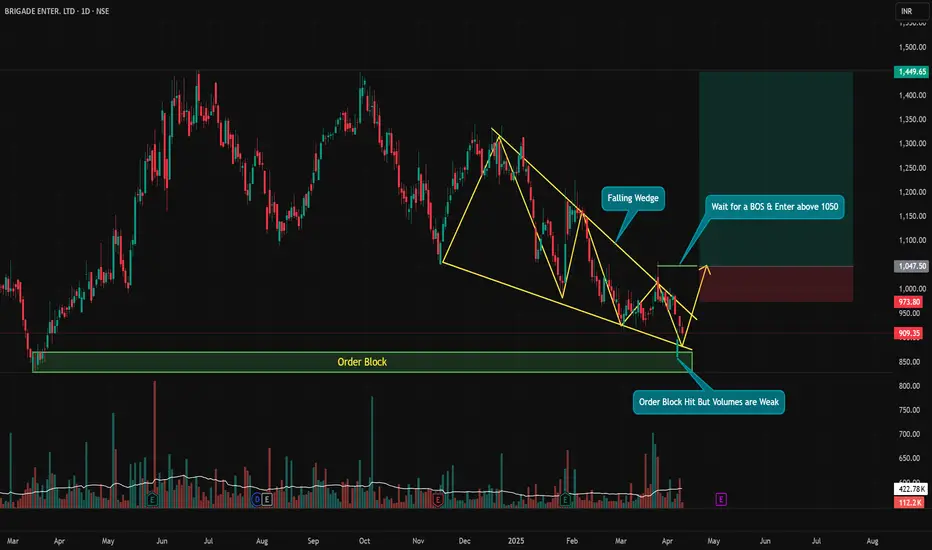
BRIGADE – Falling Wedge at Demand Zone, Waiting for BOSSetup Type: Reversal + Breakout Play | Conviction: Medium-High (Needs Confirmation)
Chart Framework: Smart Money + Classic TA
BRIGADE is showing signs of a potential trend reversal, but we’re not jumping in yet. Here's what the chart tells us:
🟡 Falling Wedge Formation – A bullish reversal pattern that typically resolves to the upside.
🟢 Tapped into a Strong Order Block – Smart money territory where previous accumulation took place.
🧲 Liquidity Grab Below Prior Lows, but... Volume on Bounce is Weak – Sign of caution.
📢 Analyst Rating: STRONG BUY – Adds institutional bias to the bullish setup.
🔐 No Confirmed Break of Structure Yet – Enter only after a clean breakout above ₹1050.
📈 Trade Plan:
Wait for a strong BOS (Break of Structure) and price closing above ₹1050 with volume.
Target zone near ₹1440+ aligns with measured move of wedge and previous supply.
⚠️ This is a setup with potential, but it’s not “ready” yet. Don't front-run smart money — let price confirm before jumping in. Risk management is a must.
Short Term Trading Idea for Power Grid Corp Ltd.Hello everyone, i hope you all will be doing good in your trading and your life as well. Today i have brought an idea which is for power sector leader stock. Yes it is Nifty50 stock, Please check chart aove for 1-hour chart of Power Grid Corp Ltd ., we can see a clear Inverted Head and Shoulders pattern, a bullish reversal formation indicating potential upside movement. The breakout from the neckline has already occurred, with a significant volume spike confirming the strength of the move. This breakout suggests the stock is likely to continue its upward momentum in the short term.
For entry, consider buying within the range of 272-267 with a stop loss at 262 . The first target is set at 278 , followed by 286 and a final target of 292 , offering an estimated upside of 8.5% . The strong volume during the breakout adds confidence to this trade, making it a solid short-term opportunity with a good risk-to-reward ratio. Always be mindful of price action around entry points and adjust your strategy accordingly.
I have an option trade as well for this strategy:
For option buying:- Take 265ce which is trading at 10.15, and keep strictly stop loss at 6.5 and Targets will be 12.25/14.65/17.15++
For Option writing (Sell) with hedging:- Sell 275 pe which is trading at 8.05 and buy 265 pe which is now at 3.75. ( I will suggest you to choose this strategy )
NOTE:- Please strictly follow stop loss,options trading carry huge risk and reward so trade carefully or simply go with cash trade.
Disclaimer: This analysis is for educational purposes only. Please consult a financial advisor before making investment decisions.
If you Found this helpful? Don’t forget to like, share, and drop your thoughts in the comments below.

SRF Chart Signals Big Breakout OpportunityThe chart shows a weekly timeframe analysis of SRF Ltd (NSE) with a focus on a potential breakout. Here’s a breakdown of the analysis:
Pattern Identification
1. Symmetrical Triangle Pattern:
• The chart highlights a symmetrical triangle, where the price has been consolidating within converging trendlines.
• This pattern generally indicates a continuation or reversal, depending on the breakout direction.
2. Fair Value Gap (FVG):
• There is a Fair Value Gap (FVG) marked, which represents an imbalance in price action. It could act as a liquidity zone for price retracement.
3. Order Block (OB):
• An order block is highlighted, which is a strong demand zone. This suggests that buyers could step in, pushing prices higher.
Future Outlook
1. Bullish Breakout Expected:
• The arrows and target zones indicate that a bullish breakout from the triangle is anticipated.
• The projected upside move is around 665 points (25%-30%), aiming for targets near ₹3,300-₹3,400.
2. Potential Retest:
• A retest of the breakout level or a pullback into the order block (around ₹2,400-₹2,500) could occur before continuing upward momentum.
3. Secondary Triangle:
• Another smaller triangle formation is shown for the medium-term outlook, suggesting a consolidation phase before further movement.
Key Levels
• Support Zones: ₹2,357 (stop-loss region) and ₹2,486 (demand zone).
• Immediate Resistance: ₹2,606 (current breakout level).
• Target Zones: ₹2,791 and ₹3,300+ in the medium to long term.
This chart suggests a positive outlook for SRF Ltd, with a focus on confirming a breakout and maintaining the marked support levels.
DISCLAIMER- PLEASE DO YOUR OWN RESEARCH BEFORE INVESTING . THIS IS FOR EDUCATIONAL PURPOSES ONLY

ITC: A Strong Bullish Setup for Swing TradersHello Everyone, i hope you all will be doing good in your life and your trading as well. Today i have brought A Perfect Bullish Setup for Smart Traders In ITC Ltd. Let's start:
ITC is back in action! This stock has caught my attention with its textbook-perfect breakout, making it a solid opportunity for swing traders and long-term investors. With the hotel business demerger complete, ITC is laser-focused on its core strengths—FMCG, Cigarettes, and Agri-business. The chart speaks volumes with an Ascending Triangle Pattern, signaling a breakout that’s hard to ignore.
Here’s what’s happening:
Ascending Triangle Breakout: Higher lows and strong buyer interest pushed the price above 492, confirming the breakout with volume.
Projected Move: After a 38% rally in 2023, ITC continues its bullish momentum with targets set at 492, 550, and 605. If 605 is breached, 650 is on the cards!
Entry and Stop Loss: Best accumulation zone lies between 442-431, backed by the upward trendline. Keep a stop loss below 391 to manage risk.
Why ITC Deserves Attention:
ITC’s valuation is still attractive with a low P/E ratio and one of the best dividend yields in the market. FMCG growth and resilient cigarette margins are driving the stock higher in the short term. Long-term investors will love its diversification, sustainability focus, and consistent performance.
My Take:
ITC is showing all the right signs of strength. This setup is not just for traders but also a gem for long-term portfolios. Keep an eye on ₹605—this could be the level where momentum shifts to the next gear.
Disclaimer: This analysis is for educational purposes only. Please trade responsibly and consult a financial advisor before making any decisions.
If you found this analysis helpful, don’t forget to like, follow, and share your thoughts in the comments below! Your support keeps me motivated to share more insights. Let’s grow and learn together—happy trading!

Navinfluorine Looks Good!NSE:NAVINFLUOR
The price appears to have found a bottom, signaling a potential reversal as it breaks upward following a phase of consolidation or indecision.
The Diamond Bottom pattern typically forms during a downtrend, where prices initially create higher highs and lower lows, forming a broadening structure.
Over time, the trading range narrows as the highs peak and the lows begin trending upward. A decisive upward breakout from the diamond's boundary confirms the reversal, marking the transition to a new uptrend.
PLEASE NOTE THAT:
This chart analysis is only for reference purpose.
This is not buying or selling recommendations.
I am not SEBI registered.
Please consult your financial advisor before taking any trade.
