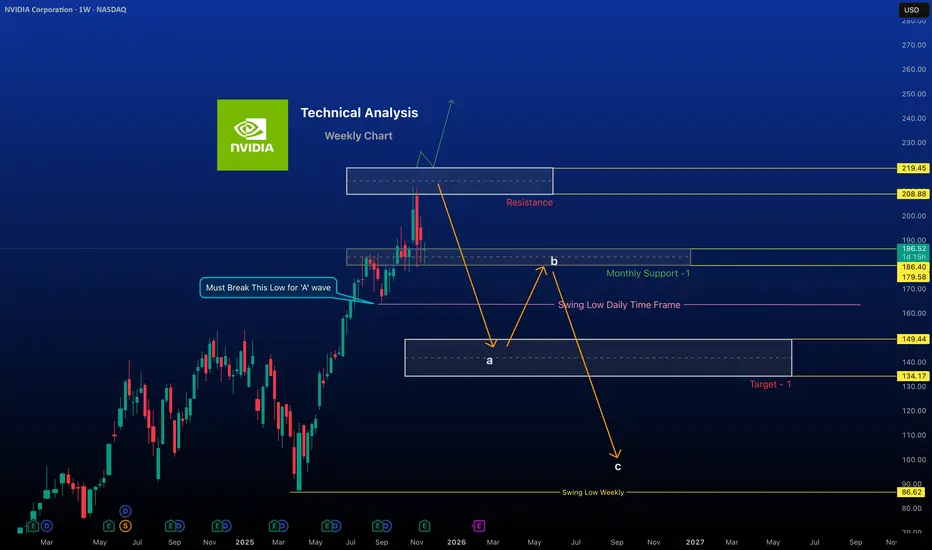
NVIDIA Turn consolidation phase In Weekly Time frame“Chip maker? More like dip maker today.”
#NVIDIA
Trend / Momentum
The stock is in a consolidation phase and range-bound lately, not in a strong runaway uptrend. However, RSI is around neutral (~52), indicating neither overbought nor oversold conditions.
Support & Resistance Levels
Support: Key support around $175–$185.
Resistance: Key resistance near $208–$220, as per recent weekly analysis marked on the chart.
Bullish to neutral overall:
Technicals suggest no runaway rally at the moment, but the long-term trend remains constructive. If NVDA breaks above $229 with volume, it could signal a strong bullish leg. On the downside, a weekly close below $175 may put pressure on the stock and trigger further weakness toward Target-1 or consolidation.
Disclaimer
High Risk Investment
Trading or investing in assets like crypto, equity, or commodities carries high risk and may not suit all investors.
Analysis on this channel uses recent technical data and market sentiment from web sources for informational and educational purposes only, not financial advice. Trading involves high risks, and past performance does not guarantee future results. Always conduct your own research or consult a SEBI-registered advisor before investing or trading.
This channel, Render With Me, is not responsible for any financial loss arising directly or indirectly from using or relying on this information.
Nvda_analysis
NVDA UP TO 214$Hello
According to my analysis on the NVDA daily chart, I can confirm a high-probability buy opportunity that could reach $214 within the next few days.
Ibrouri Abdessamad

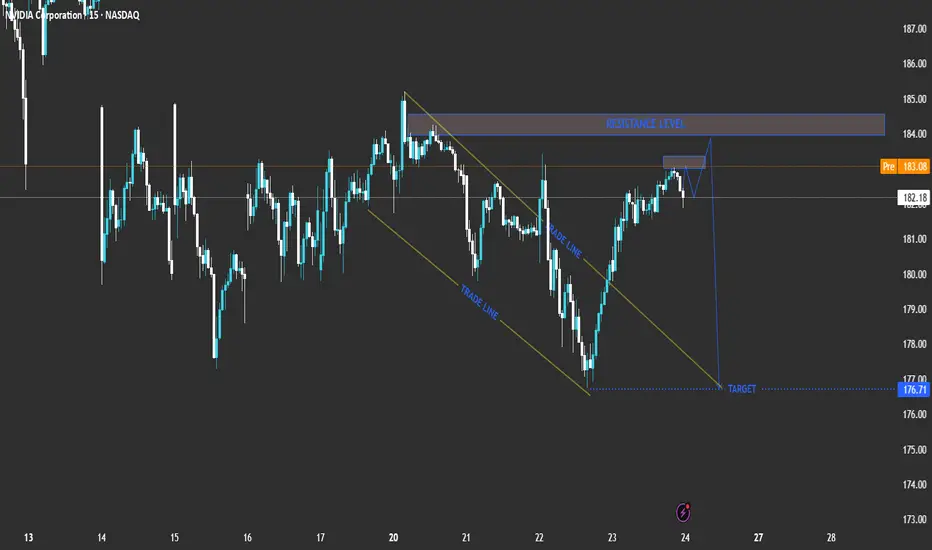
l analysis for NVIDIA Corporation (NVDA) based on your chart:Current Price: 182.18
Pre-Market Price: 183.21
Trend: Short-term bullish recovery inside a broader corrective phase.
Technical Breakdown
Descending Channel (Trade Line)
NVDA recently traded inside a downward-sloping channel, showing controlled selling pressure.
The breakout above the upper trade line suggests a short-term bullish correction phase.
Resistance Zone
A strong resistance level lies between 183.00 and 184.00.
This zone aligns with previous highs and may act as a reversal area if the price fails to break above it.
Expected Move
The chart projection shows a potential rejection near the resistance level, followed by a pullback towards the 176.71 target area.
This indicates that the current upward move might be corrective before another bearish swing.
Trade Scenarios
📉 Bearish Reversal Scenario (Primary Setup)
Entry Zone: 183.00 – 184.00 (resistance area)
Confirmation: Bearish rejection candlestick pattern or a failed breakout.
Target: 176.71
Stop Loss: Above 184.50
Comment: Ideal short setup if price rejects resistance.
📈 Bullish Breakout Scenario (Alternative)
Entry: Above 184.50 with strong bullish momentum.
Target: 186.50 – 187.00
Comment: A breakout and hold above resistance would invalidate the short setup and indicate further upside.
Summary Table
Bias Key Level Confirmation Target Notes
Bearish (Primary) 183 – 184 Rejection candle 176.71 Short setup
Bullish (Alternative) Above 184.50 Breakout candle 186.5 – 187 Upside continuation
Conclusion
NVIDIA (NVDA) is approaching a crucial resistance level. The most probable scenario is a bearish reversal from the 183–184 zone, targeting 176.71. However, a confirmed breakout above 184.50 would signal bullish continuation toward 187.00. EURONEXT:KBCA EURONEXT:UMI EURONEXT:AZE EURONEXT:KBC EURONEXT:ABI EURONEXT:GBLB EURONEXT:LOTB EURONEXT:NYXH EURONEXT:PROX EURONEXT:SIP EURONEXT:ABO EURONEXT:AGFB XETR:SAP GETTEX:NSE XETR:CON XETR:HCL FWB:BREA
NVDA: Correction PhaseHello everyone,😉
I’ve put a scenario for the stock 'NVDA' together, which is currently drawing attention.
This scenario is based on not only the "Elliott Wave Theory" but also various analytical tools, so please take it into high consideration.
✔️ Wave from $140.76 downward: "Extended Flat"
This is an 'Extended Flat' composed of a 3-3-5 structure. The final C wave was completed as an 'Extended fifth wave impulse.'
✔️ Wave from $90.69 upward: "Zigzag"
This is a 'Zigzag' with a 5-3-5 structure. The A wave and C wave have a 1.618 ratio, which adds a high level of credibility.
✔️ Conclusion: Projected Path
Based on the wave count so far, I’ve drawn the projected path. I anticipate the appearance of a downward impulse wave and used the downward parallel channel and Fibonacci levels to estimate the potential decline range.
First support zone: $100.03
Second support zone: $84.57 (very strong)
Good luck!
This is not a buy or sell recommendation.
It is a personal perspective and should be used for reference only.
All decisions and responsibilities are yours.


NVDA 4 HR ANALYSISchart reversing on strong support zone, so my view is bullish, entry and exit is mentioned on chart.

NVDA Investment Plan - 21/Mar/2022Hello Traders,
Hope you all are doing good!!
I expect this stock to shoot up from around 130-140 price level after completing the correction.
Look for your BUY setups.
Please follow me and like if you agree or this idea helps you out in your trading plan.
Disclaimer: This is just an idea. Please do your own analysis before opening a position. Always use SL & proper risk management.
Market can evolve anytime, hence, always do your analysis and learn trade management before following any idea

NASDAQ - NVDA - Exact signal foundHere i share the view of NASDAQ - NVDA - exactly selling signal found.
And it has given a very good move in down side
