NVDA UP TO 214$Hello
According to my analysis on the NVDA daily chart, I can confirm a high-probability buy opportunity that could reach $214 within the next few days.
Ibrouri Abdessamad
Nvdalong

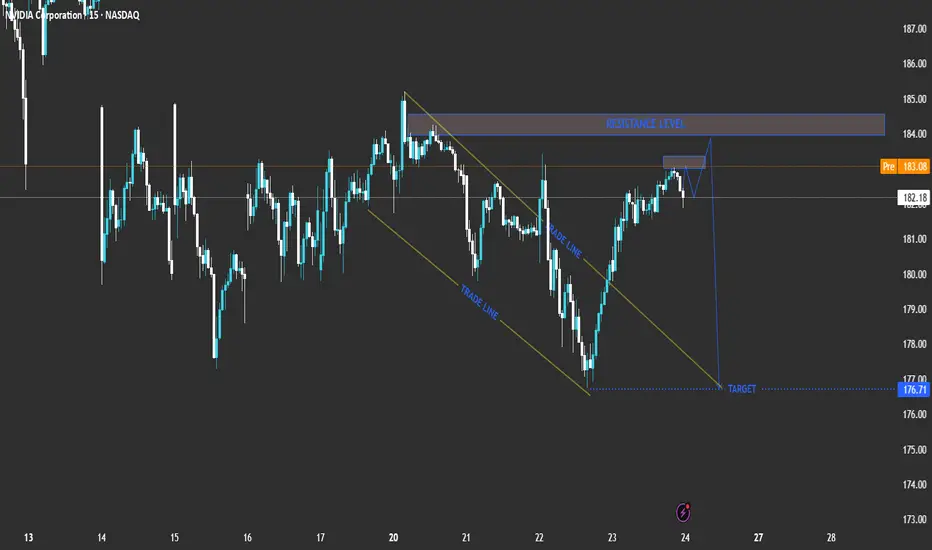
l analysis for NVIDIA Corporation (NVDA) based on your chart:Current Price: 182.18
Pre-Market Price: 183.21
Trend: Short-term bullish recovery inside a broader corrective phase.
Technical Breakdown
Descending Channel (Trade Line)
NVDA recently traded inside a downward-sloping channel, showing controlled selling pressure.
The breakout above the upper trade line suggests a short-term bullish correction phase.
Resistance Zone
A strong resistance level lies between 183.00 and 184.00.
This zone aligns with previous highs and may act as a reversal area if the price fails to break above it.
Expected Move
The chart projection shows a potential rejection near the resistance level, followed by a pullback towards the 176.71 target area.
This indicates that the current upward move might be corrective before another bearish swing.
Trade Scenarios
📉 Bearish Reversal Scenario (Primary Setup)
Entry Zone: 183.00 – 184.00 (resistance area)
Confirmation: Bearish rejection candlestick pattern or a failed breakout.
Target: 176.71
Stop Loss: Above 184.50
Comment: Ideal short setup if price rejects resistance.
📈 Bullish Breakout Scenario (Alternative)
Entry: Above 184.50 with strong bullish momentum.
Target: 186.50 – 187.00
Comment: A breakout and hold above resistance would invalidate the short setup and indicate further upside.
Summary Table
Bias Key Level Confirmation Target Notes
Bearish (Primary) 183 – 184 Rejection candle 176.71 Short setup
Bullish (Alternative) Above 184.50 Breakout candle 186.5 – 187 Upside continuation
Conclusion
NVIDIA (NVDA) is approaching a crucial resistance level. The most probable scenario is a bearish reversal from the 183–184 zone, targeting 176.71. However, a confirmed breakout above 184.50 would signal bullish continuation toward 187.00. EURONEXT:KBCA EURONEXT:UMI EURONEXT:AZE EURONEXT:KBC EURONEXT:ABI EURONEXT:GBLB EURONEXT:LOTB EURONEXT:NYXH EURONEXT:PROX EURONEXT:SIP EURONEXT:ABO EURONEXT:AGFB XETR:SAP GETTEX:NSE XETR:CON XETR:HCL FWB:BREA