Inverse Cup and Handle for Bearish indicationAfter strong Bullish Engulfing formation on 5th September 2025, the OANDA:NZDCAD price is rocketing towards higher highs, aiming for 0.8624 resistance.
Now it needs some breath after forming a bearish Harami on 12th September 2025.
Looking at the Hourly timeframe, it made an inversed Cup and Handle which indicates for bearish signal.
Yet we need another confirmation for breaking its lower high at 0.8229 which is our entry price
I am bearish from Monday onwards waiting for that cup's handle breakout. Once its done my orders must be triggered and left for bearish.
I will place a sell stop order 0.8229 with my SL at the handle of cup at 0.8256.
I will take two positions both at the breakout of Handle at 0.8229. Both position has 2% risk in total
Note: The Sell stop order is a must. If its not triggered then we are not aiming for any other trade.
Position 1 with 1 % Risk
Buy Stop: 0.8229
Stop Loss: 0.8256
TP: 0.8197
Position 1 with 1 % Risk
Buy Stop: 0.8229
Stop Loss: 0.8256
TP: 0.8160
NZDCADANALYSIS

NZDCAD - CAUGHT IN THE MIDDLE, INTRA-RANGE TRADINGSymbol - NZDCAD
NZDCAD continues to exhibit strength within a broadly neutral trading range, supported in part by a corrective pullback in the US dollar. However, the sustainability of this momentum remains uncertain as market participants await key upcoming events, including the FOMC meeting and a speech by Federal Reserve Chair Jerome Powell.
The primary focus remains on the current consolidation zone, where the pair is exhibiting a localized upward bias. Notably, liquidity accumulation near the 0.8315 level appears to be exerting a magnetic effect on price action. The recent correction in the US dollar has provided short-term support to the New Zealand dollar, contributing to the pair's recent gains.
Nevertheless, upcoming fundamental developments pose significant event risk. Market expectations suggest a potentially hawkish tone from the Federal Reserve, which could prompt a reversal in the prevailing trend. Given the current neutral range, there is an elevated risk of a false breakout, followed by a corrective move.
Key Resistance Levels: 0.8315
Key Support Levels: 0.8264, 0.8235, 0.8225
The 0.8315 liquidity zone may act as a temporary barrier or potential reversal point. Future price direction will likely hinge on the tone and content of forthcoming US economic data and Fed communications. Should the Federal Reserve adopt a more aggressive policy stance or signal intent to do so, the US dollar could regain strength, potentially weakening the NZD in the process.

NZDCADFX:NZDCAD
Hi guys, As you can see in NZDCAD it was in consolidation from 3days in 15min TF and it created a strong support and resistance. If it gives breakout either side we can take entries, make sure to take retest entries and SL will be at pull back candle. ( My prediction was bearish ) so, plan your trade accordingly.

NZDCAD FX:NZDCAD
Hi Guys, IN NZDCAD you can see that, it created a horizontal resistance. take entry if the price breaks the drawn level and candle must close 50% out side the drawn level and for safer entries take retest entry on long position.
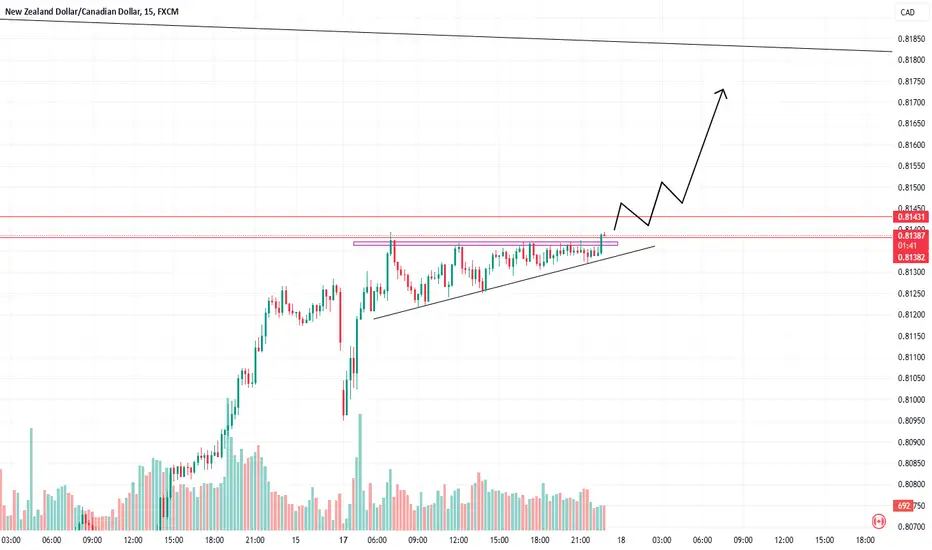
NZDCAD Resistance Ahead!
HI,Traders !
NZDCAD is making a local
Rebound but a horizontal
Resistance is ahead at 0.81417
So after the retest we will be
Expecting a local bearish pullback
And a move down !
Comment and subscribe to help us grow !

NZDCAD SHOWING A LONGTERN UP MOVE WITH 1:10 RISK REWARDNZDCAD SHOWING A GOOD UP MOVE WITH 1:10 RISK REWARD
DUE TO THESE REASON
A. its following a rectangle pattern that stocked the market
which preventing the market to move any one direction now it trying to break the strong resistant lable
B. after the break of this rectangle it will boost the market potential for break
C. also its resisting from a strong neckline the neckline also got weeker ald the price is ready to break in the outer region
all of these reason are indicating the same thing its ready for breakout BREAKOUT trading are follws good risk reward
please dont use more than one percentage of your capitalfollow risk reward and tradeing rules
that will help you to to become a bettertrader
thank you

NZDCAD - TIME TO GO SHORT ?Symbol - NZDCAD
NZDCAD is currently trading at 0.84600
I'm seeing a trading opportunity on sell side.
Shorting NZDCAD pair at CMP 0.84600
I will be adding more if 0.85000 comes & will hold with SL of 0.85300
Targets I'm expecting are 0.83500 - 0.82900
Disclaimer - Do not consider this as a buy/sell recommendation. I'm sharing my analysis & my trading position. You can track it for educational purposes. Thanks!

NZDCAD - TRADE ON SHORT SIDESymbol - NZDCAD
NZDCAD is currently trading at 0.83500
I'm seeing a trading opportunity on sell side.
Shorting NZDCAD pair at CMP 0.83500
I will be adding more if 0.83750 comes & will hold with SL of 0.84100
Targets I'm expecting are 0.82660 - 0.82100
Disclaimer - Do not consider this as a buy/sell recommendation. I'm sharing my analysis & my trading position. You can track it for educational purposes. Thanks!

NZDCAD FOREXCOM:NZDCAD
- Break the supply but not closing above the supply
- Wait for the Confirmation in LTF
-2 Higher High....Looking for the 3rd High
-Chance to Sweep the IDM(x) & Reverse
- V-shape recovery
- High Volume in Buying Candle
...............here is the full multi time frame analysis for this pair, let me know in the comment section below if you have any questions, the entry will be taken only if all rules of the strategies will be satisfied. wait for more Smart Money to develop before taking any position . I suggest you keep this pair on your watchlist and see if the rules of your strategy are satisfied...


NZDCAD Buy trade opportunitiesNZDCAD Buy trade opportunities
NZDCAD it's recently closed above the short-term resistance line its a good opportunity to take a long to the next resistance as we mark in the chart
Always Use Stop Loss

NZDCAD long 1hCheckout my last update on NZDCAD before break out, this is what I was looking for… can expect one opportunity for long…we are Risking 22 pipes for 50 pipes.

NZDCAD longYou can see my previous upload of this pair. This the entry I would prefer for long on NZDCAD. clean picture of BOS and order block entry.
In this I’m RISKING 21.5 pipes for 50 pipes.
I always close half of entries after taking 30 pipes of PROFIT and may the other remaining BE.


{=SELL OOPORTUNITY IN NZDCAD=}It may continue its down trend after a big fall of market from the resistance. So we can look for sell after a retracement.

NZD/CAD at a support.It tooks a support from oldest support line 3 time and move in the upside direction.


💡Don't miss the great buy opportunity in NZDCADTrading suggestion:
". There is a possibility of temporary retracement to the suggested support line (.086473).
. if so, traders can set orders based on Price Action and expect to reach short-term targets."
Technical analysis:
. NZDCAD is in a range bound, and the beginning of an uptrend is expected.
. The price is below the 21-Day WEMA, which acts as a dynamic resistance.
. The RSI is at 62 .
Take Profits:
TP1= @ 0.86818
TP2= @ 0.87144
TP3= @ 0.87396
TP4= @ 0.87679
TP5= @ 0.87976
SL= Break below S2
❤️ If you find this helpful and want more FREE forecasts in TradingView
. . . . . Please show your support back,
. . . . . . . . Hit the 👍 LIKE button,
. . . . . . . . . . Drop some feedback below in the comment!
❤️ Your support is very much 🙏 appreciated! ❤️
💎 Want us to help you become a better Forex / Crypto trader ?
Now, It's your turn !
Be sure to leave a comment; let us know how you see this opportunity and forecast.
Trade well, ❤️
ForecastCity English Support Team ❤️

NZDCAD GARTLEY pattern on 1 hr chart. Hello Trader, Here is the full analysis on NZDCAD
1) On 1hr chart we can see it as formed gartley pattern and possible reversal expected.
2) Price is moving toward strong resistance zone and can test this zone for up move and if it fails then on basis of gartley and strong resistance one can look for short.
How can you support me:
1) Like my idea.
2) Follow me for more analysis
3) I will Opening Telegram and instagram channels soon.
Feedback:
Please share your feedback in comments and this will help me to improve my drawing and analysis .
