NZDUSDAs you can see, price made a strong impulse to the upside, leaving an inefficient leg behind and creating a clean demand zone below, which also includes the 0.56000 candle.
I’m expecting a pullback lower into that area before looking for potential buys.
Let’s see how price develops.
NZDUSD

NZDUSDSimilar to other NZD pairs, NZD/USD is overall bearish, but I’m watching two possible scenarios. The demand zone below looks very clean, and in case of USD weakness, I’d like to see a reaction from there for potential buys and then watch what happens at the supply.

NZDUSD - Mandelbrot Theorem 1:7 RRSome properties of the Mandelbrot set
This section summons some properties of the Mandelbrot set first without proof, then some statements are proved.
Theorem 3 (Symmetry) The Mandelbrot set is symmetric with respect to the real axis. This means, if a complex number $ z$ belongs to the mandelbrot set then this is also true for the conjigate complex number $ \bar z$. (You can see this symmetry in Figure 3)
Theorem 4 (Boundary) The Mandelbrot set is bounded. You can easily proove, thet the set must lie in the interior of the circle $ \vert z \vert = 2$. (Also see Figure 3)
Theorem 5 (Itself-Similarity) The Mandelbrot set is itself similar in a non exact sense.

NZDUSD Forming a Great Sell side scenario....NZDJPY is approaching 4H resistance zone, which has already show rejection previously. There is also a steep bullish trend line creating a confluence. There is a valid 4H FVG at upside. All these things signalling a coming very good sell side opportunity. Below are points detailing the same.
1. Price is approaching 4H resistance zone. Which may act as a strong supply zone.
2. Very steep Bullish Trend line developing a confluence at resistance. Steep trend line is always prone for breakout/breakdown.
3. Most probably price will take liquidity of resistance zone and break trend line.
4. After breaking trend line it should pullback till resistance/trend line or any newly created OB/FVG.
5. There are two possible reversal point 1. At nearest resistance. 2. At 4H FVG and higher trendline.
All these combinations are signalling a high probability and high Risk and Reward (1:8) trade scenario.
Note – if you liked this analysis, please boost the idea so that other can also get benefit of it. Also follow me for notification for incoming ideas.
Also Feel free to comment if you have any input to share.
Disclaimer – This analysis is just for education purpose not any trading suggestion. Please take the trade at your own risk and with the discussion with your financial advisor.

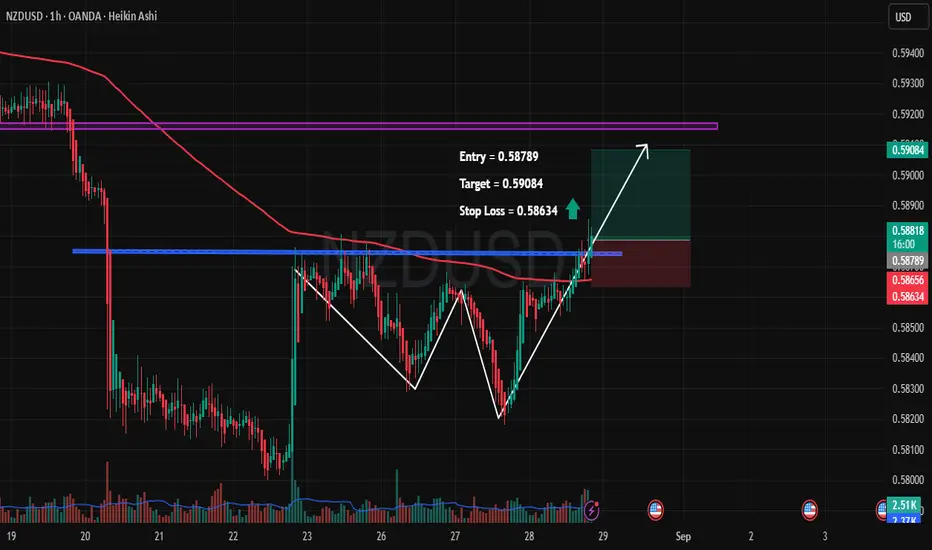
NZDUSD – Breakout Confirmation with Upside Potential🔹 Pair: NZDUSD (1H, Heikin Ashi)
🔹 Entry: 0.58789
🔹 Target: 0.59084 🎯
🔹 Stop Loss: 0.58634 🛑
🔑 Trade Rationale:
✅ Double Bottom Formation – Price respected key support twice, signaling potential reversal.
✅ Breakout Above Resistance – Clean breakout above horizontal resistance (blue line).
✅ 200 EMA Retest – Price is now pushing above the EMA, adding strength to the bullish case.
✅ Volume Spike – Recent surge in buying volume supports the upside move.
📊 Trade Plan:
I’m going long from 0.58789, looking for a quick move toward 0.59084. Risk is limited with a tight SL at 0.58634.
This setup offers a favorable R:R with a technical confluence of breakout + pattern confirmation.
⚠️ Disclaimer: This is not financial advice. Trade at your own risk. Always use proper risk management.
NZDUSD - APPROACHING KEY LIQUIDITY & RESISTANCE ZONESymbol - NZDUSD
CMP - 0.6017
NZDUSD rebounds from the ascending support line, initiating a distribution phase toward the liquidity zone situated above 0.6030
A significant resistance zone is observed between 0.6020 and 0.6030, corresponding to a liquidity pool. Should the current distribution pattern persist, the market may reach a state of exhaustion, potentially resulting in a false breakout. The market currently lacks a clear trend and remains range-bound, indicating that prevailing bearish pressure could impede further upward movement.
Resistance levels: 0.6030
Support levels: 0.5969, 0.5932
In the context of a weakening US dollar, the currency pair may sustain its upward trajectory and test the 0.6030 level in the near term. However, considering the structural nature of the current price action, a downward correction appears probable thereafter.

NZD/USD 4HChart Analysis:Bullish Reversal Setup from Demand Zone📈 Price: 0.59552
📊 EMA 70: 0.59410 (🟤 Brown Line)
Chart Zones & Key Levels
🔷 Resistance Zone:
🔼 Around 0.60298 – 0.60304
🔹 Price reacted strongly here (🔽 white arrows)
🔹 Acts as a ceiling for now
🟢 Demand Zone:
🔽 Around 0.58800
✅ Buyers stepped in here before
📉 If price drops again, might bounce from here
🟥 STOP LOSS:
❗ 0.58793
🔸 Protects from deeper losses if trend breaks down.
TRADE IDEA
1️⃣ Entry Idea: Wait for a pullback into the Demand Zone
📉⬇️
2️⃣ Bullish Reversal Expected:
⬆️ Bounce toward Target Zone
🎯 Target Point: 0.60300
🟦 Profit zone marked in blue
💸 Good Risk/Reward ratio.
Indicators & Pattern
📐 Wedge Pattern:
🔹 Bullish breakout potential
🔹 Currently respecting the channel
📉 EMA Crossover Area:
🔸 Could act as dynamic support/resistance
🟤 Price hovering around EMA (0.59410)
Summary:
✅ Buy Setup if price holds above 0.58800
🎯 Target: 0.60300
🛑 Stop Loss: 0.58793
⚠️ Watch the price reaction at the Demand Zone for confirmation!

NZDUSD Daily Timeframe, SellPrice has taken out the previous higher high, followed by a break/sweep below the swing low, indicating a potential shift in market structure. We're now seeing a strong bearish move to the downside, suggesting the formation of a new trading range.
Currently, price has retraced approximately 90% of this range and entered a key daily supply (sell) zone.
Points of concern: The pullback is relatively deep, which slightly weakens the setup.
The last three daily candles have closed bullish, indicating short-term buying pressure.
This setup may play out at the market open, which increases risk due to potential Sunday night spreads or gaps.
Positive Aspects:
The overall structure favors a short position, aligning with both higher and lower timeframes.
Bullish volume appears to be decreasing, signaling potential exhaustion of buyers.
The setup offers a great risk-to-reward ratio with several TP's.
Let's see how the setup will preform.
Blessings, T

NZDUSD UPDATE - I WAS WRONGHello traders!
It is nice to walk you through that trading Idea that I posted a couple of days ago.
Obiviously losing one.
I always like how when market does not go the way I expect it to, I can dig into it and try to understand the reason why.
Here is just a small explanation for you.
Trade safe!

NZD/USD 15-Min Chart – Bullish Setup from RBS + RBR Zone🟦 Key Support Zone
This blue area is a strong RBS (Resistance Becomes Support) + RBR (Resistance Becomes Resistance) zone. Price bounced here before, confirming its strength.
2. Entry Point
🔵 Buy Entry: 0.58912
This is where you expect the price to bounce again within the support zone.
3. Stop Loss
🔻 Stop Loss: 0.58776
Placed just below the support zone to manage risk if the setup fails.
4. Target Point
🎯 Take Profit: 0.59500
You’re aiming for this level, expecting a bullish continuation.
5. Price Projection Path
🟠 Orange arrows show the expected price movement:
Pullback to the support zone
Bounce upward toward the target
6. Trendline Support
📈 Upward diagonal blue line – supports bullish momentum
7. EMA (7-period)
⚫ Black EMA line showing short-term trend – currently above price, slight retrace

NZD/USD 4H Chart Breakdown – Trendline Breach & Bearish Setup📉 NZD/USD 4H Chart Analysis
1. Trendline Break 🚨
* Price was following a strong uptrend line (↗️)
* Broke below it sharply ➡️ Bearish sign
* Momentum shifted from bullish to bearish
2. Retest Resistance Zone 🔄
* After the drop, price bounced back into a blue resistance box (🧱)
* This was previous support → now resistance
* Classic "break → retest → drop?" setup forming
* Expecting a possible rejection here (✋)
3. Target Point 🎯
* Bearish continuation may push price to 0.55166 zone
* This is your target point (📍)
* Previous key support — might attract buyers again
4. Scenarios to Watch:
✅ Bearish Confirmation:
Price gets rejected at resistance (🧱)
Forms bearish candle (📉)
Continues down to target (🔽🎯)
❌ Bullish Invalidator:
Price closes above resistance zone (🔼)
Breaks back inside trend = Bullish comeback (🟢)
Current Bias:
🔴 Bearish unless price reclaims resistance above 0.5700
👀 Watch that zone closely for a potential entry signal

NZDUSDFX:NZDUSD
Hi Guys, here you can see that, NZDUSD was in a down trend and it created a three touch point breakout and retesting the level. if it breaks the low then we can plan for sell side. plan your trade accordingly....

NZDUSD: The Calm Before a Bearish StormNZDUSD has broken below the 50/20 EMA on the 4-hour timeframe chart. The price experienced a sharp decline, followed by a corrective pause that appears to form an expanded flat correction. Wave (C) completed at 0.5692 . The ATR has decreased to 0.00189 , while the ADX has dropped to 22.87 .
The impulsive move is expected to occur downward. If the price breaks below wave B at 0.55870, it may reverse from the following targeted Fibonacci levels : 0.5555 (1.618) and 0.5470 (2.618).
We will update further information soon.

NZDUSD Day TMF - Bullish Trend 450++Day timeframe bullish trend expect
Buy price at 0.59500
Target - 0.63200++

Nzdjpy i shared this trade idea 4 days ago , currently runningNzdjpy i shared this trade idea 4 days ago , currently running in 1:1.5 in profit,
it works very well
as i said 4 days ago you can check.

Usdcad currently consaldating in a zone , we need to wait Usdcad currently consolidating in a zone , we need to wait see any clear move in bullish or bearish direction then we wait for a pullback and rejection from that support or resistance level to enter trade

NZDUSD reverses from 200-SMA hurdle on RBNZ’s surprise rate cutNZDUSD dropped over 1.0% today, making the biggest move among major currencies. This happened because the Reserve Bank of New Zealand (RBNZ) cut its main interest rate by 0.25%, surprising markets which expected no change. As a result, the NZDUSD pair fell from a one-month high and struggled to break through a key resistance level, namely the 200-day SMA.
Despite this, positive MACD and RSI indicators suggest that buyers may stay optimistic, as long as the price remains above a support line from late October 2023, currently around 0.5885. For the short-term, the quote could drop to the 0.6000 mark and potentially test a 23.6% Fibonacci support level around 0.5920. A drop below 0.5885 could push the pair towards its late 2023 low of around 0.5770.
For a new buying opportunity, buyers should wait for the price to break above the 200-SMA resistance at about 0.6085. If successful, the next targets could be the 61.8% Fibonacci level and a significant resistance zone near 0.6170 and 0.6220. If the price stays above 0.6220, the 78.6% Fibonacci level around 0.6275 and a long-term resistance line near 0.6320 could be the next barriers for the bulls.
In summary, while NZDUSD might see a short-term drop due to negative factors, the overall bullish trend is expected to continue.

RBNZ’s dovish halt, downbeat China CPI weigh on NZDUSD Early Wednesday, NZDUSD prints the biggest daily fall in a fortnight on the Reserve Bank of New Zealand’s (RBNZ) dovish halt, as well as a softer print of China’s Consumer Price Index (CPI) for June. That said, the RBNZ matched market expectations for holding the benchmark rate unchanged but showed readiness to welcome easy monetary policy if inflation slows further. On the other hand, China's CPI dropped to -0.2% MoM and 0.2% YoY in June versus -0.1% and 0.4% market expectations, from -0.1% and 0.3% in that order.
With this, NZDUSD drops more than 0.50% on a day as sellers attack the 200-SMA support of 0.6076. Adjacent to that is strong technical support comprising the 100-SMA and an 11-week-old rising support line, close to 0.6065 by the press time. In a case where the Kiwi pair prints a daily closing beneath 0.6065, a slew of peaks and troughs surrounding 0.6040-35 will test the sellers before directing them to the 0.6000 psychological magnet.
Meanwhile, an impending bull cross on the MACD and downbeat RSI joins the key supports to signal the NZDUSD pair’s corrective bounce, which in turn highlights a three-week-long horizontal resistance area near 0.6150-55. Should the Kiwi pair manage to cross the immediate upside hurdle, the 61.8% Fibonacci ratio of the quote’s fall from December 2023 to April 2024, near 0.6175, will precede a six-month-old horizontal resistance zone around 0.6215-22 to act as the final defenses of the bears.
Overall, NZDUSD is likely to witness a corrective bounce but the recovery remains doubtful below 0.6222.

NZD/USD Market Analysis (15 Minutes) 09-JulCurrent Market Structure:
M15 NZD/USD chart shows a clear bearish structure with a (BOS) at 0.6120. After the BOS occurred, the price recovered and is currently trading near an important supply zone.
Entry Points:
Short entry point would be at the supply zone between 0.6120 and 0.6130. This is the area where strong selling pressure has appeared before and is likely to continue to create resistance when the price returns.
Exit Points:
- Take Profit: The take profit point should be placed at the demand zone on the H1 chart, around 0.6080. This is an area where strong buying pressure has appeared before and may create support when the price drops.
- Stop Loss: The stop loss should be placed above the supply zone, around 0.6140. This is to protect against unexpected fluctuations and minimize risks.
Recommendations:
- Trading Recommendations: With the current market structure, the recommended trading strategy is to enter a short order in the supply zone (0.6120 - 0.6130), set a stop loss at 0.6140 and take profit at 0.6080.
- Note: Always adhere to the risk management principle, only trade with the volume appropriate to your account. Closely monitor price action to be able to adjust the strategy in time.
Wish you successful trading and always achieve stable profits!

NZDUSD SHORT 1H TIMEFRAMEFOREXCOM:NZDUSD
Hello traders , here is the full multi time frame analysis for this pair, let me know in the comment section below if you have any questions, the entry will be taken only if all rules of the strategies will be satisfied. wait for more Smart Money to develop before taking any position . I suggest you keep this pair on your watchlist and see if the rules of your strategy are satisfied...
Keep trading
Hustle hard
Markets can be Unpredictable, research before trading.
Disclaimer: This trade idea is based on Smart money concept and is for informational purposes only. Trading involves risks; seek professional advice before making any financial decisions. Informational only!!!!

NZDUSD jumps on RBNZ’s hawkish halt, 0.6140-45 hurdle tests bullNZDUSD prints the biggest daily jump in more than a week, as well as snaps a two-day losing streak, on the Reserve Bank of New Zealand’s (RBNZ) hawkish halt. That said, the RBNZ held the benchmark rates unchanged, as expected, but upwardly revised the forward rate guidance. The same pushed back the rate cut and signaled expectations of a rate hike during the year. As a result, the Kiwi pair rallied to the 2.5-month high after the RBNZ announcements before retreating from 0.6152, up more than half a percent intraday by the press time.
In addition to the hawkish RBNZ concerns, the NZDUSD pair’s successful trading beyond the previous resistance line stretched from late December 2023, bullish MACD signals and the upbeat RSI (14) line also keeps the buyers hopeful. However, a daily closing beyond a downward-sloping resistance line from January, near 0.6140 by the press time, becomes necessary for trading conviction. Adjacent to the 0.6140 hurdle is the previous weekly high and 38.2% Fibonacci retracement of the quote’s late 2023 upside, near 0.6145. Hence, the bulls need validation from 0.6140-45 to keep the reins. Following that, the double tops marked in February and March around 0.6220 and 23.6% Fibonacci ratio near 0.6230, followed by the 0.6280-85 resistance region, will become the upside targets.
On the contrary, a convergence of the 200-bar Exponential Moving Average (EMA) and a three-week-old rising trend line, around 0.6075-70 at the latest, restricts the NZDUSD pair’s short-term downside ahead of the previously stated resistance-turned-support line near 0.6060. In a case where the Kiwi pair remains bearish past 0.6060, the 61.8% Fibonacci retracement level near the 0.6000 threshold, will act as the final defense of the bears before directing the prices toward the yearly low of near 0.5850.
Overall, the Kiwi pair is likely to remain firmer unless declining back beneath the 0.6060 level. However, fresh buying should wait for a clear upside break of 0.6145.

NZDUSD - LONG ENTRYSymbol - NZDUSD
NZDUSD is currently trading at 0.58750
I'm seeing a trading opportunity on buy side.
Buying NZDUSD pair at CMP 0.58750
I will be adding more if 0.58000 comes & will hold with SL of 0.56600
Targets I'm expecting are 0.59650 - 0.60500 & beyond.
Disclaimer - Do not consider this as a buy/sell recommendation. I'm sharing my analysis & my trading position. You can track it for educational purposes. Thanks!

NZDUSD - TRADE ON SHORT SIDESymbol - NZDUSD
NZDUSD is currently trading at 0.61340
I'm seeing a trading opportunity on sell side.
Shorting NZDUSD pair at CMP 0.61340
I will be adding more if 0.61620 comes & will hold with SL of 0.62000
Targets I'm expecting are 0.60470 - 0.59720
Disclaimer - Do not consider this as a buy/sell recommendation. I'm sharing my analysis & my trading position. You can track it for educational purposes. Thanks!
