Flag Found in NZDUSDI was eyeing on NZDUSD for Bullish entry above its major support @ 0.5613.
Then I caught a flag pattern which indicates continuation towards 0.5515. This is also confirmed by its near major support at 0.5514.
The price retraced two times from 0.5514 on 9th April 2025 and 3rd Februrary 2025. It enables me to have a proactive selling below the current Lower Low @ 0.5588 which is the pole of our flag.
Our Stop losses positioned at 0.5617, right above the flag clothing.
I am taking two trades each with 1% risk.
If my first trade target hits then I will move the SL of other trade to BE to ride the same direction with great peace of mind. Happy Trading.
Trade No. 1
Entry (Sell Stop): 0.5588
SL: 0.5617
TP: 0.55518
Trade No. 2
Entry (Sell Stop): 0.5588
SL: 0.5617
TP: 0.55155
Nzdusdanalysis

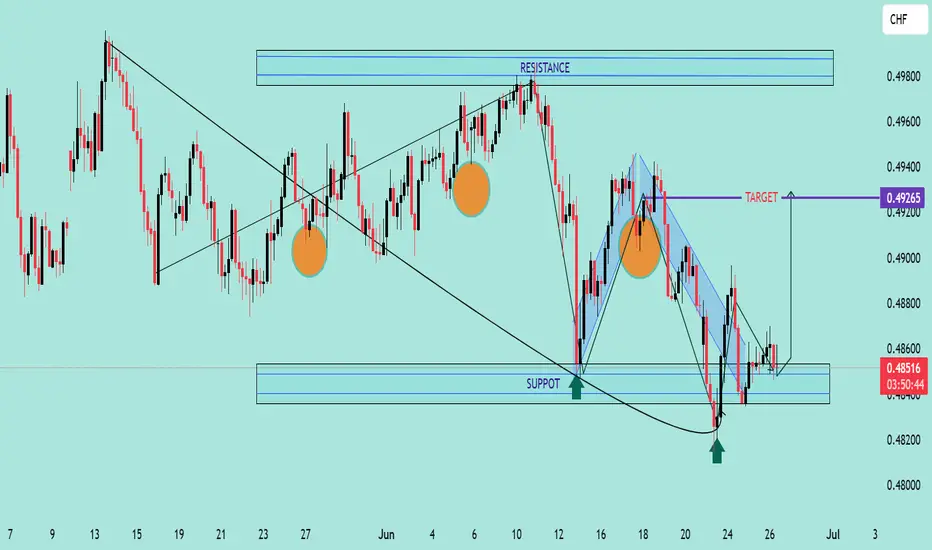
NZD/CHF Potential Bullish Reversal Setup NZD/CHF Potential Bullish Reversal Setup 🔄📈
📊 Chart Analysis:
The chart shows a potential bullish reversal for NZD/CHF, supported by technical patterns and key levels:
🧠 Key Technical Highlights:
🔹 Double Bottom Formation (🟠 Circles)
A clear double bottom pattern can be seen around the 0.48300 support zone, signaling potential reversal from the downtrend.
🔹 Strong Support Zone 📉
Price bounced from a historically respected support zone (~0.48200–0.48400), which held several times in the past (marked with green arrows).
🔹 Downtrend Breakout 🔺
A short-term bearish channel has been broken to the upside, indicating potential bullish pressure.
🔹 Target Zone 🎯
Immediate bullish target is around 0.49265, aligning with previous resistance.
🔹 Resistance Area (🔵 Boxes)
Next significant resistance lies at 0.49400–0.49800, which may act as the next hurdle if price breaks the 0.49265 level.
✅ Conclusion:
As long as price holds above 0.48400, bulls may aim for the 0.49265 🎯 target. A breakout above that level can open the path to higher resistances.
📌 Bullish Bias maintained above support zone — monitor for volume confirmation and retest strength.
NZDUSD - APPROACHING KEY LIQUIDITY & RESISTANCE ZONESymbol - NZDUSD
CMP - 0.6017
NZDUSD rebounds from the ascending support line, initiating a distribution phase toward the liquidity zone situated above 0.6030
A significant resistance zone is observed between 0.6020 and 0.6030, corresponding to a liquidity pool. Should the current distribution pattern persist, the market may reach a state of exhaustion, potentially resulting in a false breakout. The market currently lacks a clear trend and remains range-bound, indicating that prevailing bearish pressure could impede further upward movement.
Resistance levels: 0.6030
Support levels: 0.5969, 0.5932
In the context of a weakening US dollar, the currency pair may sustain its upward trajectory and test the 0.6030 level in the near term. However, considering the structural nature of the current price action, a downward correction appears probable thereafter.

NZD/USD 4HChart Analysis:Bullish Reversal Setup from Demand Zone📈 Price: 0.59552
📊 EMA 70: 0.59410 (🟤 Brown Line)
Chart Zones & Key Levels
🔷 Resistance Zone:
🔼 Around 0.60298 – 0.60304
🔹 Price reacted strongly here (🔽 white arrows)
🔹 Acts as a ceiling for now
🟢 Demand Zone:
🔽 Around 0.58800
✅ Buyers stepped in here before
📉 If price drops again, might bounce from here
🟥 STOP LOSS:
❗ 0.58793
🔸 Protects from deeper losses if trend breaks down.
TRADE IDEA
1️⃣ Entry Idea: Wait for a pullback into the Demand Zone
📉⬇️
2️⃣ Bullish Reversal Expected:
⬆️ Bounce toward Target Zone
🎯 Target Point: 0.60300
🟦 Profit zone marked in blue
💸 Good Risk/Reward ratio.
Indicators & Pattern
📐 Wedge Pattern:
🔹 Bullish breakout potential
🔹 Currently respecting the channel
📉 EMA Crossover Area:
🔸 Could act as dynamic support/resistance
🟤 Price hovering around EMA (0.59410)
Summary:
✅ Buy Setup if price holds above 0.58800
🎯 Target: 0.60300
🛑 Stop Loss: 0.58793
⚠️ Watch the price reaction at the Demand Zone for confirmation!

NZD/USD 15-Min Chart – Bullish Setup from RBS + RBR Zone🟦 Key Support Zone
This blue area is a strong RBS (Resistance Becomes Support) + RBR (Resistance Becomes Resistance) zone. Price bounced here before, confirming its strength.
2. Entry Point
🔵 Buy Entry: 0.58912
This is where you expect the price to bounce again within the support zone.
3. Stop Loss
🔻 Stop Loss: 0.58776
Placed just below the support zone to manage risk if the setup fails.
4. Target Point
🎯 Take Profit: 0.59500
You’re aiming for this level, expecting a bullish continuation.
5. Price Projection Path
🟠 Orange arrows show the expected price movement:
Pullback to the support zone
Bounce upward toward the target
6. Trendline Support
📈 Upward diagonal blue line – supports bullish momentum
7. EMA (7-period)
⚫ Black EMA line showing short-term trend – currently above price, slight retrace

NZD/USD 4H Chart Breakdown – Trendline Breach & Bearish Setup📉 NZD/USD 4H Chart Analysis
1. Trendline Break 🚨
* Price was following a strong uptrend line (↗️)
* Broke below it sharply ➡️ Bearish sign
* Momentum shifted from bullish to bearish
2. Retest Resistance Zone 🔄
* After the drop, price bounced back into a blue resistance box (🧱)
* This was previous support → now resistance
* Classic "break → retest → drop?" setup forming
* Expecting a possible rejection here (✋)
3. Target Point 🎯
* Bearish continuation may push price to 0.55166 zone
* This is your target point (📍)
* Previous key support — might attract buyers again
4. Scenarios to Watch:
✅ Bearish Confirmation:
Price gets rejected at resistance (🧱)
Forms bearish candle (📉)
Continues down to target (🔽🎯)
❌ Bullish Invalidator:
Price closes above resistance zone (🔼)
Breaks back inside trend = Bullish comeback (🟢)
Current Bias:
🔴 Bearish unless price reclaims resistance above 0.5700
👀 Watch that zone closely for a potential entry signal

NZDUSDFX:NZDUSD
Hi Guys, here you can see that, NZDUSD was in a down trend and it created a three touch point breakout and retesting the level. if it breaks the low then we can plan for sell side. plan your trade accordingly....

NZDUSD Day TMF - Bullish Trend 450++Day timeframe bullish trend expect
Buy price at 0.59500
Target - 0.63200++

NZDUSD - TRADE ON SHORT SIDESymbol - NZDUSD
NZDUSD is currently trading at 0.61340
I'm seeing a trading opportunity on sell side.
Shorting NZDUSD pair at CMP 0.61340
I will be adding more if 0.61620 comes & will hold with SL of 0.62000
Targets I'm expecting are 0.60470 - 0.59720
Disclaimer - Do not consider this as a buy/sell recommendation. I'm sharing my analysis & my trading position. You can track it for educational purposes. Thanks!

NZDUSD ORDER BLOCK | 1 HR POINZDUSD ORDER BLOCK | 1 HR POI
Hi traders..,
This is Nzdusd 1hr POI Liqudity taken now
we will see selling from 0.60170 level this best selling setup.
5 min choch best to take trade..
Note - Only for education purpose

NZDUSD SELLFOREXCOM:NZDUSD
Hello traders , here is the full multi time frame analysis for this pair, let me know in the comment section below if you have any questions, the entry will be taken only if all rules of the strategies will be satisfied. wait for more Smart Money to develop before taking any position . I suggest you keep this pair on your watchlist and see if the rules of your strategy are satisfied...
Keep trading
Hustle hard

NZD USD SHORTSept #1
Risk 0.5%
TP1 = 1:2 RR
Disclaimer:
The contents in this Idea are intended for information purpose only and do not constitute investment recommendation or advice. Nor are they used to promote any specific products or services. They serve as an integral part of a case study to demonstrate fundamental concepts in risk management under given market scenarios. A full version of the disclaimer is available in our profile description.

NZDUSD 5RR Trading Setup1) Uptrend
2) Price is above EMA
3) Moving up From their Strong support
4) Fundamentally NZDUSD Is looking LONG
70% Technical 30% Fundamental

NZDUSDFX:NZDUSD
As you can see that, NZDUSD is in a consolidation and it is going to give a bearish breakout, If the breakout is good risky trades can go for sell side and take retest entry if you are a safe trader. Plan your trade accordingly...

NZDUSD Sell trade opportunitiesNZDUSD Sell trade opportunities
Overall sell trend and recent breakout support line, Here is a good opportunity to take a short trade with good risk rewards

NZDUSD Buy trade opportunitiesNZDUSD Buy trade opportunities
Based on recent market activity, there has been a strong bullish candle that has formed at a major support level. This presents a good opportunity to take a buy trade with the next resistance target in mind.

NZDUSD 4HRS TF rally DirectionNZDUSD 4HRS TF
Stoploss 0.60864
Target 0.65044
Now Current Price 0.62364
Sure Shot....
delay prediction...

NZDUSD Sell trade opportunitiesNZDUSD Sell trade opportunities
NZDUSD overall Sell trend its recently reverse from resistance its a good opportunity to take sell here target mentioned in the chart

NZDUSD Buy trade opportunitiesNZDUSD Buy trade opportunities
NZDUSD it's recently closed above the short-term resistance line its a good opportunity to take a long to the next resistance as we mark in the chart
Always Use Stop Loss

NZDUSD Sell trade opportunitiesNZDUSD Sell trade opportunities
it's currently running in the support and resistance area if breaks the support line then the market will go to the next target as we mention in chart


NZDUSD Intraday ViewExpecting a good reaction from this untested base. Look for longs upon confirmation.
