CRUDE OILHello & welcome to this analysis
USOIL in daily time frame has activated a bullish Harmonic Gartley suggesting probable upside till $62 - 64.50 - 69 as long as it does not breach $59.25
Crude (MCX) is forming a bullish candlestick - Hammer also suggesting likelihood of a rally till 5575 - 5750 - 6150 as long as it does not breach 5300
After a very long time a bullish formation is giving a follow through signal in CRUDE
All the best
Regards
Oilforecast

Crude Oil - Sell around 63.80, target 62.00-60.00Crude Oil Market Analysis:
We have been consistently bearish on crude oil for three months now. Our approach is completely in line with the market. As you can see, crude oil currently only needs a simple rebound to make money. Although volatility is minimal, the market will respond accordingly. We are watching for a technical rebound between 61.20 and 60.00. This rebound presents an opportunity to sell again. We sold today when it rebounded to 63.80.
Fundamental Analysis:
The CPI estimate was 2.7%, while the market expected 2.9%, and the price also reached 2.9%. Both market expectations and results were higher than expected, which should have weighed on gold in the long term. However, gold did not fall, but instead surged.
Trading Recommendations:
Crude Oil - Sell around 63.80, target 62.00-60.00

Crude oil - Sell around 65.00, target 62.00-60.00Crude Oil Market Analysis:
Crude oil closed with a small positive candlestick yesterday, rebounding for three consecutive trading days. It appears that the 60.00 support level remains very strong and difficult to break in the short term. If it rebounds near 65.00, continue selling. Crude oil remains bearish. Today's strategy remains unchanged. Yesterday's positive close is somewhat related to the EIA crude oil inventory data.
Fundamental Analysis:
The most important data this week, the CPI, will be released today. The recent surge in gold prices is due to increased market expectations of a September rate cut by the Federal Reserve. This CPI may be the last data the Fed will use as a reference.
Trading Recommendation:
Crude oil - Sell around 65.00, target 62.00-60.00.

Crude oil - Sell around 63.30, target 62.00-60.00Crude Oil Market Analysis:
The strategy for crude oil is simple: a rebound is a selling opportunity. Don't dwell on the details. Crude oil has been fluctuating for a long time. If it breaks through, we will adjust our strategy. Today, sell crude oil around 64.30. The key resistance level for crude oil is around 65.60. A break of this level will trigger a strong trend. Sell crude oil in the short term during short-term fluctuations. A break of 60.00 will open up new room for significant declines.
Fundamental Analysis:
Today, focus on the EIA crude oil inventory data. The CPI will be released tomorrow, and this week's major action will also be tomorrow.
Trading Recommendations:
Crude oil - Sell around 63.30, target 62.00-60.00

Crude oil - Sell near 63.50, target 62.00-60.00Crude Oil Market Analysis:
Crude oil has recently been recovering on the daily chart, with the focus of the recovery shifting downward. Weak inventory data is also the primary reason for the continued decline in crude oil prices. Today, we maintain a bearish outlook and focus on sell orders near 63.50. Don't chase crude oil today; wait for a small rebound before selling. It's been volatile, and the buying and selling game has been going on for a long time.
Fundamental Analysis:
The previous sharp drop in non-farm payroll data led to a surge in gold prices. This week, we will monitor CPI data.
Trading Recommendations:
Crude oil - Sell near 63.50, target 62.00-60.00

Crude oil - Sell around 64.00, with a target range of 62.00-60.0Crude Oil Market Analysis:
Crude oil has recently begun to move slowly, with the daily chart beginning to decline. This week, we will focus on gains and losses around 60.00. If this level is broken, further downside is possible. We remain bearish on crude oil and continue to sell on rebounds. Every rebound presents an opportunity to sell again. Today, we are focusing on sell opportunities near 64.00. The recently released crude oil inventories are essentially flat, with no significant gap to support buying.
Fundamental Analysis:
Last week's non-farm payroll data showed a figure of 22,000, compared to expectations of 75,000 and a previous estimate of 79,000. This result is quite disappointing. In short, fewer US jobs, a weaker economy, and therefore a stronger gold price. This week, we will monitor the CPI.
Trading Recommendations:
Crude oil - Sell around 64.00, with a target range of 62.00-60.00.

Crude oil - Sell around 64.00, target 62.00-60.00Crude Oil Market Analysis:
Crude oil is still experiencing a recent correction in daily price action. We should consider continuing to sell on any rebounds. Previous crude oil contracts and inventories haven't changed the trend, and recent data doesn't support it. I predict it will be difficult to reverse the weak selling trend in the short term. Today, we're considering selling around 64.00.
Fundamental Analysis:
Recent fundamentals haven't significantly stimulated the market. Today, we'll focus on the US non-farm payroll data.
Trading Recommendations:
Crude oil - Sell around 64.00, target 62.00-60.00

Crude oil - Sell around 64.50, target 63.00-60.00Crude Oil Market Analysis:
The recent daily chart of crude oil has been a fluctuating pattern of rising and falling prices, making us question our own future. Today, we maintain a bearish outlook. Every rebound presents a selling opportunity. We've been selling crude oil for months, and it's been fluctuating for months now, with no signs of a rebound or upward movement. Unless the weekly hurdle of 75 is broken, a significant rally is unlikely. Consider selling if it rebounds to 64.50 today.
Fundamental Analysis:
Today we will have ADP employment and unemployment benefits data.
Trading Recommendation:
Crude oil - Sell around 64.50, target 63.00-60.00

CrudeOil in major resistance area may give breakout*$$CrudeOil is trading near major resistance area with positive news around the world for it. If Iran block Strait of Hormuz then it will give breakout from this area for target of 6655-6722 area & then 6988, 7301, 7500,7750.
If Iran problem solved with USA then it may fall also from this resistance area with fast momentum for target of 6033, 5633, 5155, 4733.
Please consult your advisor before taking any trade & with proper risk management.
Thank You

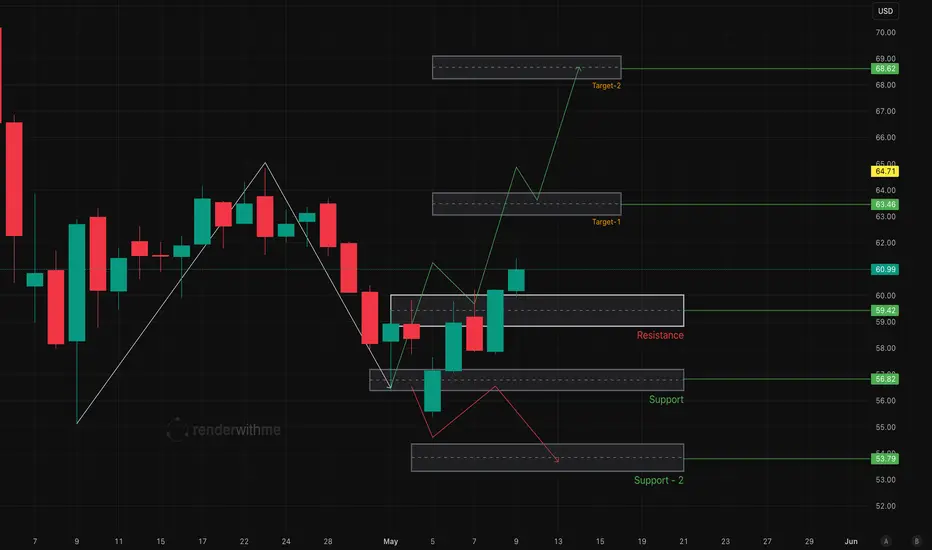
Crude Oil Technical Analysis for the Week of May 11–May 15, 2025nothing much to say Chart speaks itself
Chart for your reference
OIL INDIA LTDOil India Ltd #OIL
Resistance 530. Watching above 531 for upside movement...
Support area 520. Below 525-520 ignoring upside momentum for intraday
Support 520.Watching below 519 for downside movement...
Resistance area 530
Above 525-530 ignoring downside move for intraday
Charts for Educational purposes only.
Please follow strict stop loss and risk reward if you follow the level.

Crude Oil, Triangle Pattern forming and Target, Achieve +12% ROIA Triangle Pattern is forming in Crude Oil, with a Target at the Top of the Pattern and a potential to Achieve a +12% ROI. This is Long-Term Analysis, must follow the Trend continuation technique.

buy sideeye on this script for going long only after range breakout given in chart
trade will be based then on range + trendline breakout
keep on radar
ones entering at cmp can add more on breaking rance
stop would be 186.5
disclaimer - trade @ own risk

USOIL Trading Plan - 17/Nov/2022Hello Traders,
Hope you all are doing good!!
I expect USOIL to go UP after finishing this correction.
Look for your BUY setups.
Please follow me and like if you agree or this idea helps you out in your trading plan.
Disclaimer: This is just an idea. Please do your own analysis before opening a position. Always use SL & proper risk management.
Market can evolve anytime, hence, always do your analysis and learn trade management before following any idea

USOILPrice has brocken out of the channel, we expected price to continue sell side after the consolidation

What 1-hour chart says? Fundamental Development: Oil prices fell on Wednesday, taking a breather from a near 4% surge the previous day, on receding fears of an imminent output cut by the Organization of the Petroleum Exporting Countries and allies, a group known as OPEC+. Global benchmark Brent crude futures fell 40 cents, or 0.4%, to $99.82 a barrel, after rising 3.9% on Tuesday. The U.S. West Texas Intermediate crude futures contract was down 27 cents, or 0.29%, at $93.47 a barrel, having jumped 3.7% the previous day. Both contracts soared on Tuesday after the energy minister of de facto OPEC leader Saudi Arabia flagged the possibility of supply cuts to balance a market it described as "schizophrenic", with the paper and physical markets becoming increasingly disconnected.
Short Term Technical View: In daily chart XTIUSD is trading below 200 SMA & in 1-hour chart, XTIUSD is trading above middle line of Bollinger band indicator. As per RSI Indicator showing bullishness in 1-hour chart, XTIUSD pivot level is 92.75 as per today 1-hour chart, my view is buy on dip strategy is good for XTIUSD. Buy range of XTIUSD is 92.75 to 92.50 and there is very strong support zone at 91.50.
Alternative Scenario: If XTIUSD will trade above 91.50 and sustain below in U.S. Session so it will be, give great opportunity to sell with the target of 90 with the stop loss of 92.75. (Note: Crude oil inventories at 8 PM IST)

What 1-hour chart says? Fundamental Development: Oil prices dipped on Friday after two days of gain, as market participants weighed worries about global economic slowdown - that could dampen fuel demand - against expectations of tighter supplies toward year-end. Brent crude futures fell 36 cents, or 0.4%, to $96.23 a barrel after settling 3.1% higher on Thursday. U.S. West Texas Intermediate crude was at $90.29 a barrel, down 21 cents, or 0.2%, following a 2.7% increase in the previous session. Still, the benchmark contracts headed for weekly losses of about 1.5%. U.S. CRUDE inventories fell sharply as the nation exported a record 5 million barrels of oil a day in the most recent week, with oil companies finding heavy demand from European nations looking to replace crude from warring Russia.
Short Term Technical View: In 1-hour chart, XTIUSD is trading below middle line of Bollinger band indicator. As per RSI Indicator showing Weakness in 1-hour chart, XTIUSD pivot level is 89.15 as per today 1-hour chart, my view is sell on rise strategy is good for XTIUSD. Sell range of XTIUSD is 90 to 90.25 and there is very strong resistance zone at 91.50.
Alternative Scenario: If XTIUSD will trade above 91.50 and sustain above in U.S. Session so it will be, give great opportunity to buy with the target of 93 with the stop loss of 89.

What 1-hour chart says? Fundamental Development: Oil prices little changed on Thursday as investors grappled with falling stockpiles in the United States, rising output from Russia and worries about a potential global recession. Brent crude futures climbed 15 cents, or 0.2%, to $93.80 a barrel. U.S. crude futures gained 4 cents, or 0.1%, to $88.15 a barrel. Prices rose more than 1% during the previous session, although Brent at one point fell to its lowest since February. Futures have fallen over the past few months, as investors have pored over economic data that has spurred concerns about a potential recession that could hurt energy demand. British consumer price inflation jumped to 10.1% in July, it is highest since February 1982, intensifying a squeeze on households.
Short Term Technical View: In 1-hour chart, XTIUSD is trading at middle line of Bollinger band indicator. As per RSI Indicator showing Weakness in 1-hour chart, XTIUSD pivot level is 87 as per today 1-hour chart, my view is sell on rise strategy is good for XTIUSD. Sell range of XTIUSD is 88.25 to 88.50 and there is very strong resistance zone at 89.50.
Alternative Scenario: If XTIUSD will trade above 89.50 and sustain above in U.S. Session so it will be, give great opportunity to buy with the target of 90.50 with the stop loss of 88.50.

What 1-hour chart says? Fundamental Development: Oil prices rose over $1 on Wednesday, rebounding from six-month lows hit the previous day, as an unexpectedly large drop in U.S. oil and gasoline stocks reminded investors that demand remains firm, if overshadowed by the prospect of a global recession. Brent crude futures were last up 82 cents, or 0.9%, to $93.16 a barrel. West Texas Intermediate (WTI) crude futures also rose 85 cents, or 1%, to $87.38 a barrel. The contracts slumped about 3% on Tuesday as weak U.S. housing starts data spurred concerns about a potential global recession. U.S. crude and fuel stocks fell in the latest week, according to market sources citing American Petroleum Institute figures on Tuesday.
Short Term Technical View: In 1-hour chart, XTIUSD is trading at middle line of Bollinger band indicator. As per RSI Indicator showing Weakness in 1-hour chart, XTIUSD pivot level is 87.50 as per today 1-hour chart, my view is sell on rise strategy is good for XTIUSD. Sell range of XTIUSD is 87.50 to 87.75 and there is very strong resistance zone at 89.
Alternative Scenario: If XTIUSD will trade above 89 and sustain above in U.S. Session so it will be, give great opportunity to buy with the target of 91 with the stop loss of 87.50. (Note- Crude oil inventory at 8 PM IST)

What 1-hour chart says? Fundamental Development: Oil prices fell on Tuesday as bleak economic data from top crude buyer China renewed fears of a global recession. Brent crude futures fell 73 cents, or 0.8%, to $94.37 a barrel by. WTI crude futures dipped 44 cents, or 0.5%, to $88.97 a barrel. Oil futures fell about 3% during the previous session. China's central bank cut lending rates to revive demand as the economy slowed unexpectedly in July, with factory and retail activity squeezed by Beijing's zero-COVID policy and a property crisis. China's fuel product exports expected to rebound in August to near a year high after Beijing issued more quotas, adding pressure to already-cooling refining margins. Market participants awaited industry data on U.S. crude stockpiles due later on Tuesday. Oil and gasoline stockpiles likely fell last week, while distillate inventories raised, a preliminary Reuters poll showed on Monday.
Short Term Technical View: In 1-hour chart, XTIUSD is trading at middle line of Bollinger band indicator. As per RSI Indicator showing bullishness in 1-hour chart, XTIUSD pivot level is 88.40 as per today 1-hour chart, my view is buy in dip strategy is good for XTIUSD. Buy range of XTIUSD is 87.50 to 87.25 and there is very strong support zone at 86.
Alternative Scenario: If XTIUSD will trade below 86 and sustain below in U.S. Session so it will be, give great opportunity to sell with the target of 84.50 with the stop loss of 87.50.

What 1-hour chart says? Fundamental Development: Oil prices pulled back slightly on Tuesday on the latest progress in final talks to revive the 2015 Iran nuclear accord, which would clear the way to boost its crude exports in a tight market. Brent crude futures fell 14 cents, or 0.1%, to $96.51 a barrel, paring a 1.8% gain from the previous session. U.S. West Texas Intermediate (WTI) crude futures declined 16 cents, or 0.2%, to $90.60 a barrel, after climbing 2% in the previous session. The European Union late on Monday put forward a "final" text to revive the 2015 Iran nuclear deal, awaiting approvals from Washington and Tehran. A senior EU official said a final decision on the proposal expected within "very, very few weeks". The oil market has remained under pressure recently over global recession fears, with Brent prices suffering their biggest weekly drop last week.
Short Term Technical View: In 1-hour chart, XTIUSD is trading at middle line of Bollinger band indicator. As per RSI Indicator showing bullishness in 1-hour chart, XTIUSD pivot level is 88.65 as per today 1-hour chart, my view is buy in dip strategy is good for XTIUSD. Buy range of XTIUSD is 88.65 to 88.51 and there is very strong support zone at 86.50.
Alternative Scenario: If XTIUSD will trade below 86.50 and sustain below in U.S. Session so it will be, give great opportunity to sell with the target of 85 with the stop loss of 88.

What 1-hour chart says? Fundamental Development: Oil prices bounced higher from multi-month lows on Monday as investors' appetite improved following data on U.S. jobs and Chinese exports data that eased recession concerns. Brent crude futures had risen 81 cents, or 0.9%, to $95.73 a barrel. U.S. West Texas Intermediate crude was at $89.76 a barrel, up 75 cents, or 0.8%. Both contracts settled higher on Friday after jobs growth in the United States, the world's top oil consumer, unexpectedly accelerated in July. On Sunday, China also surprised markets with faster-than-expected growth in exports. Front-month Brent prices last week hit the lowest levels since February, tumbling 13.7% and posting their largest weekly drop since April 2020, while WTI lost 9.7%, as concerns about a recession hitting oil demand weighed on prices.
Short Term Technical View: In 1-hour chart, XTIUSD is trading upper line of Bollinger band indicator. As per RSI Indicator showing bullishness in 1-hour chart, XTIUSD pivot level is 89.50 as per today 1-hour chart, my view is buy in dip strategy is good for XTIUSD. Buy range of XTIUSD is 88.25 to 88 and there is very strong support zone at 86.25.
Alternative Scenario: If XTIUSD will trade below 86.25 and sustain below in U.S. Session so it will be, give great opportunity to sell with the target of 84.25 with the stop loss of 88.25.

What 1-hour chart says? Fundamental Development: Oil prices rose on Thursday as supply concerns triggered a rebound from multi-month lows plumbed in the previous session after U.S. data signaled weak fuel demand. Brent crude futures rose 42 cents, or 0.4%, at $97.20 a barrel, while West Texas Intermediate (WTI) crude futures last up 49 cents, a 0.5% gain, at $91.15. Both benchmarks fell to their weakest levels since February in the previous session after U.S. data showed crude and gasoline stockpiles unexpectedly surged last week and as OPEC+ agreed to raise its oil output target by 100,000 barrels per day (bpd), equal to about 0.1% of global oil demand.
Short Term Technical View: In 1-hour chart, XTIUSD is trading below middle line of Bollinger band indicator. As per RSI Indicator showing weakness in 1-hour chart, XTIUSD pivot level is 92 as per today 1-hour chart, my view is sell on rise strategy is good for XTIUSD. Sell range of XTIUSD is 92 to 92.25 and there is very strong resistance zone at 94.
Alternative Scenario: If XTIUSD will trade above 94 and sustain above in U.S. Session so it will be, give great opportunity to buy with the target of 96 with the stop loss of 92.
