Crude Oil - Sell around 63.80, target 62.00-60.00Crude Oil Market Analysis:
We have been consistently bearish on crude oil for three months now. Our approach is completely in line with the market. As you can see, crude oil currently only needs a simple rebound to make money. Although volatility is minimal, the market will respond accordingly. We are watching for a technical rebound between 61.20 and 60.00. This rebound presents an opportunity to sell again. We sold today when it rebounded to 63.80.
Fundamental Analysis:
The CPI estimate was 2.7%, while the market expected 2.9%, and the price also reached 2.9%. Both market expectations and results were higher than expected, which should have weighed on gold in the long term. However, gold did not fall, but instead surged.
Trading Recommendations:
Crude Oil - Sell around 63.80, target 62.00-60.00
Oiltrading

Crude oil - Sell around 65.00, target 62.00-60.00Crude Oil Market Analysis:
Crude oil closed with a small positive candlestick yesterday, rebounding for three consecutive trading days. It appears that the 60.00 support level remains very strong and difficult to break in the short term. If it rebounds near 65.00, continue selling. Crude oil remains bearish. Today's strategy remains unchanged. Yesterday's positive close is somewhat related to the EIA crude oil inventory data.
Fundamental Analysis:
The most important data this week, the CPI, will be released today. The recent surge in gold prices is due to increased market expectations of a September rate cut by the Federal Reserve. This CPI may be the last data the Fed will use as a reference.
Trading Recommendation:
Crude oil - Sell around 65.00, target 62.00-60.00.

Crude oil - Sell around 63.30, target 62.00-60.00Crude Oil Market Analysis:
The strategy for crude oil is simple: a rebound is a selling opportunity. Don't dwell on the details. Crude oil has been fluctuating for a long time. If it breaks through, we will adjust our strategy. Today, sell crude oil around 64.30. The key resistance level for crude oil is around 65.60. A break of this level will trigger a strong trend. Sell crude oil in the short term during short-term fluctuations. A break of 60.00 will open up new room for significant declines.
Fundamental Analysis:
Today, focus on the EIA crude oil inventory data. The CPI will be released tomorrow, and this week's major action will also be tomorrow.
Trading Recommendations:
Crude oil - Sell around 63.30, target 62.00-60.00

Crude oil - Sell near 63.50, target 62.00-60.00Crude Oil Market Analysis:
Crude oil has recently been recovering on the daily chart, with the focus of the recovery shifting downward. Weak inventory data is also the primary reason for the continued decline in crude oil prices. Today, we maintain a bearish outlook and focus on sell orders near 63.50. Don't chase crude oil today; wait for a small rebound before selling. It's been volatile, and the buying and selling game has been going on for a long time.
Fundamental Analysis:
The previous sharp drop in non-farm payroll data led to a surge in gold prices. This week, we will monitor CPI data.
Trading Recommendations:
Crude oil - Sell near 63.50, target 62.00-60.00

Crude oil - Sell around 64.00, with a target range of 62.00-60.0Crude Oil Market Analysis:
Crude oil has recently begun to move slowly, with the daily chart beginning to decline. This week, we will focus on gains and losses around 60.00. If this level is broken, further downside is possible. We remain bearish on crude oil and continue to sell on rebounds. Every rebound presents an opportunity to sell again. Today, we are focusing on sell opportunities near 64.00. The recently released crude oil inventories are essentially flat, with no significant gap to support buying.
Fundamental Analysis:
Last week's non-farm payroll data showed a figure of 22,000, compared to expectations of 75,000 and a previous estimate of 79,000. This result is quite disappointing. In short, fewer US jobs, a weaker economy, and therefore a stronger gold price. This week, we will monitor the CPI.
Trading Recommendations:
Crude oil - Sell around 64.00, with a target range of 62.00-60.00.

Crude oil - Sell around 64.00, target 62.00-60.00Crude Oil Market Analysis:
Crude oil is still experiencing a recent correction in daily price action. We should consider continuing to sell on any rebounds. Previous crude oil contracts and inventories haven't changed the trend, and recent data doesn't support it. I predict it will be difficult to reverse the weak selling trend in the short term. Today, we're considering selling around 64.00.
Fundamental Analysis:
Recent fundamentals haven't significantly stimulated the market. Today, we'll focus on the US non-farm payroll data.
Trading Recommendations:
Crude oil - Sell around 64.00, target 62.00-60.00

Crude oil - Sell around 64.50, target 63.00-60.00Crude Oil Market Analysis:
The recent daily chart of crude oil has been a fluctuating pattern of rising and falling prices, making us question our own future. Today, we maintain a bearish outlook. Every rebound presents a selling opportunity. We've been selling crude oil for months, and it's been fluctuating for months now, with no signs of a rebound or upward movement. Unless the weekly hurdle of 75 is broken, a significant rally is unlikely. Consider selling if it rebounds to 64.50 today.
Fundamental Analysis:
Today we will have ADP employment and unemployment benefits data.
Trading Recommendation:
Crude oil - Sell around 64.50, target 63.00-60.00

Learn Institutional Trading Part-4📌 What is Institutional Trading?
Institutional trading refers to the strategies, mindset, and techniques used by large financial institutions when they participate in the markets. These entities trade with huge volumes and require liquidity, accuracy, and control in their execution.
Unlike retail traders who might buy or sell a few lots or shares, institutions often enter with millions of dollars at a time. If they enter the market carelessly, they would move the price against themselves. Hence, they use highly calculated and strategic methods to enter and exit positions without creating obvious footprints.
These strategies are often referred to as Smart Money Concepts (SMC) — techniques that revolve around price manipulation, liquidity traps, and understanding market structure.
🎯 Why Do You Need to Learn Institutional Trading?
Most retail traders lose because:
They chase price.
They follow lagging indicators.
They get trapped in fake breakouts.
They trade based on emotions, not logic.
Institutional trading flips that mindset. You learn to:
Trade with the big players, not against them.
Identify where the real buying and selling is happening.
Understand why price reverses suddenly — often after retail entries.
Predict market moves based on logic and liquidity, not noise.
By learning how institutions think and act, you become a more disciplined, data-driven trader with higher probability setups and better risk management.
🧠 Core Concepts of Institutional Trading
Let’s dive into the most important concepts every institutional trader must understand:
1. Market Structure
Institutions operate within clear phases of market movement:
Accumulation: Smart money quietly builds positions in a range.
Manipulation: They fake breakouts or induce retail traders to create liquidity.
Expansion: The actual move begins in the intended direction.
Distribution: They offload their positions to late traders before reversing.
If you can identify these phases, you’ll always know where you are in the market — and what’s likely to come next.
2. Liquidity Pools
Liquidity is the fuel institutions need to place trades. They don’t use limit orders like retail traders. Instead, they seek zones with large clusters of stop-losses, pending orders, and breakout trades to enter and exit positions.
These zones are:
Swing highs and lows
Trendline breaks
Support/resistance levels
Retail breakout levels
You’ll often see the market spike into these areas and reverse — that’s not a coincidence. That’s institutional activity.
3. Order Blocks
An order block is a candle (usually bearish or bullish) where institutions placed large orders before a major market move. These zones often act as future supply and demand levels, where price returns to fill orders again.
Order blocks help you:
Identify powerful entry points.
Predict reversals or continuations.
Understand institutional footprints on the chart.
4. Fair Value Gaps (FVG)
A Fair Value Gap is a price imbalance between buyers and sellers — often created when institutions enter with speed and aggression. The market typically returns to fill this gap before continuing the trend.
FVGs are great for:
Entry confirmations
Predicting retracements
Identifying imbalance zones where price is “unfair”
6. Inducement & Mitigation
Inducement: Institutions create fake signals to trick retail traders into entering, generating the liquidity they need.
Mitigation: Institutions revisit previous zones to close old trades or rebalance positions — often creating hidden entries.
These tactics show how institutions intentionally manipulate price to maximize their position efficiency.
📊 Tools Institutional Traders Use
While many retail traders rely heavily on indicators like RSI, MACD, or Bollinger Bands, institutional traders focus more on:
Price action
Volume analysis
Open interest in options/futures
Liquidity maps
Time-based market behavior (sessions: London, NY, Asia)
Their edge comes from understanding what the market is doing, not what an indicator is telling them.
🧱 Institutional Risk Management
Institutions don’t gamble. Every trade is backed by:
Precise entry, stop-loss, and take-profit levels
Predefined risk percentages
Diversification and hedging
Capital allocation rules
They don’t revenge trade. They don’t overtrade. They focus on high-probability setups with calculated risk.
Retail traders can learn from this by:
Sticking to a trading plan
Managing emotions
Risking only a small % of their capital
Focusing on quality over quantity
📈 Institutional Trading in Action (Example)
Let’s say the market has been ranging for 3 days. Suddenly, price spikes up through a resistance level — a breakout! Retail traders jump in long.
But then, within minutes, price reverses sharply downward. Stop-losses are hit. Panic sets in.
What happened?
Institutions induced a breakout, used retail stop-losses as liquidity, filled their short positions, and now the real move — downward expansion — begins.
Understanding this flow helps you trade with the move, not against it.
👨🏫 Who Should Learn Institutional Trading?
This approach is ideal for:
Day traders looking for accurate short-term moves
Swing traders seeking strong trend setups
Options traders who want to align positions with institutional flow
Forex and crypto traders who want to stop chasing signals and start following structure
🚀 Benefits of Learning Institutional Trading
✅ Higher accuracy entries
✅ Better reward-to-risk ratios
✅ Less emotional trading
✅ Deeper understanding of price movement
✅ Freedom from lagging indicators
✅ Long-term trading consistency
🎓 Final Thoughts: Become the Hunter, Not the Hunted
Retail traders are often the prey in a game designed by institutions. But by learning institutional trading, you flip the script. You become the hunter — identifying setups, planning moves, and acting with precision.
Institutional trading is not about being right every time — it's about being strategic, calculated, and aligned with the flow of money

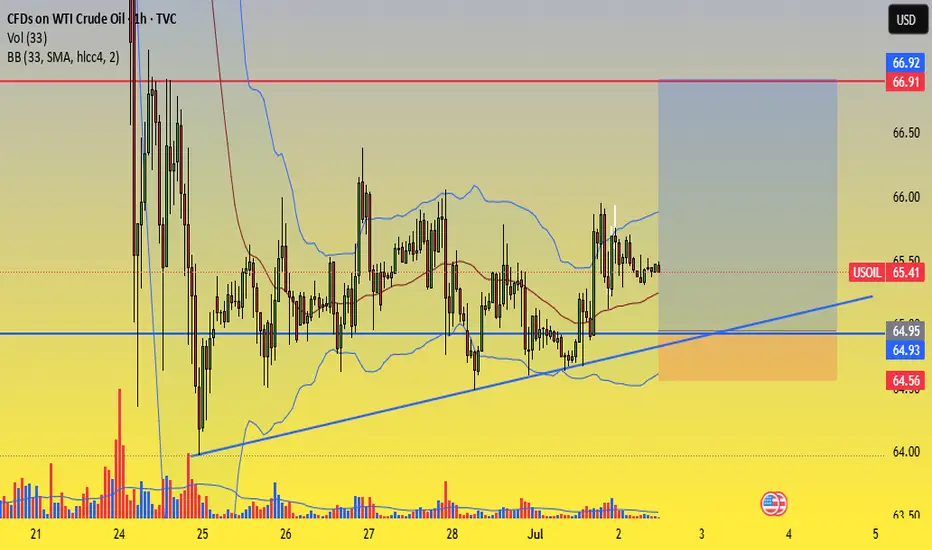
Trade Setup – BUY WTI Crude Oil (USOIL)✅ Trade Setup – BUY WTI Crude Oil (USOIL)
📅 Date: July 2–3, 2025
🕒 Timeframe: 1H
🎯 Trade Parameters:
Buy Zone (Entry): 65.00 – 64.90 USD/barrel
Stop Loss (SL): 64.55 USD (below rising trendline and lower Bollinger Band)
Take Profit (TP):
• TP1: 66.50 USD
• TP2: 67.00 USD
📊 Technical Analysis Highlights:
Rising trendline from June 24 continues to hold, forming a solid support area around 64.9–65.0.
Bollinger Bands are narrowing, indicating potential volatility expansion. Price is consolidating near the mid-band (MA20), often a precursor to bullish breakout.
Volume shows signs of accumulation around the trendline, suggesting buying interest at key support.
Multiple rejections from 64.90 without breakdown reinforces this level as near-term support.
🧭 Strategy Notes:
Enter on price pullback to the 65.00–64.90 zone with confirmation (e.g. bullish pin bar, engulfing pattern, volume spike).
Suggested position management:
• Take 50% profit at 66.50
• Hold the remaining 50% toward 67.00 if momentum is strong.
If price breaks below 64.55 with strong volume, exit the trade to preserve capital.
Good luck Everybody! Fl me here and ytb ! Thanks
US OIL ALERTSo, I've been checking out the oil market, and it seems like US oil seems to have good support right now, with solid support below $66 and resistance around $75. It could be a good time to buy if you trade with a minimal stop loss. Check out the chart and see if it fits your risk appetite!
XTIUSD next move from golden 61% level after Market structure Shift crude may move to grab LIQ from 68.4 level
my SL is 68
target is 71.25
I think crude is now bullish and ready for a bull run...

CRUDEOIL SHORT ENTRYCRUDE OIL weak below 5880.
Trend line Breakdown.
Ready For 5700-5600.
Weak Above 6050.
For Educational Purpose only.

Us oil VIEW OF MONDAY Us oil give upside momentum if he came 69.18 then a bullish move we can expect from here ✅✅✅✅✅✅✅✅✅✅✅✅

OIL INDIA LTDOil India Ltd #OIL
Resistance 530. Watching above 531 for upside movement...
Support area 520. Below 525-520 ignoring upside momentum for intraday
Support 520.Watching below 519 for downside movement...
Resistance area 530
Above 525-530 ignoring downside move for intraday
Charts for Educational purposes only.
Please follow strict stop loss and risk reward if you follow the level.

Crude Oil, Triangle Pattern forming and Target, Achieve +12% ROIA Triangle Pattern is forming in Crude Oil, with a Target at the Top of the Pattern and a potential to Achieve a +12% ROI. This is Long-Term Analysis, must follow the Trend continuation technique.

WTI (Crude Oil, Long H1/H4)It looks like WTI has a intraday buy signal at around 73.00 zone with stop loss below 72.00 , The minimum target will be 74.70 in the next few hours as the zeo political sentiments have improved, and external indicators are showing bullish signals. The RSI is mixed to bullish.

Expecting a Upside rally in Crude OilI am expecting a Upside rally in Crude Oil in next 2-3 months. The reason is after a big dip now Crude Oil is taking support at a Major support level and forming W pattern.

Crude long term bias for 2024I am expecting crude to hit 130.00 within the first two quarters next year. Sharing the long term bias

Crude OilCrude is basically going for 2022 Highs. Geopolitical concerns will fuel this rally. I am aiming for 118.00.
Not Financial Advice(NFA)

UK OIL 📈 Exciting Bullish Pattern Alert
📊 Pattern: Base Building
📌 Symbol/Asset: UK OIL
🔍 Description: The target of multiple patterns is pending, stock bounced back from solid support. Future & Options segment stock.
👉 Remember: Technical patterns are just one piece of the puzzle. Consider conducting further research, consulting with a financial advisor, and managing your risks appropriately.


Go Long On crude for $20 tgt ($95) On weekly to 10D & 12D charts, it's time to go long on oil. Use your 1h & 2h charts for entries as per your TS. Find chances to go long on pullbacks & other consolidation-b/o patterns . Tgt can take 15-30 days, though one can take multiple trades & book Profits at several intervals. Along with it, we need to keep an eye on copper long trades as well.
