OMUSDT - MAY OUTPERFORM ALTCOINSSymbol - OMUSDT
CMP - 6.8800
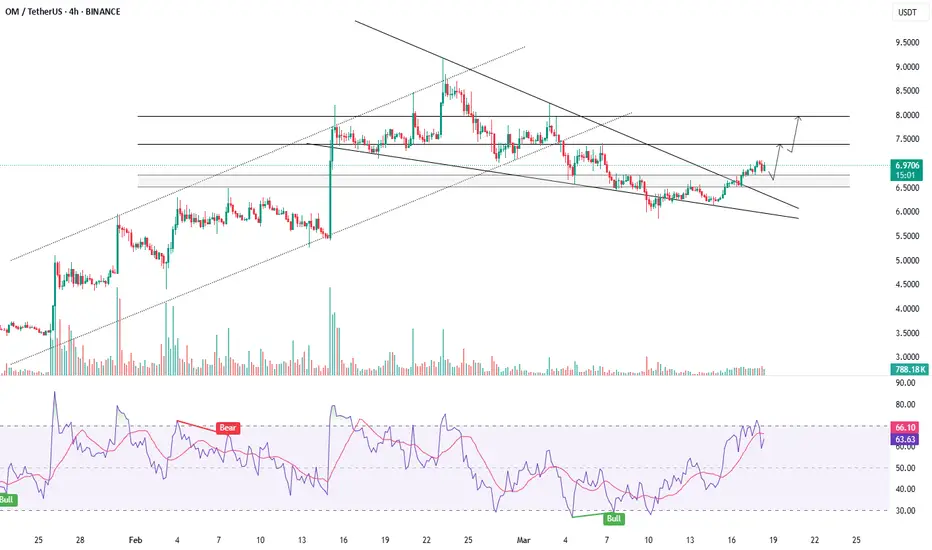
OMUSDT demonstrates greater strength compared to the broader market. Following a significant rally, a corrective phase has formed in the shape of a bearish wedge. Subsequently, the price has broken through resistance and is attempting to establish a consolidation above a key support level.
In the context of a generally weak market, OM Coin presents a promising outlook. The technical indicators suggest that there is notable interest in this coin, as the coin is exhibiting resilience and outperforming the market as a whole.
A breakout from the bearish wedge, which is serving as a consolidation pattern within the correction, appears to be underway. Should the bulls manage to sustain the coin's position above the previously breached resistance level and the base of the 6.75 reversal pattern, further growth could be expected in the short to medium term.
Key resistance levels: 7.39, 7.98
Key support levels: 6.75, 6.51
OMUSDT is one of the few assets showing upward momentum while Bitcoin is experiencing a decline. Attention should be given to the aforementioned support levels, as well as the local resistance at 7.05, A breakout above this resistance may trigger a continuation of the upward movement.
OMUSDT
OMUSDT - BULLISH MOMENTUM MAY PERSISTSymbol - OMUDST
CMP - 7.2828
OMUSDT remains an attractive asset, with consolidation forming in a flag pattern within the prevailing bullish trend. OMUSDT continues to form consolidation within the uptrend, and growth may follow if the resistance at the local channel is broken. The price structure appears robust, especially in contrast to the generally weak performance of the altcoin market.
Following Trump's speech yesterday, Bitcoin managed to surpass local resistance and entered the buying zone. If the price maintains a position above the 96.5K - 97K range and sustains its upward movement, certain altcoins may experience bullish momentum, which could propel them higher, including the already strong OMUSDT.
From a technical standpoint, the focus is on the local descending flag channel, with two critical support levels at 7.324 - 7.213. A false breakdown at these levels could trigger a continuation of the upward movement.
Key resistance: 7.755
Key support levels: 7.324, 7.213
The catalyst for continued growth lies in breaking through the channel boundary and the resistance at 7.755. Currently, the price is still distant from this zone and is approaching the support levels. A retest of the liquidity zone may culminate in a bullish impulse.

OMUSDT - TRIANGLE BREAKOUTSymbol - OMUSDT
OMUSDT is a noteworthy asset in the current market context, as it stands out as one of the few coins exhibiting bullish momentum while many altcoins are experiencing successive declines. The situation may be partially influenced by BTCUSD, should Bitcoin undergo a more significant downturn, this could impact the broader market, as no asset would be immune. However, locally, Bitcoin appears to be forming a resistance breakout. If the bullish trend persists, OMUSDT could find a catalyst to support its upward movement.
At present, attention is focused on the resistance level of the triangle pattern and the base of the 5.6755 structure. Two potential bullish scenarios should be considered: growth following a breakout above resistance or a rebound after a false breakdown of support.
Resistance levels: 5.9822, 6.3000
Support levels: 5.7500, 5.6755
Currently, the price is consolidating within the bounds of the triangle. However, once the resistance is broken, the market may enter a realization phase, with a potential sharp upward impulse. Beyond the 6.3000 level, there are no significant resistance levels to be encountered.

PENDLE CHART ANALYSIS : LONG OR SHOT? SEED_DONKEYDAN_MARKET_CAP:PENDLE is currently facing resistance and CRYPTOCAP:BTC is struggling to clear main resistance at 67k. If PENDLE doesn't hold current price at 4.30 zone, next support stands at 3.40 zone, which is also a mid supply zone.
In case of bullish move from support or from current price value 6.00 level is most likely to happen in few weeks.

TECHNICAL ANALYSIS $OM 12-JULIt is a fact that in an uptrend, the price just keeps increasing. Until it doesn't increase anymore (breaking the important demand zone).
So our job is to find this important demand area, which is considered half of the success.
If the search is not accurate, it doesn't matter because you place SL after this zone and the last trick is capital management.
When the price touches Supply or Demand, there is no guarantee that it will decrease or increase further. But if there is confirmation in a small frame, it will be a big support factor.
Canh LONG NASDAQ:OM and remember to manage your capital.

OM USDT COIN LEVELS 04.11.2021 (1Hr Candle)OM USDT COIN once breaks 0.2445 at 1hr candle closing ,it will fly
