Retail Panic Meets ETF Outflows: $1B Bitcoin Sell-Off Hits MarkeRetail Panic Meets ETF Outflows: $1B Bitcoin Sell-Off Hits Markets
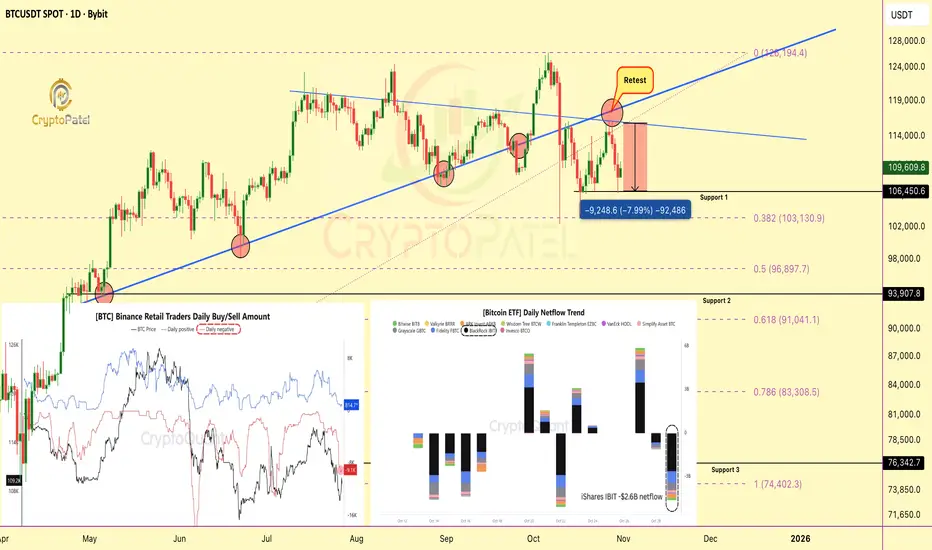
Bitcoin saw renewed selling pressure on Oct 30, as Binance retail traders dumped over 9,200 BTC (~$1B) around $107.7K, just days after another 12,000 BTC sell wave near $108.3K.
Technical View:
Retail traders are aggressively selling into weakness, while long-term holders remain largely inactive.
Historically, these sharp sell-offs from short-term players often form local bottoms, liquidity events where smart money quietly accumulates.
Fundamental Side:
Spot Bitcoin ETFs added more weight to the downside:
🔹 BlackRock: -$2.6B
🔹 Fidelity: -$790M
🔹 Grayscale: -$500M
These ETF outflows likely shifted capital to spot exchanges, amplifying short-term selling pressure.
Key Insight:
▶️ Retail capitulation + ETF outflows = short-term volatility
▶️ But remember, markets often bottom when retail panic peaks.
Note: NFA & DYOR
Onchain
BTC-USDBTC continues to be trapped in the ongoing tussle between bulls and bears. Even after its recent breakdown to make a recent low of 28.8K, bulls showed an impressive buying strength from that level to close the last weekly candle at $34.7K, it recovered ~20% from this low. It formed an indecisive candle with a long lower wick that shows strong accumulation in the market. The CMP of BTC is sustaining above $34.5K
On the weekly TF, BTC s still holding its 50-WEMA placed at $33.7K from the last 6 weeks, it has tried to breach this range multiple times but none of the weekly candles has closed below this range until now, which depicts that accumulation is going on at the lower levels. Below this support, the next potential support is present at $30K, followed by the next support at $28K.
The sideways trend is currently lying in the range of $32K-$36K. The immediate resistance is presented by its 20-DEMA, placed at $35.2K.If we get a decisive breakout from this level, the next significant hurdle is placed at $38K, followed by the next major resistance at $40K.
On-Chain indicators are also depicting mixed signals. BTC’s mining hash rate hits its 13-month low whereas, in the last 30 days, long term hodlers have accumulated almost 579,940 BTC to their holdings while short-term have reduced their holdings by 521,983 BTC.
Therefore, it is evident that the current market structure is clearly in rangebound trend and breakout from the above-mentioned levels will confirm the move ahead.
