$ONDO ALTSEASON SETUP | 5,000%+ EXPANSION IF MACRO DEMAND HOLDSONDO is currently trading at a major weekly demand zone after an ~85% drawdown from ATH. While price action remains weak, on-chain data suggests silent accumulation, indicating potential smart money positioning ahead of the next cycle.
Market Structure (Weekly)
Bearish divergence confirmed at $2.14, marking the macro top
Breakdown + retest of the $0.73–$0.80 support zone → now acting as resistance
Price has entered a high-timeframe demand zone between $0.30–$0.20
A final retracement into bullish order flow ($0.32–$0.20) remains possible
Bullish bias remains valid above $0.20 (weekly close)
On-Chain Context (Jan 18, 2026 – 1.94B ONDO Unlock):
Whale spot orders dominating market activity
$0.35–$0.40 acting as an accumulation range
90D CVD trending higher → buy pressure outweighs sell pressure
Taker-buy dominance → aggressive smart money absorption
This behavior suggests unlock supply is being absorbed, not distributed.
Upside Projections (HTF Expansion)
Targets: $0.70 → $1.00 → $2.00 → $5.00–$10.00
Structure supports a potential RWA-led expansion into 2026 if demand holds
Key Level to Watch
Invalidation: Weekly close below $0.20
This $0.32–$0.20 zone may be the final bullish base for ONDO ahead of the next alt-season cycle
TA Only. Not Financial Advice. DYOR.
ONDO

$ONDO PRICE FORECAST | IS $7.65+ POSSIBLE? | CRYPTOPATEL TALSE:ONDO Is Trading At A High-Timeframe Fibonacci Demand Zone, Holding The 0.618 Retracement (~$0.45) After A Deep Corrective Move — A Textbook Accumulation Structure.
Technical Structure
Accumulation Zone: $0.40–$0.45
Bullish Order Block / Deeper Demand: $0.25–$0.30 (0.786 Fib)
HTF Structure Remains Valid Above $0.25
Structural Flip Can Trigger Impulsive Expansion
Price Targets: $0.82 → $1.20 → $2.15 → $7.65+
As Long As Demand Holds, ONDO Remains Positioned For A Multi-Leg Cycle Expansion With 2000%+ Upside Potential.
Accumulation Phase In Progress — Patience Is Key.
Technical Analysis Only | Not Financial Advice

$ONDO PRICE FORECAST | IS $7.65+ POSSIBLE?LSE:ONDO is currently trading inside a high-timeframe Fibonacci demand zone after a deep corrective move. Price is holding above the 0.786 retracement, suggesting a potential accumulation phase rather than continuation to the downside.
This structure is consistent with HTF accumulation behavior, where patience is required before expansion.
\
Technical Structure Overview:
HTF Accumulation Zone: $0.45 – $0.35
Bullish Order Block / Deeper Demand: $0.30 – $0.25 (0.786 Fib)
HTF Market Structure Remains Valid Above: $0.25
Breakout Potential: Once local structure flips bullish
Current Phase: Accumulation → No confirmation yet
As long as demand holds above the key HTF support, LSE:ONDO remains technically positioned for a multi-leg expansion during the next impulsive phase.
Upside Targets (HTF):$1.00/$2.00/$4.00/$7.65 – $8.00+
A sustained move from this base could support a strong cycle expansion, provided market conditions align.
TA only | Not financial advice | Always DYOR

$ONDO Could Be the Next 20x Gem: Are You Ready?LSE:ONDO Could Be the Next 20x Gem: Are You Ready?
Currently in bearish breakdown, but if price falls below $0.50, IMO best accumulation zone starts.
Strong Support Zones:
Support 1: $0.53–$0.46
Support 2: $0.24–$0.20
Targets (Long Term): $5 / $10 (~20x from entry if filled)
Manage risk & DYOR, huge upside if supports hold!

ONDO – Long Spot Trade Setup from 20-Day SMA ReclaimONDO is showing early signs of strength by reclaiming the 20-day SMA following a successful retest of both the SMA and key horizontal support. This confluence signals a potential continuation of the uptrend and presents an attractive long spot opportunity.
🔹 Entry Zone:
$0.92 – $0.97 (support + 20-day SMA confluence)
🎯 Take Profit Targets:
🥇 $1.15 – $1.25 (recent high & resistance cluster)
🥈 $1.40 – $1.55 (macro target zone, possible extension if trend strengthens)
🛑 Stop Loss:
Just below $0.87 (tight invalidation if price breaks below local structure and SMA)
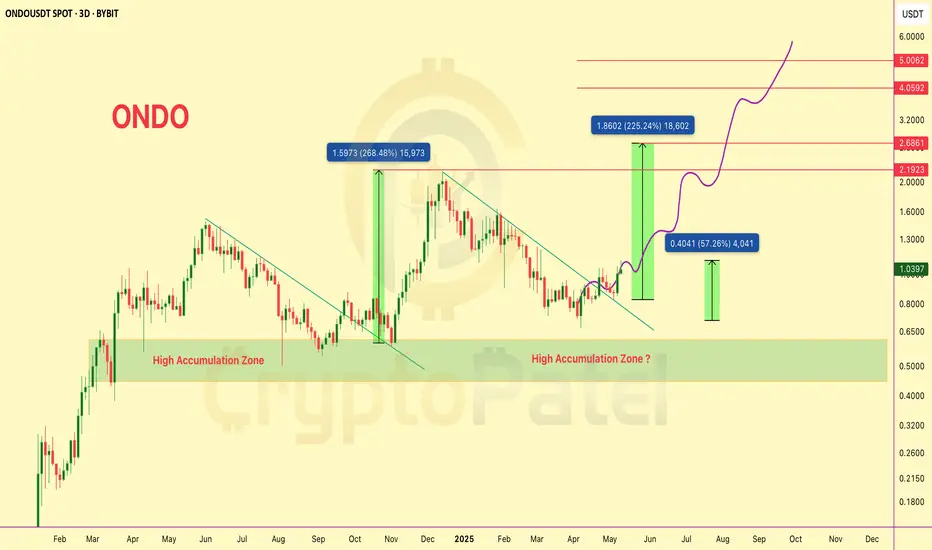
$ONDO/USDT Technical Analysis – Next Move Loading?$ONDO/USDT Technical Analysis – Next Move Loading?
#ONDO just broke out of a long-term descending trendline resistance and is now preparing for its next major wave.
We already shared the dip-entry below $0.80 — and it’s now up 57% from that zone!
Hope you're enjoying the ride.
Chart Highlights:
▶️ Clear breakout from multi-month downtrend.
▶️ Price bounced strongly from the High Accumulation Zone ($0.80-$0.50).
▶️ Previous breakouts resulted in +268% and +225% rallies.
▶️ Short-term move toward $1.30–$1.40 possible if support holds.
▶️ Targets: $2.19 → $2.68 → $4.05 → $5.00+
A healthy pullback or consolidation above $1 could offer the next breakout leg toward $2+.
Stay alert. Accumulation looks complete, and momentum is shifting bullish fast.
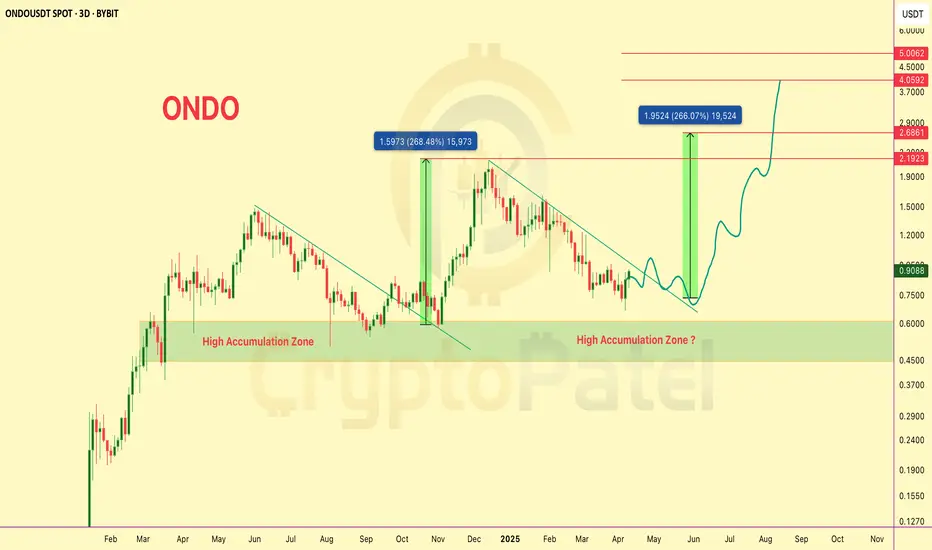
$ONDO/USDT – 3D Chart Analysis (Fractal-Based Outlook)$ONDO/USDT – 3D Chart Analysis (Fractal-Based Outlook)
🔰 Pattern Recognition & Fractal Analysis:
▪️ ONDO previously broke out from a falling wedge pattern in late Q4 2024, resulting in a +268% rally.
▪️ Current price action mirrors that historical fractal, again forming a descending channel with strong demand visible around the $0.60–$0.45 zone — marked as a High Accumulation Zone.
🔰 Current Market Structure:
▪️ Price has respected the descending resistance trendline and now shows signs of breakout attempt.
▪️ A recent bullish engulfing candle near the lower boundary of the accumulation zone suggests potential reversal.
▪️ Volume is picking up, aligning with previous breakout volume behavior.
🔰 Key Technical Zones:
▪️ Accumulation Zone: $0.60 – $0.45
▪️ Immediate Resistance: $1.20 (psychological)
▪️ Breakout Confirmation: Weekly close above $1.30
▪️ Fibonacci Extensions:
1.618 Fib Target: $2.18
2.618 Fib Target: $2.68
Final Bullish Extension: $4.05–$5.00 zone
🔰 Future Projection (Fractal Repeat):
▪️ If breakout mirrors previous fractal, expect ~266% upside — targeting $2.60+ in the next 2–3 months.
▪️ Intermediate pullbacks likely near $1.50 and $2.20 due to historical liquidity zones.
⚠️ Risk Management Note:
▪️ Invalidity below $0.45. If price fails to hold the current range, possible revisit to $0.30–$0.25 range.
▪️ Traders should monitor for volume confirmation and potential bullish divergence on LTFs (Lower Timeframes).
📌 For more real-time analysis, stay tuned. More fractal setups dropping soon.
$ONDO Near Golden Entry Zone: Is $ONDO Ready for a 5x Move?LSE:ONDO Technical Analysis & Bull Market Outlook
LSE:ONDO is currently trading near a key accumulation zone, aligning with the 0.786 Fibonacci retracement level, which historically signals a high-probability bounce area in strong trending markets.
Accumulation Strategy
Ideal accumulation zone lies between $0.80 - $0.60. DCA (Dollar-Cost Averaging) approach recommended on major dips for optimal positioning before the breakout confirmation.
Historical Breakout Behavior
In the last HTF (High Time Frame) breakout, ONDO delivered a +200% move post-breakout. Based on current consolidation and market structure, a potential 400%-500% upside is anticipated if similar breakout structure plays out.
Upside Targets in Bull Case: $2/$5/$10
Why Still Bullish?
* Clean structure on daily and 4H TFs.
* Strong demand near 0.786 FIB.
* Institutional interest confirmed:
Trump’s World Liberty Finance acquired 342,002 LSE:ONDO , investing $505,218 at an average entry of ~$1.47 — current price is trading ~45% lower, indicating strong long-term conviction.
Not financial advice. Strictly TA-based view. Manage risk accordingly.
ONDO TRADE IDEA#ONDO FINANCE
Ondo Finance is a cutting-edge RWA (Real World Assets) project, building the next generation of financial infrastructure to enhance market efficiency, transparency, and accessibility.
⚡️ Accumulation Opportunity: Consider accumulating ONDO within the specified buy zone for potential gains in the short to mid-term.
🔈Buy Zone: $0.75 - $0.70
Selling Targets:
• Target 1: $0.98 (Short-term)
• Target 2: $1.12
• Target 3: $1.28
• Target 4: $1.50
🚨 Stop-Loss: $0.64
💡 Analysis: ONDO is gaining volume and has claimed the 200, 100, and 50 EMAs. A breakout is anticipated soon, making this an ideal time to accumulate in #Spot within the buy range.

ONDO MARKET ANALYSIS Amid huge market crash all over the world, ONDO was one of the coins which quick rebound and nicely recovered loss. The chart shows that 0.55 was critical level which it cleared in quick session. But it didn't clear resistance at 0.72 level. Current price is good looking new support.
First major resistance is 0.90 region if it successfully crosses 0.72 level.
Currently we are looking for 0.90 pr8ce level then 1.20 level in short & mid term.

ONDO: Inverse Head and Shoulders Signals Upcoming Breakout🚀💎 Paradisers, after significant consolidation, #ONDOUSDT is showing an inverse head and shoulders pattern, which increases the likelihood of a bullish move.
💎 If #ONDO breaks above the resistance level and closes a candle above it, this will validate the inverse head and shoulders pattern, and we can then expect a bullish move.
💎 In the case of a pullback, we can expect a bounce from the bullish Order Block (OB) + Fair Value Gap (FVG) zone. Remember that if the price goes below the right shoulder, it will invalidate the inverse head and shoulders pattern.
💎 However, if the price doesn't show any bullish signs at the bullish OB and falls below it, closing the candle below, then it will invalidate our idea. In that case, it would be better to wait for more favorable price action to develop.

ONDO: Watch for Potential Shift 🚀💎 ONDO is currently demonstrating a bullish market structure, notably breaking above the bearish order block (OB) with a fair value gap (FVG), indicating a potential shift in sentiment.
💎With ONDOUSDT breaking above the bearish OB, it is now considered a Breaker Block (BB). If the price retraces below the BB and touches the FVG, particularly in the discount zone (Below FIB 50%), and exhibits signs such as CHoCH (Change of Character) or any other bullish indications, it suggests that liquidity within the inner range has been absorbed, potentially setting the stage for a move towards external range liquidity.
💎In simpler terms, I anticipate a bullish move from either the Bullish OB level or the FVG if the price shows signs of CHoCH or other bullish signals.
💎However, if the price breaks down below the bullish OB and the supportive trendline, it would technically be considered bearish. Nevertheless, considering the overall bullish trend in the market, I would disregard this bearish scenario and wait for clearer bullish signals before adjusting trading strategies.
