$ONDO Could Be the Next 20x Gem: Are You Ready?LSE:ONDO Could Be the Next 20x Gem: Are You Ready?
Currently in bearish breakdown, but if price falls below $0.50, IMO best accumulation zone starts.
Strong Support Zones:
Support 1: $0.53–$0.46
Support 2: $0.24–$0.20
Targets (Long Term): $5 / $10 (~20x from entry if filled)
Manage risk & DYOR, huge upside if supports hold!
ONDOUSDT

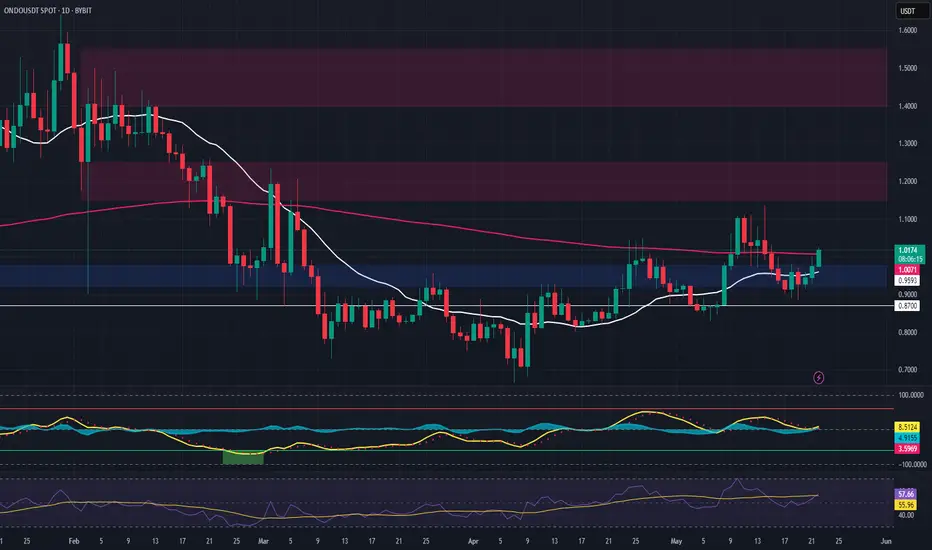
ONDO – Long Spot Trade Setup from 20-Day SMA ReclaimONDO is showing early signs of strength by reclaiming the 20-day SMA following a successful retest of both the SMA and key horizontal support. This confluence signals a potential continuation of the uptrend and presents an attractive long spot opportunity.
🔹 Entry Zone:
$0.92 – $0.97 (support + 20-day SMA confluence)
🎯 Take Profit Targets:
🥇 $1.15 – $1.25 (recent high & resistance cluster)
🥈 $1.40 – $1.55 (macro target zone, possible extension if trend strengthens)
🛑 Stop Loss:
Just below $0.87 (tight invalidation if price breaks below local structure and SMA)
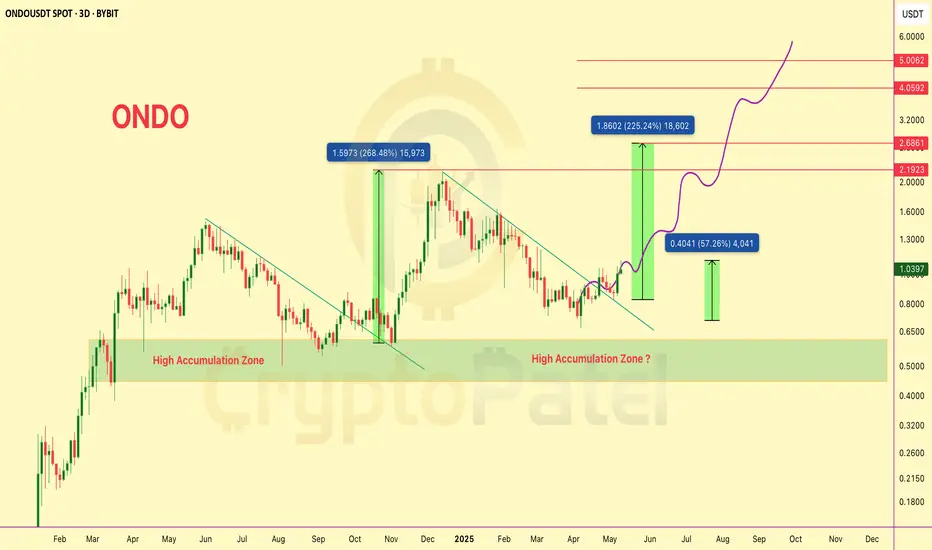
$ONDO/USDT Technical Analysis – Next Move Loading?$ONDO/USDT Technical Analysis – Next Move Loading?
#ONDO just broke out of a long-term descending trendline resistance and is now preparing for its next major wave.
We already shared the dip-entry below $0.80 — and it’s now up 57% from that zone!
Hope you're enjoying the ride.
Chart Highlights:
▶️ Clear breakout from multi-month downtrend.
▶️ Price bounced strongly from the High Accumulation Zone ($0.80-$0.50).
▶️ Previous breakouts resulted in +268% and +225% rallies.
▶️ Short-term move toward $1.30–$1.40 possible if support holds.
▶️ Targets: $2.19 → $2.68 → $4.05 → $5.00+
A healthy pullback or consolidation above $1 could offer the next breakout leg toward $2+.
Stay alert. Accumulation looks complete, and momentum is shifting bullish fast.
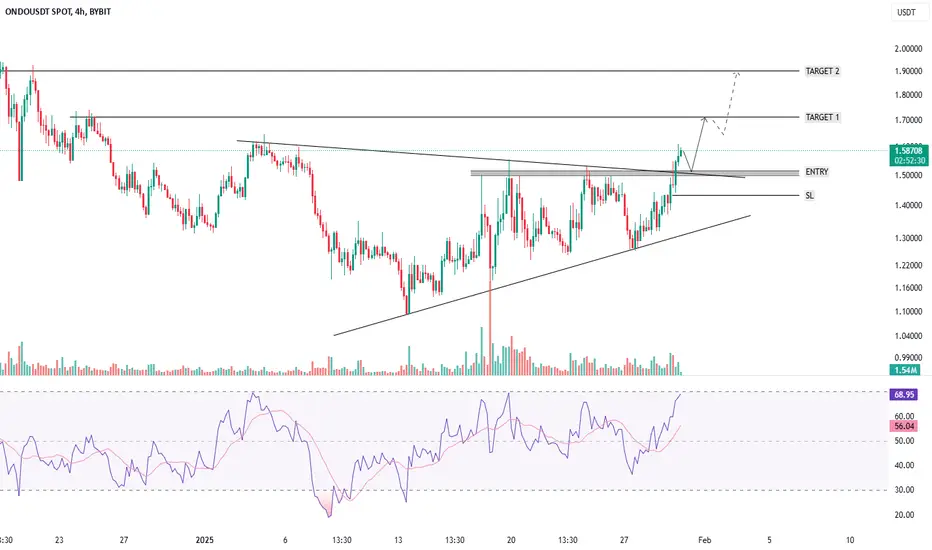
ONDOUSDT - TRIANGLE PATTERN BREAKOUT - BULLISH OUTLOOKSymbol - ONDOUSDT
ONDOUSDT continues to demonstrate an upward trend, with periodic cyclical counter-trend corrections. The chart is currently indicating a potential conclusion of the correction phase, suggesting a readiness for further upward movement. A significant consolidation pattern has developed within the context of the prevailing uptrend. In this regard, the price is attempting to break above the consolidation resistance (triangle) and surpass the next key resistance level at 1.538. This level is of particular importance. Should the bulls successfully maintain support above 1.538, ONDO may experience a recovery towards the 1.7–1.9–2.15 range in the short to medium term.
Support levels: 1.538, 1.44
Resistance levels: 1.7344, 1.90
A minor pullback to support, followed by a false breakdown, remains a possibility. However, sustained price consolidation above this level would confirm readiness for upward movement. Entry, SL & Target levels are indicated on the chart.
Technical Analysis OndoThe current technical analysis for Ondo (ONDO) shows a mixed sentiment across various time frames. Here are Chart for your refecence

ONDO TRADE IDEA#ONDO FINANCE
Ondo Finance is a cutting-edge RWA (Real World Assets) project, building the next generation of financial infrastructure to enhance market efficiency, transparency, and accessibility.
⚡️ Accumulation Opportunity: Consider accumulating ONDO within the specified buy zone for potential gains in the short to mid-term.
🔈Buy Zone: $0.75 - $0.70
Selling Targets:
• Target 1: $0.98 (Short-term)
• Target 2: $1.12
• Target 3: $1.28
• Target 4: $1.50
🚨 Stop-Loss: $0.64
💡 Analysis: ONDO is gaining volume and has claimed the 200, 100, and 50 EMAs. A breakout is anticipated soon, making this an ideal time to accumulate in #Spot within the buy range.

ONDO MARKET ANALYSIS Amid huge market crash all over the world, ONDO was one of the coins which quick rebound and nicely recovered loss. The chart shows that 0.55 was critical level which it cleared in quick session. But it didn't clear resistance at 0.72 level. Current price is good looking new support.
First major resistance is 0.90 region if it successfully crosses 0.72 level.
Currently we are looking for 0.90 pr8ce level then 1.20 level in short & mid term.

ONDO: Inverse Head and Shoulders Signals Upcoming Breakout🚀💎 Paradisers, after significant consolidation, #ONDOUSDT is showing an inverse head and shoulders pattern, which increases the likelihood of a bullish move.
💎 If #ONDO breaks above the resistance level and closes a candle above it, this will validate the inverse head and shoulders pattern, and we can then expect a bullish move.
💎 In the case of a pullback, we can expect a bounce from the bullish Order Block (OB) + Fair Value Gap (FVG) zone. Remember that if the price goes below the right shoulder, it will invalidate the inverse head and shoulders pattern.
💎 However, if the price doesn't show any bullish signs at the bullish OB and falls below it, closing the candle below, then it will invalidate our idea. In that case, it would be better to wait for more favorable price action to develop.

ONDO: Watch for Potential Shift 🚀💎 ONDO is currently demonstrating a bullish market structure, notably breaking above the bearish order block (OB) with a fair value gap (FVG), indicating a potential shift in sentiment.
💎With ONDOUSDT breaking above the bearish OB, it is now considered a Breaker Block (BB). If the price retraces below the BB and touches the FVG, particularly in the discount zone (Below FIB 50%), and exhibits signs such as CHoCH (Change of Character) or any other bullish indications, it suggests that liquidity within the inner range has been absorbed, potentially setting the stage for a move towards external range liquidity.
💎In simpler terms, I anticipate a bullish move from either the Bullish OB level or the FVG if the price shows signs of CHoCH or other bullish signals.
💎However, if the price breaks down below the bullish OB and the supportive trendline, it would technically be considered bearish. Nevertheless, considering the overall bullish trend in the market, I would disregard this bearish scenario and wait for clearer bullish signals before adjusting trading strategies.
