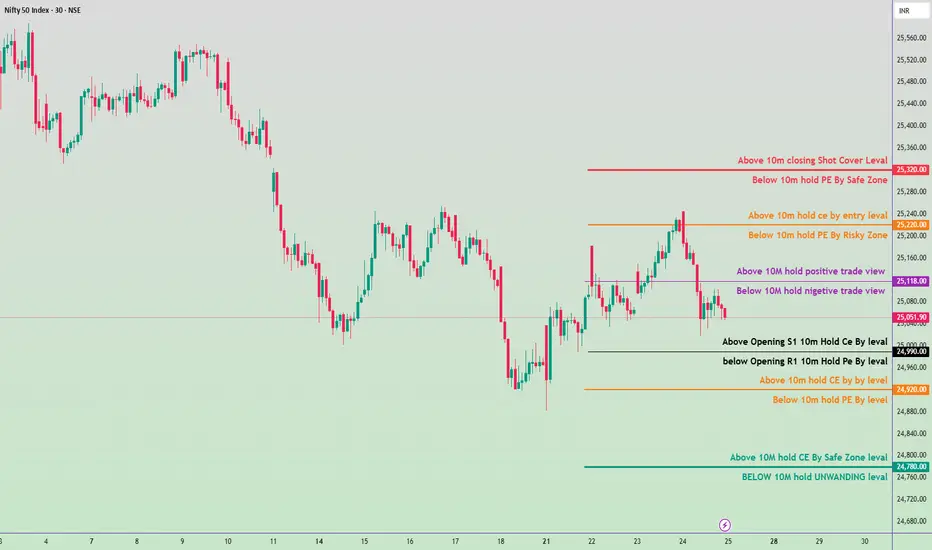
Nifty 50 Intraday Trade Plan for 25th July 2025🔍 Trade Zones & Strategy Breakdown:
🔴 Strong Resistance Zone:
25,320 – Above 10M Closing Short Cover Level
⚠️ If price moves above this level, expect short covering.
CE (Call Option) can be held with strict SL (stop loss) below 25,280.
🟠 Safe-to-Risky PE Holding Zone:
25,280 – Below 10M Hold PE by Safe Zone
25,220 – Below 10M Hold PE by Risky Zone
🟡 Between these levels is the PE (Put Option) hold zone with decreasing safety.
🟧 Entry CE Level (Low Risk Long Entry):
25,240 – Above 10M Hold CE by Entry Level
🟣 Neutral Zone / Trend View Levels :
25,118 – Above 10M → Positive Trade View
25,118 – Below 10M → Negative Trade View
👀 This is a sentiment-shifting level. Break above or below can set the trend for the day.
⚫ Opening Range Based Action:
24,990 – Above Opening S1 → Hold CE (Call Option)
24,990 – Below Opening R1 → Hold PE (Put Option)
🟨 R eversal/Entry Confirmation Area:
24,920 – Above 10M Hold CE by Level
24,880 – Below 10M Hold PE by Level
🟩 Support & Final Defense Zone:
24,800 – Above 10M Hold CE by Safe Zone
24,760 – BELOW 10M = Unwinding Level
⛔ If price falls below 24,760, aggressive unwinding or fresh PE (Put Option) entry possible.
Option
Nifty 50 Intraday Plan for July 22, 2025🔼 Bullish Levels (Call Side - CE):
Above 25,038 : If the market opens and sustains above this level for 10 minutes, you can consider buying CE. This is the first breakout point, indicating possible upward movement.
Above 25,128: Holding above this level indicates a positive trade view. Momentum is expected to increase, and buyers may become more aggressive. Good zone to initiate or add to CE positions.
Above 25,260 : This is the CE entry level where breakout confirmation happens. If price reaches and sustains this zone, it signals strong bullish strength.
Above 25,380 : This is marked as the short-covering zone. If the price reaches here, it means many short traders may exit, creating a spike. Ideal for booking profits on CE trades.
🔽 Bearish Levels (Put Side - PE):
Below 25,038 : If the price fails to sustain above this level and breaks down with 10-minute candle confirmation, it indicates weakness. PE trades can be considered from here.
Below 24,938 : This level is a clear PE entry level. Sustained trading below this suggests downward continuation.
Below 24,920 : This is the risky PE zone. If the market trades here, PE positions should be handled with caution unless strong selling pressure is seen.
Below 24,800 : This is a safe PE zone. Breakdown below this signals confirmed bearish sentiment, and you can aggressively hold PE options.
Below 24,780 : This is the unwinding level, meaning big players may start exiting their positions, possibly triggering sharp declines. Ideal for booking PE profits or trailing stop-loss tightly.

Monday Trade Plan (Nifty 50) 🔼 Bullish Levels (Call Side Entry):
Above 25,008
🔹 Hold CE (Call) — Positive trade view.
Above 25,118
🔹 Hold CE by Entry Level
🚨 Below this: Risky Zone for PE (Put)
Above 25,218
🔹 10 min Closing Short Cover Level
✅ Strong momentum expected above this zone
🔽 Bearish Levels (Put Side Entry):
Below 25,000
🔻 Hold PE — Negative trade view.
Below 24,888
🔻 Opening R1 10m — Hold PE by level
Below 24,788
🔻 Hold PE by level
Below 24,688
🔻 Hold PE by Safe Zone level
Below 24,600 (Approx)
🧯 UNWINDING ZONE
🔻 Strong downward momentum expected
⚠️ Mid-Zone / Risk Areas:
Between 25,000 – 25,008: No clear direction
Between 25,088 – 25,118: Risky Zone for PE
Between 24,788 – 24,888: Rangebound area, watch for breakout

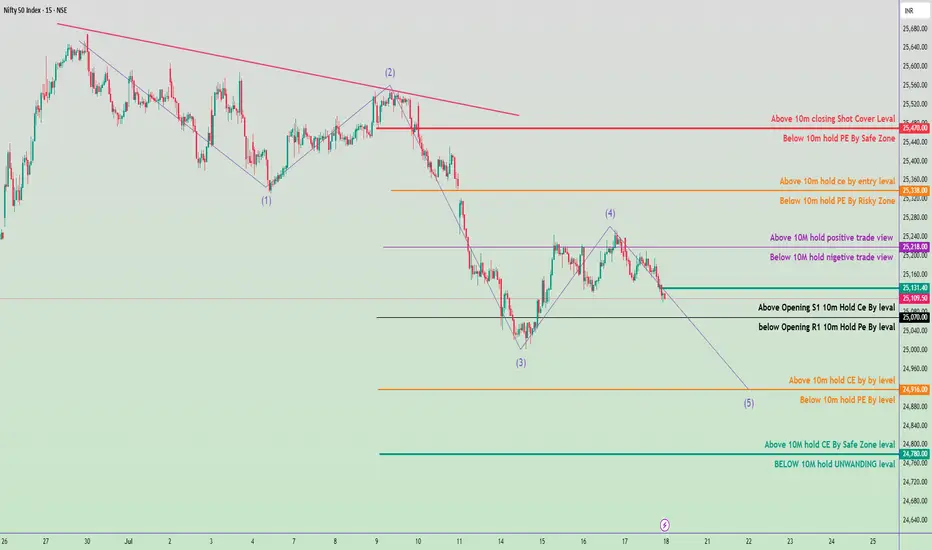
Trade plan for tomorrow (July 18, 2025)📈 Bullish Trade Plan (Alternative Scenario)
✅ S etup 3: Call Option Trade (CE)
Trigger: Price moves above 25,218 with volume
Action: Buy 25,200 CE or 25,300 CE
Target 1: 25,338
Target 2: 25,470
Bearish Trade Plan (Primary Bias)
✅ Setup 1: Directional Put Option Trade (PE)
Trigger: Break below 25,070
Action: Buy 25,000 PE or 24,900 PE
Target 1: 25,000
Target 2: 24,916
Target 3: 24,780
Current Context:
Nifty is forming a classic Elliott Wave pattern, currently likely in Wave (5) down.
Trend: Bearish bias unless 25,218 is reclaimed.
Key Support Zone: 25,070 – 25,000
High Probability Target for Wave (5): Around 24,780–24,760
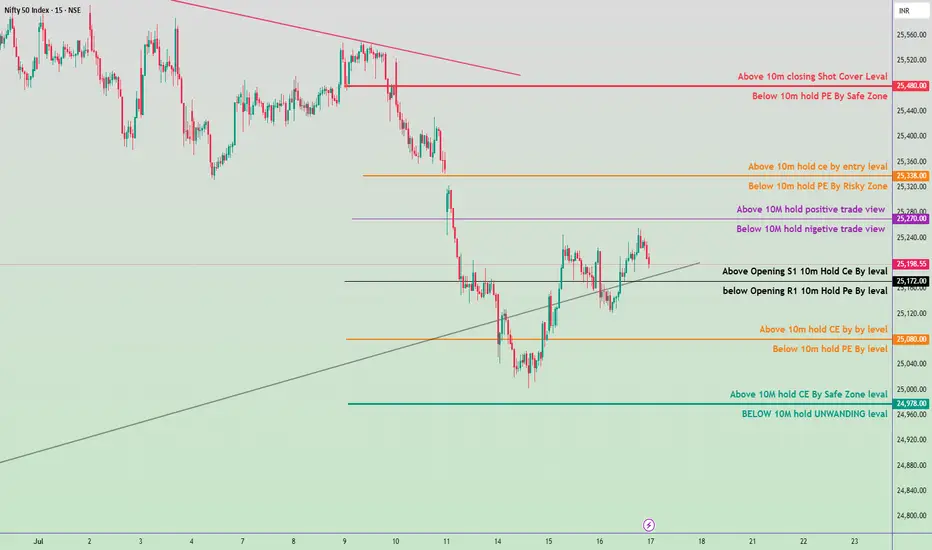
Nifty 50 Intraday Trade Plan - 17 July 2025🔴 Bullish Scenario (CE Buy Zones):
Above 25,480 → Shot Cover Level
→ CE BUY with strong momentum.
Above 25,338 → Entry Level for CE
→ CE BUY possible; moderate conviction.
Above 25,270 → Positive Trade View Starts
→ Start building CE positions cautiously.
Above 25,198.55 (Opening S1 Level)
→ Intraday CE HOLD if already bought.
Above 25,080 → CE by Buy Level
→ Entry-level for CE if market recovers.
Above 24,978 → CE Buy Safe Zone
→ Safer entry for CE, if bounce observed.
🔵 Bearish Scenario (PE Buy Zones):
Below 25,480 → PE by Safe Zone
→ PE can be added gradually.
Below 25,338 → Risky Zone for PE
→ PE buy with risk, SL tight.
Below 25,270 → Negative View Begins
→ Confidence increases in PE position.
Below 25,172 (Opening R1 Level)
→ If breaks this, PE HOLD.
Below 25,080 → PE by Buy Level
Below 24,978 → UNWINDING Level
→ Expect strong selling; PE aggressive buy zone.
🎯 Key Zones to Watch:
Range Bound Zone: Between 25,172 – 25,270
Trend Decider Zone:
Break above 25,270: Bullish Bias
Break below 25,172: Bearish Bias
Nifty 50 – Intraday Plan for July 16, 2025📊 Intraday Key Levels & Strategy:
🔺 Upside Zones (CE Bias):
25,270 – Above 10M hold = Positive Trade View
25,390 – Above 10m hold CE by entry level
25,478 – Above 10m closing = Shot Cover Level
⚠️ Neutral to Mixed Zones:
25,120 – Above Opening S1: 10m Hold CE Buy Level
25,100 – Below Opening R1: 10m Hold PE Buy Level
25,070 – Below 10M = Negative Trade View
🔻 Downside Zones (PE Bias):
24,990 – Below 10m hold PE by level
24,920 – Below 10m hold PE = Risky Zone
24,880 – Above 10M = CE Safe Zone
24,860 – BELOW 10M = UNWINDING zone.
✅ Suggested Intraday Plan:
Bullish Scenario (CE Trades):
Buy CE above 25,120 (Only if 10 min candle holds).
Add on breakout & hold above 25,270.
Target zone: 25,390–25,478.
SL: Below 25,070.
Bearish Scenario (PE Trades):
Sell/Buy PE below 25,100 (Only if 10 min candle sustains).
Confirm further weakness if below 24,990 or 24,920.
Target zone: 24,880–24,860.
SL: Above 25,120.

Nifty 50 Intraday Trade Plan July 15, 2025🔴 Upper Resistance Levels:
25,430.00
🔺 Above 10m closing: Short Cover Level
🔻 Below 10m: Hold PE (Safe Zone)
25,280.00
🔺 Above 10m: Hold CE (Entry Level)
25,240.00
🔻 Below 10m: Hold PE (Risky Zone)
25,160.00
🔺 Above 10M: Hold Positive Trade View
🔻 Below 10M: Hold Negative Trade View
🟢 Current Zone:
Market is trading near 25,087.10
Watch levels:
25,030.00 – Above Opening S1: Hold CE by level
25,000.00 – Below Opening R1: Hold PE by level
🟠 Lower Support Levels:
24,960.00
🔺 Above 10m: Hold CE by level
24,920.00
🔻 Below 10m: Hold PE by level
24,800.00
🔺 Above 10M: Hold CE by Safe Zone
24,760.00
🔻 Below 10M: UNWINDING Level
🔍 Strategy Suggestions:
✅ Bullish Bias:
If price sustains above 25,160, consider Call Option Buy (CE) or bullish trades.
❌ Bearish Bias:
If price fails below 25,030 or 24,920, consider Put Option Buy (PE) or short positions.

Institutional Option Trading Part -xTrading Techniques
Block Trading: Large, privately negotiated trades.
High-Frequency Trading (HFT): Using algorithms for rapid-fire trades.
Algorithmic Trading: Automated trading based on predefined criteria.
Technology in Institutional Trading
Low Latency Networks: For speed advantage.
Advanced Algorithms: For market making, arbitrage, and execution.
Data Analytics: Real-time analysis to inform trading decisions.
Market Impact and Regulations
Institutional traders can move markets, prompting regulatory oversight.
Regulatory Bodies:
SEC (U.S.): Securities and Exchange Commission.
FINRA (U.S.): Financial Industry Regulatory Authority.
SEBI (India): Securities and Exchange Board of India.
Key Regulations:
Reporting Requirements: Large trades must be reported.
Fair Trading Practices: Prevent market manipulation.
Risk Controls: Institutions must manage trading risks appropriately.

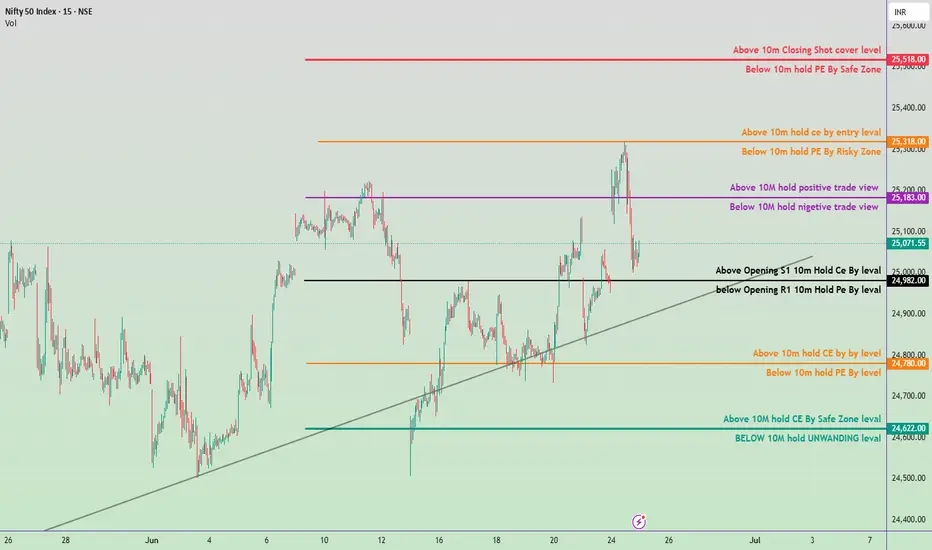
June 25, Nifty 50 intraday trade plan for tomorrow✅ Bullish Zones (Call Buyer Favorable):
🔺 Above 25,518
→ Closing short-covering level
Strong breakout / upside momentum
🟧 Above 25,318
→ 10M hold CE by entry level
Safe CE entry zone
🟪 Above 25,183
→ Positive trade view zone
⚫ Above 24,982
→ Opening S1 CE hold level
🟩 Above 24,622
→ Safe zone for CE buying
❌ Bearish Zones (Put Buyer Favorable):
🔻 Below 25,518
→ Safe zone for PE buyers
🟧 Below 25,318
→ Risk zone for PE buyers
🟪 Below 25,183
→ Negative trade view zone
⚫ Below 24,982
→ Opening R1 PE hold level
🟧 Below 24,780
→ 10M PE hold level
🟦 Below 24,622
→ Unwinding zone – Weak market signal
📊 Tomorrow’s Trading Strategy
Opening Above 25,183
Look for CE Buying Opportunities.
Target 25,318 → 25,518.
Opening Between 25,071–24,982
Neutral to cautious zone.
Wait for price action confirmation near key levels.
Opening Below 24,780
Look for PE Buying or CE Selling.
Possible test of 24,622 → 24,500 zone.
Trendline Support Near 24,850
If broken, expect downside acceleration.
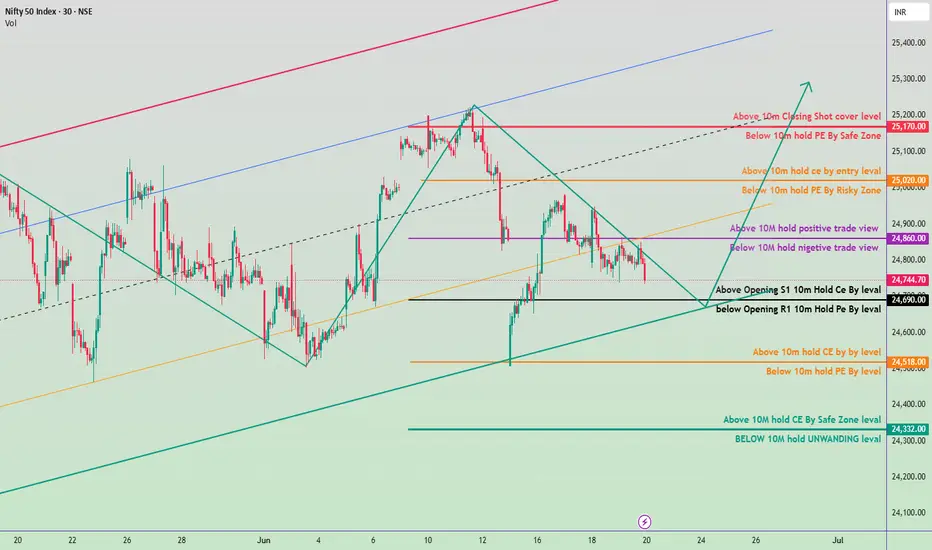
20June Nifty 50 breakdown and brekout levals🟢 Bullish Zones (CE - Call Buyers Support):
Above 25,000 – Entry level for CE
If Nifty sustains above this level, expect aggressive buying.
Target: 25,170 (Safe Zone), then 25,200 (Closing Shot Cover)
24,860 – Positive trade view
Holding above this gives bullish bias; CE can be held with confidence.
Indicates momentum shift toward buyers.
24,744 – Intraday CE Holding Level
Sustaining above this from open = potential move toward 24,860+
24,690 – Opening Support
Above this level for 10 mins = safe for CE traders.
24,518 – Minor CE Holding Zone
CE can be re-entered with small SL.
24,332 – Strong CE Safe Zone
Major support for positional bulls.
🔴 Bearish Zones (PE - Put Buyers Support):
Below 25,000 – Risky Zone for PE
PE entry starts once price fails to sustain above 25k.
Below 24,860 – Negative view
Falling below this adds bearish pressure.
Below 24,690 – Weakness
PE holding possible if sustained below 10 mins.
Below 24,518 – Confirmed PE zone
Can see acceleration downwards.
Below 24,332 – Strong PE momentum
Major breakdown area.
Below 10m Candle UNWINDING Zone – Around 24,200
Heavy PE buyers may dominate below this.
✅ Summary Trade Plan:
Bullish Above: 24,518 →24,720 → 24,860 → 25,000 → 25,170+
Bearish Below: 25,000 →24,860 →24,690 → 24,518 → 24,332
Banknifty levels for swing tradingAccording to a recent analysis, the important levels are:
Trend‑deciding pivot: 56,713
Primary resistance zones: 56,948, 57,184, 57,420, 57,666
Support zones: 56,578, 56,241, 55,706, 55,534
A dip toward 56,578–56,713 is a potential long entry, targeting 56,948 and beyond.
A break below 56,241 opens doors to deeper support around 55,700–55,500.

May 27, 2025 Nifty 50 tomorrow prediction Bullish Trade Setup
Entry: Above ₹25,080
Targets:
🎯 Target 1: ₹25,218
🎯 Target 2: ₹25,338
Stop Loss: ₹25060
Reason to Buy:
Above key resistance
Positive trend continuation
Potential short-covering rally
Bearish Trade Setup
Entry: Below ₹24,910
Targets:
🎯 Target 1: ₹24,783
🎯 Target 2: ₹24,610
🎯 Target 3: ₹24,534
Stop Loss: ₹24939
Reason to Sell:
Breakdown from support zone
Risk-off for PE writers
Momentum shift to downside
Pro Tips
Wait for 15-minute candle close above/below trigger levels.
Avoid trading in tight range between ₹24,910–₹25,080 (no clear trend).
Use small position size near expiry or event days.
Track open interest and FIIs/DII data for confirmation.

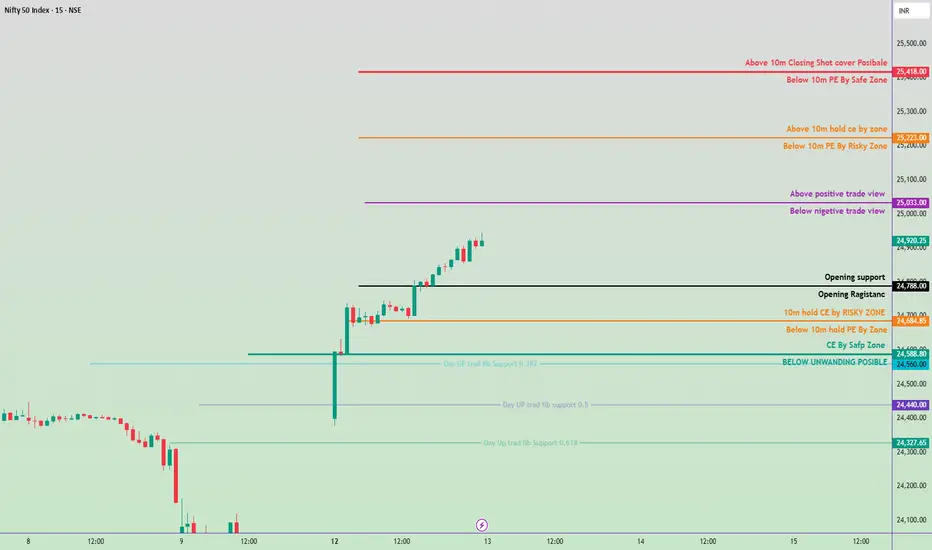
13th May 2025 Nifty 50 Prediction & Trading Zone#Nifty50 #option trading
🚀 If you like my trading plan and levels, don't forget to boost the post
99% working trading plan ( Opning Possibility gap Up)
👉Gap up open 25033 above & 15m hold after positive trade target 25223, 25420
👉Gap up open 25033 below 15m not break upside after nigetive trade target 24788, 24684
👉Gap down open 24788 above 15m hold after positive trade target 25033 ,25223, 25420
👉Gap down open 24788 below 15m not break upside after nigetive trade target 24684, 24588
📌 Trade plan for education purpose I'm not responsible your trade
More education follow social media and boost my idea
📌 koi bhi trade leval se 20 point ke sl ke bhina karan nahi hi
📌 koi trade app activate tabhi karana hota hi level pe 2 candle uper ya niche closing aati hai to
📌 leval par Ane pe turant trade plan na kare ...
📌 Full risk apaki hi hi meri n
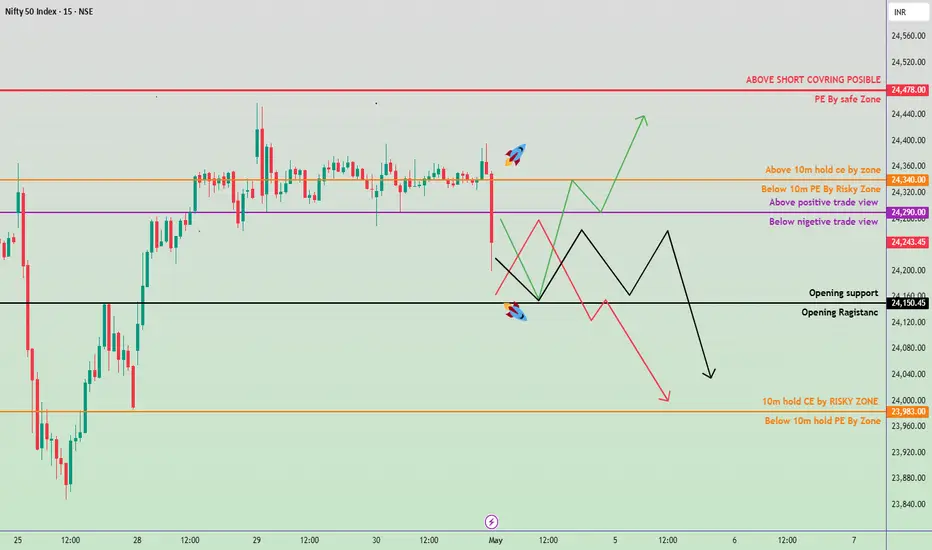
2nd May nifty50 Trading Zone #Nifty50 #option trading
🚀 If you like my trading plan and levels, don't forget to boost the post
99% working trading plan
👉Gap up open 24290 above & 15m hold after positive trade target 24340, 24470+
👉Gap up open 24290 below 15 m not break upside after nigetive trade target 24160, 23990
👉Gap down open 24150 above 15m hold after positive trade target 24340, 24470+
👉Gap down open 24150 below 15 m not break upside after nigetive trade target 23990, 23730,
💫big gapdown open 23987 above 1st positive trade view
💫big Gapup opening 24348 below 1st nigetive trade view
📌 Trade plan for education purpose I'm not responsible your trade
More education follow social media and boost my idea
📌 koi bhi trade leval se 20 point ke sl ke bhina karan nahi hi
📌 koi trade app activate tabhi karana hota hi level pe 2 candle uper ya niche closing aati hai to
📌 leval par Ane pe turant trade plan na kare ...
📌 Full risk apaki hi hi meri nah
30 April Nifty Trade Zone#Nifty50 #option trading
99% working trading plan
👉Gap up open 24470 above & 15m hold after positive trade target 24570,
👉Gap up open 24470 below 15 m not break upside after nigetive trade target 24270 , 24160
👉Gap down open 24270 above 15m hold after positive trade target 24470 , 24570
👉Gap down open 24270 below 15 m not break upside after nigetive trade target 24160, 23873,
💫big gapdown open 24160 above 1st positive trade view
💫big Gapup opening 24570 below 1st nigetive trade view
📌 Trade plan for education purpose I'm not responsible your trade
More education follow social media and boost my idea
📌 koi bhi trade leval se 20 point ke sl ke bhina karan nahi hi
📌 koi trade app activate tabhi karana hota hi level pe 2 candle uper ya niche closing aati hai to
📌 leval par Ane pe turant trade plan na kare ...
📌 Full risk apaki hi hi meri nah

29 April Nifty50 trading Zone#Nifty50 #option trading
99% working trading plan
👉Gap up open 24388 above & 15m hold after positive trade target 24563,
👉Gap up open 24388 below 15 m not break upside after nigetive trade target 24217, 24033
👉Gap down open 24217 above 15m hold after positive trade target 24388 , 24563
👉Gap down open 24217 below 15 m not break upside after nigetive trade target 24033, 23738,
💫big gapdown open 24033 above 1st positive trade view
💫big Gapup opening 24563 below 1st nigetive trade view
📌 Trade plan for education purpose I'm not responsible your trade
More education follow social media and boost my idea
📌 koi bhi trade leval se 20 point ke sl ke bhina karan nahi hi
📌 koi trade app activate tabhi karana hota hi level pe 2 candle uper ya niche closing aati hai to
📌 leval par Ane pe turant trade plan na kare ...
📌 Full risk apaki hi hi meri nah

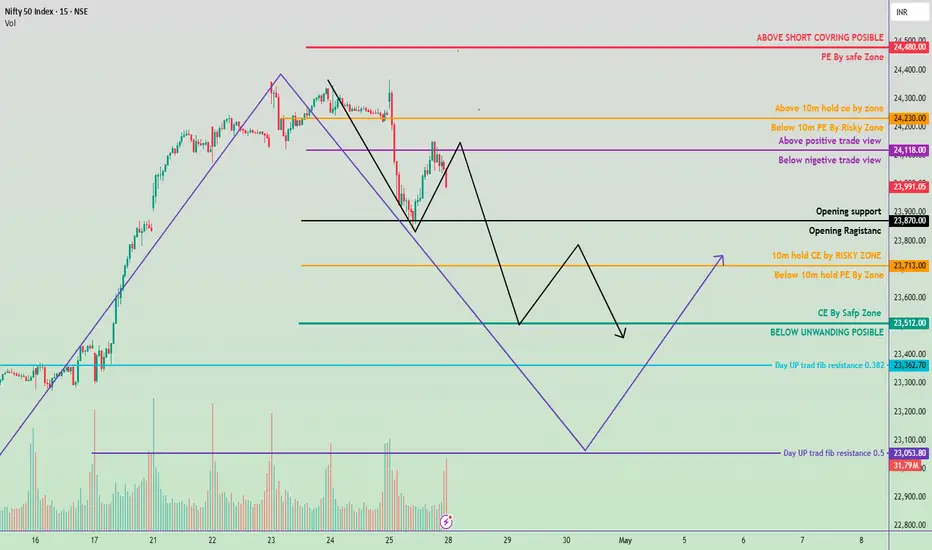
28 april nifty trading zone#Nifty50 #option trading
99% working trading plan
👉Gap up open 24118 above & 15m hold after positive trade target 24230,
👉Gap up open 24118 below 15 m not break upside after nigetive trade target 23870, 23713, 23512
👉Gap down open 24112 above 15m hold after positive trade target 24118 , 24230
👉Gap down open 24112 below 15 m not break upside after nigetive trade target 23870, 23713, 23512
💫big gapdown open 23713 above 1st positive trade view
💫big Gapup opening 24230 below 1st nigetive trade view
📌 Trade plan for education purpose I'm not responsible your trade
More education follow social media and boost my idea
📌 koi bhi trade leval se 20 point ke sl ke bhina karan nahi hi
📌 koi trade app activate tabhi karana hota hi level pe 2 candle uper ya niche closing aati hai to
📌 leval par Ane pe turant trade plan na kare ...
📌 Full risk apaki hi hi meri nah
23 April nifty50 trade zone #Nifty50 #option trading
99% working trading plan
👉Gap up open 24170 above & 15m hold after positive trade target 24220,
👉Gap up open 24170 below 15 m not break upside after nigetive trade target 24112, 24030, 23970
👉Gap down open 24112 above 15m hold after positive trade target 24170, 24220
👉Gap down open 24112 below 15 m not break upside after nigetive trade target 24030, 24970
💫big gapdown open 24036 above 1st positive trade view
💫big Gapup opening 24220 below 1st nigetive trade view
📌 Trade plan for education purpose I'm not responsible your trade
More education follow & support me
📌 koi bhi trade leval se 20 point ke sl ke bhina karan nahi hi
📌 koi trade app activate tabhi karana hota hi level pe 2 candle uper ya niche closing aati hai to
📌 leval par Ane pe turant trade plan na kare ...
📌 Full risk apaki hi hi meri nah

Database TradingTrading data is a sub-category of financial market data. It provides real-time information about stock and market prices as well as historical trends for assets such as equities, fixed-income products, currencies and derivatives.
In our analysis, we found Webull and Fidelity to be the best trading platforms for beginners, and Interactive Brokers and tastytrade to be the best options for advanced or active traders.

Data TradingMarket data is a broad category of information about the financial markets, consisting of essential details like price, bid/ask quotes, trading volume, trading period (high, low, open, or closed), etc.
Options trading is a type of financial trading that allows investors to buy or sell the right to purchase or sell an underlying asset at a fixed price, at a future date. Options trading operates on the basis that the buyer has the option to exercise the contract but is not under any obligation to do so.

PCR / Put Call RatioA PCR greater than 1 indicates that more put options are being traded than call options, suggesting a bearish market sentiment. Investors may expect a market decline or hedge against potential losses.
PCR ratio = 1500/2000. = 0.75. Points to be noted: A PCR value below 1 is indicative of the fact that more Call options are being purchased relative to the Put options which signals that investors are anticipating a bullish outlook for the markets ahead.
Contrarian indicator: Can signal potential market reversals with extreme values of the put/call ratio. An example of this is a put/call ratio of 2.5. This can suggest a very bearish sentiment while a put/call ratio such as 0.25, could indicate an extreme bullish sentiment.

Roadmap for a TraderA trading roadmap is essentially a strategic plan that guides your trading decisions. It encompasses your goals, risk management strategies, analysis methods, and decision-making processes. Think of it as a personalized guide that helps you make informed choices in the dynamic world of trading.
By recognising specific patterns like the Cup and Handle or Double Bottom, traders can identify moments when the market is likely to make a significant move. These patterns signal potential price swings, providing traders with a roadmap for entering positions at the optimal time.

Learn option in trading If you buy an options contract, it grants you the right but not the obligation to buy or sell an underlying asset at a set price on or before a certain date. A call option gives the holder the right to buy a stock, and a put option gives the holder the right to sell a stock.
Now, the burning question on everyone's mind – how long does it take to learn options trading? Well, it really depends on how much time and effort you're willing to put in. Some people might be able to pick it up in a few weeks, while others might take months or even years to fully grasp the concepts.
