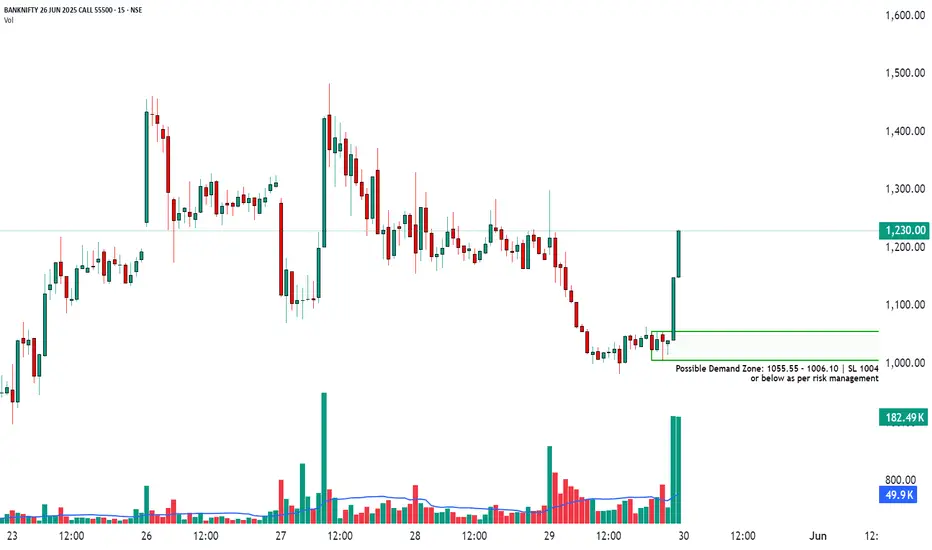
How to Trade Bank Nifty Options Using Demand Zones📈 BANKNIFTY 55500ce
📆 Date: May 29, 2025
🔍 Timeframe: 15 minute
How to Trade Bank Nifty Options Using Demand Zones
Understanding and effectively applying demand zones can significantly improve your success in trading Bank Nifty options. This approach provides a structured method to identify high-probability trades and implement disciplined risk management.
________________________________________
Why Use Demand Zones in Options Trading?
• Enables entry closer to strong support, improving reward-to-risk ratios
• Acts as a key confluence area for price action and volume
• Encourages disciplined entries based on market structure
• Helps set clear, logical stop-loss levels
________________________________________
Strategy: Two Ways to Trade Demand Zones
1. Conservative Approach – Wait for Price to Enter the Zone
Steps:
• Allow price to dip into the defined demand zone (between 1055.55 – 1006.10)
• Wait for reversal confirmation, such as:
• Bullish engulfing or a strong green candle
• Increased volume or optional bullish divergence
• Enter a Call Option (CE) position once confirmation is visible
• Place stop-loss just below the zone (e.g., ₹1004)
• Target 1: Immediate resistance or recent swing high
• Target 2: Option premium expansion based on implied volatility and price momentum
Why this works: Buying at a value zone aligns you with potential institutional demand and provides a favorable entry with limited downside.
________________________________________
2. Aggressive Approach – Trade From the Top of the Zone
Steps:
• Enter when the price first touches the top of the demand zone (around 1055.55)
• Use a tight stop-loss just below the zone (e.g., 1004)
• Consider smaller position sizing to adjust for higher entry risk
• Monitor for immediate bounce—exit quickly if no reaction follows
Why this works: Offers better reward if the demand zone holds and price reacts quickly. This is suitable for experienced traders who can act decisively.
________________________________________
Risk Management – Non-Negotiable
• Always follow stop-loss discipline based on the demand zone
• Keep position sizing conservative, risking only 1%–2% of your total capital
• Avoid overtrading; focus on high-quality, high-probability setups
• Select ATM or slightly OTM options (e.g., 55500 CE or 55600 CE) for better delta and responsiveness
________________________________________
Volume Confirmation – An Extra Edge
• Volume spikes near the demand zone strengthen the validity of the level
• If volume is absent, avoid the trade or reduce your size
• Institutional buying often reveals itself through volume near key support levels
________________________________________
Trade Entry Checklist
• Is price currently in or very near the marked demand zone?
• Is volume showing increased activity?
• Is the overall market trend favorable for calls?
• Are external/global market cues supportive (especially for intraday trades)?
• Is the risk-to-reward ratio at least 1:2?
________________________________________
Educational Recap
• Demand zones act as critical areas where strong buying interest may emerge
• Wait for price to enter the zone; avoid chasing entries
• Focus on structured risk control over trying to predict every move
• Use candlestick structure, volume analysis, and context to improve your setup quality
________________________________________
Final Thoughts
Trading Bank Nifty options with demand zones instills structure, clarity, and discipline. This approach is ideal for intraday or short-term swing traders who rely on technical precision.
The objective is not to trade frequently, but to trade at the right levels with defined risk and potential reward. Let the market come to your setup and respond with a plan—never react emotionally.
This framework reduces noise, avoids emotional trades, and helps you align with institutional buying zones with a strong edge.
⚠️ Risk Management Tip: Always trade with a clearly defined stop loss. Avoid entering positions impulsively. It is advisable to start with a smaller quantity and increase your exposure only if the price action confirms the continuation of the trend. Capital protection should always be the priority.
📢 Disclaimer
This content is created purely for educational and informational purposes. It is not intended as investment advice, stock recommendations, or trading tips. Trading and investing in the stock market involves risk. Please consult with a SEBI-registered financial advisor before making any investment decisions. The author/creator is not registered with SEBI and shall not be held responsible for any losses incurred based on this information. Always do your own research and use proper risk management.
👉 If you found this analysis helpful, don’t forget to Follow, so you never miss out on a trade-worthy setup, breakout opportunity, or valuable educational insight again. Stay updated and trade smarter! 💡📈
Optionanalysis
Bank Nifty Market Analysis for Tomorrow**Bank Nifty Market Analysis for Tomorrow, 29th September 2023**
**interesting headline:**
**Bank Nifty: Bulls and Bears Fight for Control, Watch These Levels Tomorrow**
**Analysis:**
Bank Nifty took support at 44209 today and gave an upside move. This suggests that the bulls are still in control, but the bears are putting up a strong fight.
For tomorrow, the following support and resistance levels are important to watch:
**Support:**
* 44200
* 44000
* 43800
**Resistance:**
* 44465
* 44800
**If the market opens gapdown below 44200, then 44200 will be the first resistance.** If the market rejects from here, then it can go down to 44000, which is a big support and round-number level. If the market breaks below 44000, then it can go down to 43800.
**If the market opens gapup tomorrow, then 44200/44000/43800 will be good support levels.**
**On the upper side, 44465 is a good resistance level for the market now.** If the market breaks 44465 and sustains above it, then a buying side entry may be possible up to 44800. 44800 is also a resistance level for tomorrow.
**Overall, the market is in a volatile phase, and both the bulls and bears are fighting for control.** It is important to trade with caution and to keep a close eye on the support and resistance levels.
**Additional tips:**
* If you are a short-term trader, then you can look to trade the range between 44200 and 44465.
* If you are a medium-term trader, then you can look to buy if the market breaks above 44465 and sustains above it.
* If you are a long-term trader, then you can look to buy on dips, with a stop loss below 43800.
**Please note that this is just a market analysis, and it is not a trading recommendation. Please do your own research and consult with a financial advisor before making any trading decisions.**

BANKNIFTY LIVE LEVELS FOR 06-04-2023BankNifty looks bullish No Change in RBI reporate... But due to Upside momentum in Last few Trading Session ...I am Expecting some profit Booking Here....
Important Strike price to watch 41100 PE and 41200 CE...
:)
****Educational****


Nifty outlook for tomorrowNSE:NIFTY
On Consecutively second day nifty formed an inverted hammer pattern which is bearish reversal sign.
Option chain data suggests small short covering at 11500 CE plus heavy PUT writing is seen at 11500 PE which indicates it is difficult to break 11500.
One can go long in Nifty with 11500/11490 as SL.

Will JSWSTEEL break its ALL TIME HIGH & continue its uptrend1) Testing its ATH (All Time High) level.
2) Perfect 'v' formation @ important level
(which is very very bullish indication)
3) 78.6% fibonacci extension level on WEEKLY timeframe
coincides with ATH. As we know, breakout of 76.8% lvl of
fib extension considered as continuation of the mail trend.
4) Concern : forming DOJI from last two days.
5) Relief : Even after forming 2 DOJI, momentum
of the stock is intact. If it passes this level, it has
ability to hold this level, take a breather & move
ahead.
6) OI Analysis : People still holding their LONG
positions from the recent rally.
7) Options Analysis (for Friday): 81k contracts added
@ 340PE & 27k contracts removed @ 350CE (implies
bullishness).
PCR OI is slightly less 1 (implies indecisiveness)
PCR Volume is 0.717 (implies bearishness)
Being FRIDAY tomorrow, I dont expect much to happen
will definately keep an eagle eye on this stock for my
portfolio.

Will YESBANK give a oh-YES moment!! After breaching 383 & 390 levels, stock will resume its
UPTREND in medium term trend.
For now,
1) Formed an EXHAUSTIVE candle on friday. (Neutral)
2) On Intraday chart, stock had a very good opening move, but after SBIN results, (being its peer) it also faced a selling pressure. Due to which short covering was seen, but before this event, stock was enjoying LONG BUILDUP
2) OI Analysis:
Traded with highest number of contracts in this series.
If on Monday, spot price is sustaining near 380-383 levels and OI is increasing then GO LONG for 3-4 % gains in 1-2 days.
3) Option Analysis suggests, 82k positions were cleared from 390CE, 194k positions were added @ 400CE & 218k positions added @ 380PE, which means, 380 will act as STRONG SUPPORT where as 400 will act as STRONG RESISTANCE.
Remember, run from 385 to 400 will give you 5% gains.

Will it go for new Higher High?Verdict:
Bounced back from fib retracement level
& formed bullish divergence. But note,
unable to cross 1425 level
OI Analysis:
New longs are added today.
If moves up tomorrow then
it will be fueled by strong short covering
Options Analysis:
Huge addition of OI @ 1440CE. This is only
thing which is indicating bearishness, all
other indicates towards bullish behavior.
If I were to guess then my guess will be
fall a bit in first half and then recover
to head up north.
