“Nifty 50 Intraday Key Levels | Buy & Sell Zones” 6th Oct 2025Key Levels for Tomorrow:
25,120 → Above 10m closing Short Cover Level (CE Safe Zone)
Below 10m hold PE (Risky Zone)
25,023 → Above 10m hold CE (Entry Level)
Below 10m hold PE (Risky Zone)
24930 → Above 10m hold → Positive Trade View
Below 10m hold → Negative Trade View
24,820 → Above Opening S1 hold CE (Buy Level)
Below Opening R1 hold PE (Sell Level)
24,690 → Above 10m hold CE (Buy Level)
Below 10m hold PE (Sell Level)
24,590 → Above 10m hold CE (Safe Zone)
Below 10m hold UNWINDING Level
Optionchain

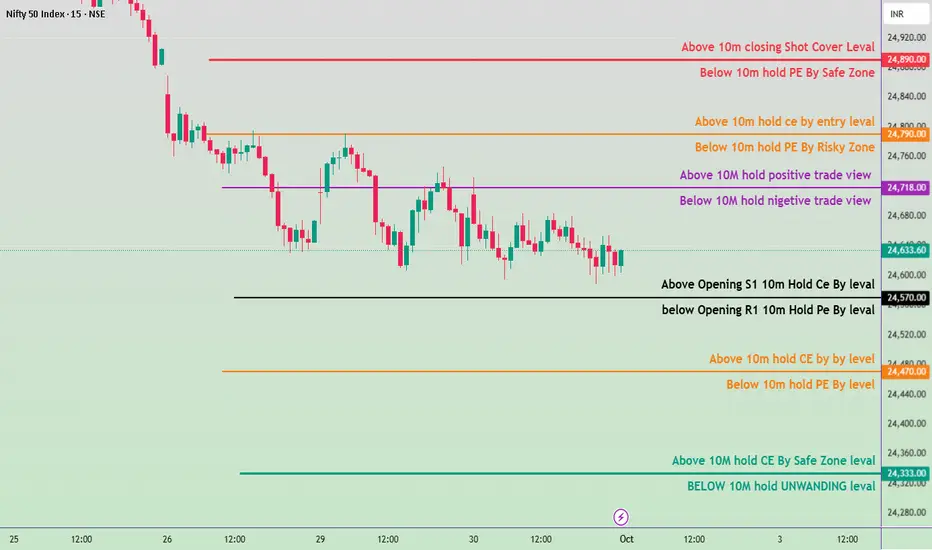
“Nifty 50 Key Levels & Trade Zones 1st Oct 2025”
“Follow me and like this post for more learning tips!”
24890 → Above 10m closing → Short Cover Level (CE Safe Zone)
24790 → Above 10m hold CE (Entry Level)
Below 10m hold PE (Risky Zone)
24718 → Above 10m hold → Positive Trade View
Below 10m hold → Negative Trade View
24570 → Above Opening S1 hold CE (Buy Level)
Below Opening R1 hold PE (Sell Level)
24470 → Above 10m hold CE (Buy Level)
Below 10m hold PE (Sell Level)
24333 → Above 10m hold CE (Safe Zone)
Below 10m hold UNWINDING Level
“Nifty 50 Key Levels & Trade Zones – 30th Sept 2025”
“Follow me and like this post for more learning tips!”
Key Levels from the Chart
24,890 – Above 10M Closing Shot Cover Level
24,820 –Above 10M Hold CE by Entry Level
Below 10M Hold PE by Risky Zone
24,722 –Above 10M Hold Positive Trade View
Below 10M Hold Negative Trade View
24,590 –Above Opening S1 10M Hold CE by Level
Below Opening R1 10M Hold PE by Level
24,470 –Above 10M Hold CE by Level
Below 10M Hold PE by Level
24,370 –Above 10M Hold CE by Safe Zone Level
Below 10M Hold Unwinding Level

“Nifty 50 Key Levels & Trade Zones – 29th Sept 2025”“Follow me and like this post for more learning tips!”
24,870 → Above 10m closing Shot Cover Level
24,870 → Below 10m hold PE By Safe Zone
24,778 → Above 10m hold CE By Entry Level
24,770 → Below 10m hold PE By Risky Zone
24,718 → Above 10m hold Positive Trade View
24,718 → Below 10m hold Negative Trade View
24,620 → Above Opening S1 10m hold CE By Level
24,620 → Below Opening R1 10m hold PE By Level
24,520 → Above 10m hold CE By Level
24,520 → Below 10m hold PE By Level
24,418 → Above 10m hold CE By Safe Zone Level
24,418 → Below 10m hold Unwinding Level

Option Chain AnalysisChapter 1: Basics Refresher
1.1 What is an Option Chain?
An option chain (or option matrix) is a tabular display of all option contracts for a particular stock or index. It is split into two halves:
Left side → Call Options (CE)
Right side → Put Options (PE)
Middle → Strike Prices
For each strike, the chain shows data such as Open Interest (OI), Volume, Last Traded Price (LTP), Bid/Ask, Change in OI, and Implied Volatility (IV).
1.2 Why Do We Analyze It?
Option chain analysis provides traders with:
Market sentiment (bullish, bearish, or neutral).
Probable support and resistance levels.
Identification of fresh positions vs unwinding.
Volatility expectations.
Clues for strategy selection (directional or non-directional).
Chapter 2: Core Components in Option Chain Analysis
2.1 Open Interest (OI)
Represents outstanding contracts not yet squared off.
High OI at a strike → strong trader interest.
Change in OI indicates new positions or unwinding.
👉 Key use in analysis:
Highest Put OI → Likely support.
Highest Call OI → Likely resistance.
2.2 Volume
Shows contracts traded during the current session.
High Volume + Rising OI → New positions building up.
High Volume + Falling OI → Unwinding/covering.
2.3 Implied Volatility (IV)
Reflects expected volatility of the underlying.
High IV → Options expensive; suitable for option writing.
Low IV → Options cheaper; suitable for buying strategies.
2.4 Price (Premium) Movement
If premiums rise with OI → trend continuation.
If premiums fall with OI → trend weakening.
2.5 Put Call Ratio (PCR)
Formula: Total Put OI ÷ Total Call OI.
PCR > 1 → More puts → bullish bias.
PCR < 1 → More calls → bearish bias.
Chapter 3: Interpreting Option Chain Data
3.1 Support & Resistance Identification
Support: Strikes with highest Put OI (buyers willing to defend).
Resistance: Strikes with highest Call OI (sellers capping upside).
Example:
If NIFTY is at 20,000:
19,800 Put has highest OI → Support.
20,200 Call has highest OI → Resistance.
3.2 OI and Price Analysis
Price ↑ + OI ↑ → Long Build-up.
Price ↓ + OI ↑ → Short Build-up.
Price ↑ + OI ↓ → Short Covering.
Price ↓ + OI ↓ → Long Unwinding.
This is one of the most powerful interpretations for intraday and positional trading.
3.3 IV Analysis
Rising IV + Rising Premiums → Traders expect big moves.
Falling IV + Rising Premiums → Unusual demand-driven move.
Chapter 4: Techniques of Option Chain Analysis
4.1 Strike-Wise Analysis
Look at individual strikes for OI and volume changes.
Identify where traders are adding fresh bets.
4.2 ATM (At-the-Money) Analysis
ATM strikes reflect the most balanced and sensitive positions.
Changes in ATM OI provide clear sentiment direction.
4.3 OTM (Out-of-the-Money) Analysis
Helps identify speculation and event-based positioning.
Example: Traders buying far OTM Calls before results → Bullish bets.
4.4 PCR Interpretation
Overall PCR for market view.
Strike-wise PCR for specific zones.
Chapter 5: Option Chain Analysis for Strategies
5.1 Directional Strategies
Bullish sentiment → Buy Calls, Sell Puts, Bull Call Spread.
Bearish sentiment → Buy Puts, Sell Calls, Bear Put Spread.
5.2 Neutral / Range-Bound Strategies
If highest Put OI and Call OI are close → sideways view.
Strategies: Iron Condor, Short Straddle, Short Strangle.
5.3 Volatility-Based Strategies
High IV → Option writing (Iron Fly, Short Straddle).
Low IV → Option buying (Long Straddle, Long Strangle).
Chapter 6: Practical Example (NSE NIFTY)
Imagine NIFTY trading at 20,000.
Highest Put OI at 19,800 → Support.
Highest Call OI at 20,200 → Resistance.
PCR = 1.3 → Slightly bullish.
Interpretation:
NIFTY likely to trade between 19,800–20,200 for now.
Strategy: Iron Condor within the range.
Chapter 7: Institutional vs Retail Approach
Retail traders: Focus on LTP, volume, ATM strikes.
Institutions: Focus on OI buildup, hedging positions, volatility skew.
Market makers: Use Greeks + IV to balance exposures.
Chapter 8: Advanced Insights
8.1 Option Chain + Technical Analysis
Combining chart support/resistance with OI data makes levels stronger.
8.2 Option Chain Before Events
Earnings, Fed meetings, budget → OI shifts + IV spikes.
Typically, IV crashes after event (“IV crush”).
8.3 Skew Analysis
Sometimes far OTM puts have higher IV than calls → sign of bearish protection demand.
Chapter 9: Mistakes Traders Make
Blindly following “highest OI” without context.
Ignoring IV while analyzing premiums.
Trading illiquid strikes (low OI/volume).
Misinterpreting PCR extremes (can signal contrarian trades).
Over-relying on option chain without considering news/technical charts.
Chapter 10: Step-by-Step Guide for Beginners
Open NSE Option Chain for the underlying.
Note the spot price.
Identify ATM strike.
Look at highest Put OI (support).
Look at highest Call OI (resistance).
Check PCR for sentiment.
Track OI + Price changes intraday for direction.
Select a strategy (buy/sell options, spreads, or non-directional).
Chapter 11: Benefits of Option Chain Analysis
Provides real-time market sentiment.
Identifies key support/resistance zones.
Helps in strategy selection.
Useful for hedging positions.
Assists in intraday, swing, and positional trading.
Chapter 12: Limitations
Works best in liquid instruments (NIFTY, BANKNIFTY).
Can give false signals during low volume sessions.
Sudden news/events can override OI patterns.
Requires constant monitoring (dynamic data).
Conclusion
Option Chain Analysis is a trader’s X-ray machine—it reveals what the surface charts don’t show. By analyzing open interest, volume, IV, and PCR, traders can spot where the market is placing its bets. This helps identify support/resistance levels, predict short-term trends, and craft strategies suited for directional, range-bound, or volatile markets.
For beginners, the option chain may initially look complex. But with practice, patterns emerge, and it becomes one of the most reliable tools for decision-making. For professionals, it’s an indispensable part of daily trading.
In the end, option chain analysis is not just about numbers—it’s about reading the collective psychology of market participants and positioning oneself accordingly.

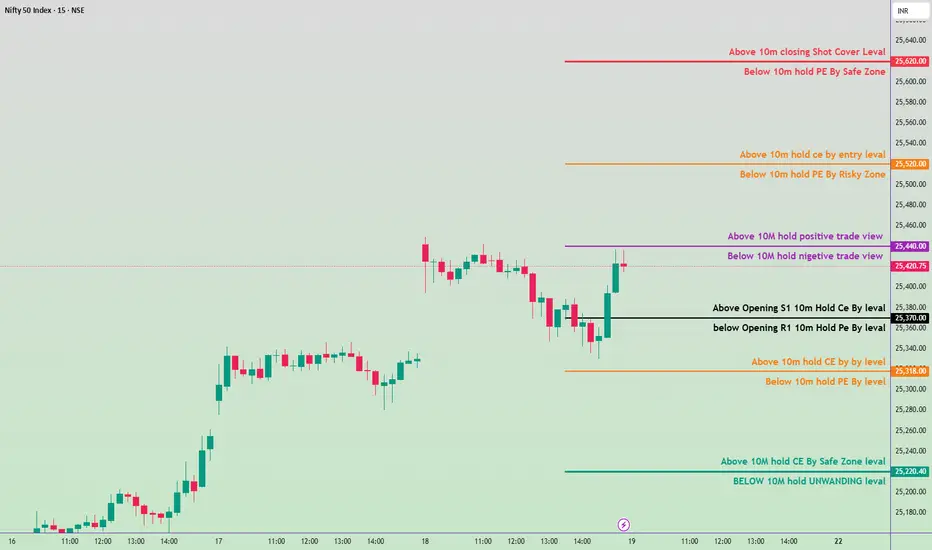
19Sep 2025 Nifty50 trading levelKey Levels
25,623 → Above 10m closing Short Cover Level
25,612 → Below 10m hold PE by Safe Zone
25,530 → Above 10m hold CE by Entry Level
25,520 → Below 10m hold PE by Risky Zone
25,440 → Above 10m hold Positive Trade View
25,430 → Below 10m hold Negative Trade View
25,370 → Below Opening R1 10m Hold PE By Level
25,380 → Above Opening S1 10m Hold CE By Level
25,323 → Above 10m Hold CE By Level
25,316 →Below 10m Hold PE By Level
25,223 → Above 10m hold CE by Safe Zone Level
25,216→ Below 10m hold Unwinding Level
Nifty 50 Index trading levels Key Levels
25,130 → Above 10m closing Shot Cover Level
Below 10m Hold PE by Safe Zone
24,970 → Above 10m Hold CE by Entry Level
Below 10m Hold PE by Risky Zone
24,821 → Above 10m Hold Positive Trade View
Below 10m Hold Negative Trade View
24,678 → Above Opening S1 10m Hold CE by Level
Below Opening R1 10m Hold PE by Level
24,570 → Above 10m Hold CE by By Level
Below 10m Hold PE by Level
24,380 → Above 10m Hold CE by Safe Zone Level
Below 10m Hold UNWINDING Level

Options OI Trade Outlook — Bullish Setups Only________________________________________
📊 Options OI Trade Outlook — Bullish Setups Only
“This analysis is shared purely for educational purposes and market awareness — not a trading recommendation.”
(Educational Purpose | Not Financial Advice | SEBI Compliant)
Hello Traders 👋,
Here are today’s 7 Bullish Option Setups based on OI + Price Action + IV + Greeks study.
This is strictly for learning and educational purposes only.
________________________________________
🟢 1. ITC 410 CALL
LTP: 7.25
Sentiment: Bullish | Trend: Up | Strength: 5/5 (Strong)
IV: 13.3 | Delta: 0.55 | Theta: -0.20 | Vega: 0.46
Buildup: Long Build-up
Why?
410 CE shows a strong Long Build-up with price ↑ 70.6% and OI ↑ 31.2%.
Volume jumped +305.9%, confirming active participation.
Low IV makes premiums attractive. Delta 0.55 indicates higher ITM probability.
________________________________________
🟢 2. CGPOWER 700 CALL
LTP: 23.5
Sentiment: Bullish | Trend: Up | Strength: 5/5 (Strong)
IV: 30.9 | Delta: 0.52 | Theta: -0.65 | Vega: 0.79
Buildup: Long Build-up
Why?
700 CE surged +127% in price with OI ↑ 216.5% — strong long confirmation.
Volume spiked +2962%, showing aggressive buying.
IV rising (+10.3%) supports premium expansion.
________________________________________
🟢 3. COLPAL 2340 CALL
LTP: 61.7
Sentiment: Bullish | Trend: Up | Strength: 5/5 (Strong)
IV: 22.4 | Delta: 0.53 | Theta: -1.52 | Vega: 2.64
Buildup: Long Build-up
Why?
2340 CE gained +89.8% in price with OI ↑ 146.9%.
Volume surged +2357%, indicating strong trader interest.
Moderate IV gives a balanced risk-reward setup.
________________________________________
🟢 4. LT 3600 CALL
LTP: 76.25
Sentiment: Bullish | Trend: Up | Strength: 5/5 (Strong)
IV: 15.9 | Delta: 0.55 | Theta: -2.34 | Vega: 4.06
Buildup: Long Build-up
Why?
3600 CE rose +29.2% with OI ↑ 3.6%.
Volume ↑ 71%, confirming active participation.
Delta 0.55 signals higher ITM chances with bullish momentum.
________________________________________
🟢 5. BRITANNIA 5800 CALL
LTP: 172
Sentiment: Bullish | Trend: Up | Strength: 5/5 (Strong)
IV: 21.6 | Delta: 0.57 | Theta: -3.46 | Vega: 6.52
Buildup: Long Build-up
Why?
5800 CE rallied +49.6% with OI ↑ 16.5%.
Volume jumped +566%, confirming buying momentum.
IV rising (+9.4%) shows strong premium expansion potential.
________________________________________
🟢 6. ASIANPAINT 2500 CALL
LTP: 77
Sentiment: Bullish | Trend: Up | Strength: 3.9/5 (Strong)
IV: 20.8 | Delta: 0.59 | Theta: -1.40 | Vega: 2.79
Buildup: Short Covering
Why?
2500 CE benefited from short covering — price ↑ 21% while OI ↓ 21.6%.
This indicates shorts exiting, fueling bullish momentum.
Volume dipped (-15.9%), so position sizing should be careful.
________________________________________
🟢 7. DMART 4800 CALL
LTP: 101
Sentiment: Bullish | Trend: Up | Strength: 5/5 (Strong)
IV: 20.2 | Delta: 0.50 | Theta: -3.53 | Vega: 5.40
Buildup: Long Build-up
Why?
4800 CE rose +12.1% with OI ↑ 17.5% — strong long confirmation.
Volume ↑ 159.9% adds conviction.
IV easing (-6.1%) ensures better fills with controlled risk.
________________________________________
⚠️ Disclaimer – Please Read Carefully
The information shared here is meant purely for learning and awareness.
It is not a buy or sell recommendation and should not be taken as investment advice.
📌 I am not a SEBI-registered investment advisor.
📌 All views expressed are based on personal study, chart patterns, and publicly available data.
📌 Trading in stocks or options carries risk. Markets can move unexpectedly. Losses can exceed capital.
📌 Past setups do not guarantee future outcomes.
👉 Beginners: Use this for study & paper trading only.
👉 Experienced traders: Apply your own risk management & strategy filters.
👉 Always consult a SEBI-registered financial advisor before real trades.
________________________________________
💬 Found this useful?
🔼 Boost this post to help more traders learn.
✍️ Share your thoughts/setups in comments — let’s grow together.
🔁 Share with fellow traders & learners.
👉 Follow for more clean, structured breakdowns with discipline at the core.
🚀 Stay Calm. Stay Clean. Trade With Patience.
Trade Smart | Learn Zones | Be Self-Reliant 📊
________________________________________

Options Watchlist — An Educational View of OI & Price Action________________________________________
📊 Options OI Trade Outlook — Bearish Setups Only
“This analysis is shared purely for educational purposes and market awareness — not a trading recommendation.”
(Educational Purpose | Not Financial Advice | SEBI Compliant)
Hello Traders 👋,
Here are 4 Bearish option setups based on today’s OI + Price Action + IV + Greeks study.
This is strictly for learning and educational purposes.
________________________________________
🔴 1. TCS 3200 PUT
LTP: 118.15
Sentiment: Bearish | Trend: Down | Strength: 5/5 (Strong)
IV: 17.7 | Delta: -0.63 | Theta: -0.93 | Vega: 3.5
Buildup: Long Build-up
Why?
3200 PE shows a Long Build-up with price up 40.4% and OI up 33.6%, confirming strong bearish positioning.
Volume surged +65%, showing active participation. IV eased (-5.4%), keeping premiums cheaper. Delta -0.63 signals high sensitivity to downside moves.
________________________________________
🔴 2. SBIN 820 PUT
LTP: 21.65
Sentiment: Bearish | Trend: Down | Strength: 5/5 (Strong)
IV: 14.8 | Delta: -0.56 | Theta: -0.31 | Vega: 0.95
Buildup: Long Build-up
Why?
820 PE reflects a Long Build-up with price rising 20.6% and OI also increasing — a textbook bearish confirmation.
Low IV (14.8) makes premiums attractive. Delta -0.56 shows quick reactivity to price moves.
________________________________________
🔴 3. INFY 1520 PUT
LTP: 42.80
Sentiment: Bearish | Trend: Down | Strength: 5/5 (Strong)
IV: 20.8 | Delta: -0.51 | Theta: -0.63 | Vega: 1.79
Buildup: Long Build-up
Why?
1520 PE shows heavy Long Build-up, with price up 36.5% and OI exploding 106%.
Volume spiked strongly, reflecting aggressive bearish positioning. IV is moderate (20.8), while Delta -0.51 indicates solid responsiveness to further downside.
________________________________________
🔴 4. LT 3600 PUT
LTP: 81.0
Sentiment: Bearish | Trend: Down | Strength: 2.5/5 (Moderate)
IV: 16.9 | Delta: -0.50 | Theta: -1.58 | Vega: 4.26
Buildup: Short Build-up
Why?
3600 PE shows a Short Build-up, with price falling 10.3% while OI rose 41%, pointing to fresh shorts.
Volume surged +29%, confirming activity. IV is steady at 16.9, and Delta -0.50 indicates balanced downside exposure.
________________________________________
⚠️ Disclaimer – Please Read Carefully
The information shared here is meant purely for learning and awareness.
It is not a buy or sell recommendation and should not be taken as investment advice.
📌 I am not a SEBI-registered investment advisor.
📌 All views expressed are based on personal study, chart patterns, and publicly available data.
📌 Trading — whether in stocks or options — carries risk. Markets can move unexpectedly, and losses can exceed capital.
📌 Past setups do not guarantee future outcomes.
👉 Beginners: use this to learn market behavior, practice with paper trades before risking money.
👉 Experienced traders: apply your own risk management, sizing, and strategy filters.
👉 Always consult a SEBI-registered financial advisor before real trades.
By engaging with this content, you acknowledge full responsibility for your own trading and investments.
________________________________________
💬 Found this useful?
🔼 Boost this post to help more traders learn.
✍️ Share your thoughts/setups in comments — let’s grow together.
🔁 Share with fellow traders & learners.
👉 “Follow for more clean, structured breakdowns with discipline at the core.”
🚀 Stay Calm. Stay Clean. Trade With Patience.
Trade Smart | Learn Zones | Be Self-Reliant 📊
________________________________________
Options Watchlist — An Educational View of OI & Price Action________________________________________
📊 Options OI Trade Outlook — Bullish Setups Only
“This analysis is shared purely for educational purposes and market awareness — not a trading recommendation.”
(Educational Purpose | Not Financial Advice | SEBI Compliant)
Hello Traders 👋,
Here are 5 Bullish option setups based on today’s OI + Price Action + IV + Greeks study.
This is strictly for learning and educational purposes.
________________________________________
🟢 1. MARUTI 14800 CALL
LTP: 383.95
Sentiment: Bullish | Trend: Up | Strength: 5/5 (Strong)
IV: 20.5 | Delta: 0.53 | Theta: -8.64 | Vega: 17.6
Buildup: Long Build-up
Why?
This strike shows a Long Build-up with price rising 10.1% and OI up 38.2%, a textbook bullish confirmation.
Though volume dipped (-25.7%), IV rose 8.4% supporting premium expansion. Delta 0.53 signals strong ITM probability.
________________________________________
🟢 2. MARUTI 14700 CALL
LTP: 436.15
Sentiment: Bullish | Trend: Up | Strength: 5/5 (Strong)
IV: 20.5 | Delta: 0.56 | Theta: -8.66 | Vega: 17.4
Buildup: Long Build-up
Why?
14700 CE shows a Long Build-up with price up 9.8% and OI up 15.7%, confirming bullish sentiment.
Volume is lower (-33.5%), but IV rising 9.2% supports premiums. Delta 0.56 shows strong ITM odds.
________________________________________
🟢 3. ADANIENT 2300 CALL
LTP: 70.15
Sentiment: Bullish | Trend: Up | Strength: 5/5 (Strong)
IV: 27.6 | Delta: 0.52 | Theta: -2.35 | Vega: 2.7
Buildup: Long Build-up
Why?
2300 CE has a Long Build-up with price up 4.4% and OI soaring 81%, backed by a 219% volume surge.
IV rising 5.5% confirms premium expansion. Strong participation makes this a convincing bullish setup.
________________________________________
🟢 4. TITAN 3650 CALL
LTP: 77.4
Sentiment: Bullish | Trend: Up | Strength: 5/5 (Strong)
IV: 16.6 | Delta: 0.53 | Theta: -2.13 | Vega: 4.3
Buildup: Long Build-up
Why?
3650 CE shows a Long Build-up, with price rising 22.2% and OI up 46.2%, supported by strong volume (+89%).
IV is moderate at 16.6, and Delta at 0.53 signals strong ITM chances.
________________________________________
🟢 5. POLYCAB 7200 CALL
LTP: 184
Sentiment: Bullish | Trend: Up | Strength: 5/5 (Strong)
IV: 24.3 | Delta: 0.51 | Theta: -6.32 | Vega: 8.5
Buildup: Long Build-up
Why?
7200 CE has a powerful Long Build-up, with price up 5.8% and OI surging 364%, supported by a massive 1552% volume jump.
IV at 24.3 is stable but rising, confirming strength.
________________________________________
⚠️ Disclaimer – Please Read Carefully
The information shared here is meant purely for learning and awareness.
It is not a buy or sell recommendation and should not be taken as investment advice.
📌 I am not a SEBI-registered investment advisor.
📌 All views expressed are based on personal study, chart patterns, and publicly available data.
📌 Trading — whether in stocks or options — carries risk. Markets can move unexpectedly, and losses can exceed capital.
📌 Past setups do not guarantee future outcomes.
👉 Beginners: use this to learn market behavior, practice with paper trades before risking money.
👉 Experienced traders: apply your own risk management, sizing, and strategy filters.
👉 Always consult a SEBI-registered financial advisor before real trades.
By engaging with this content, you acknowledge full responsibility for your own trading and investments.
________________________________________
💬 Found this useful?
🔼 Boost this post to help more traders learn.
✍️ Share your thoughts/setups in comments — let’s grow together.
🔁 Share with fellow traders & learners.
👉 “Follow for more clean, structured breakdowns with discipline at the core.”
🚀 Stay Calm. Stay Clean. Trade With Patience.
Trade Smart | Learn Zones | Be Self-Reliant 📊
________________________________________
5th August 2025 trade plan prediction🔼 Bullish Triggers
✅ Above 24,790 = Hold CE by positive trade view
✅ Above 24,920 = Strong bullish breakout (Entry zone for CE)
✅ Above 25,028 = Shot Cover Level → Upside acceleration likely
CE (Call Option) Strategy:
Buy CE above 24,790 for 24,920 / 25,000 targets
Add CE above 25,028 for quick upside move
🔽 Bearish Triggers
🔻 Below 24,700 = Slightly negative bias starts
🔻 Below 24,670 = Below Opening R1 → PE can be bought cautiously
🔻 Below 24,533 = Risk zone → Hold PE by level
🔻 Below 24,433 = UNWINDING zone → Strong bearish momentum
🔻 Below 25,000 = Safe Zone for PE if reversal happens from higher levels
PE (Put Option) Strategy:
Buy PE if breaks 24,670 for 24,533 / 24,433 targets
Add below 24,423 for deeper downside move

Nifty 50 Intraday Trade Plan for tomorrow 28 july 2025📉 Resistance & PE Zones (For Short / PE Trades):
🔴 25,180 – Below 10M Hold PE by Safe Zone
Safe shorting zone if Nifty trades below this after a 10-minute hold.
🔴 25,030 – Below 10M Hold PE by Risky Zone
Entry for PE trades but more risky. Be cautious with volumes and market sentiment.
🟣 24,920 – Below 10M Hold = Negative Trade View
If Nifty holds below this, bias turns negative.
⚫ 24,780 – Below Opening R1 = 10M Hold PE by Level
Below this level, PE trades can be initiated with confirmation.
🟠 24,638 – Below 10M Hold PE by Level
Additional downside continuation level for PE holding.
🟢 24,480 – BELOW 10M Hold = UNWINDING Level
If price sustains below this, expect long unwinding and further decline.
🔵 24,173 – Day UP Trade Fib Support (0.382)
Major Fibonacci support; possible bounce zone or reversal area.
📈 Support & CE Zones (For Long / CE Trades):
🔴 25,200 – Above 10M Closing Shot Cover Level
Short covering possible if Nifty closes above this level.
🟠 25,030 – Above 10M Hold CE by Entry Level
Entry for long trades if 10M hold is confirmed.
🟣 24,920 – Above 10M Hold = Positive Trade View
Holding above this confirms bullish bias.
⚫ 24,800 – Above Opening S1 = 10M Hold CE by Level
Early confirmation level for long trades post opening.
🟠 24,638 – Above 10M Hold CE by Level
Intermediate support if market bounces from lower levels.
🟢 24,500 – Above 10M Hold CE by Safe Zone Level
Safer zone for holding long positions above this point.
✅ Key Levels Summary:
Bullish Above: 24,920 / 25,030 / 25,180
Bearish Below: 24,920 / 24,780 / 24,638 / 24,480
Major Support: 24,173 (Fib level)
Neutral Zone: Between 24,780–24,920 → Wait for breakout

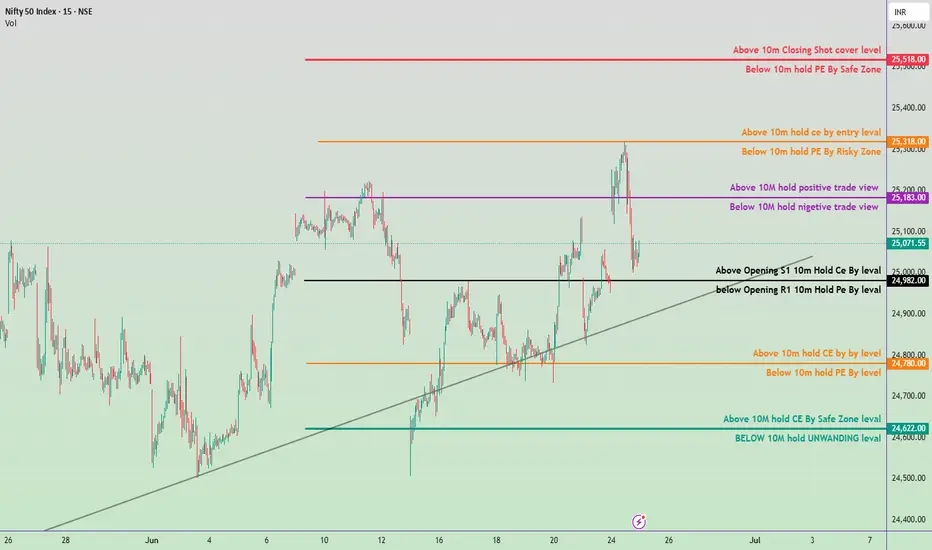
June 25, Nifty 50 intraday trade plan for tomorrow✅ Bullish Zones (Call Buyer Favorable):
🔺 Above 25,518
→ Closing short-covering level
Strong breakout / upside momentum
🟧 Above 25,318
→ 10M hold CE by entry level
Safe CE entry zone
🟪 Above 25,183
→ Positive trade view zone
⚫ Above 24,982
→ Opening S1 CE hold level
🟩 Above 24,622
→ Safe zone for CE buying
❌ Bearish Zones (Put Buyer Favorable):
🔻 Below 25,518
→ Safe zone for PE buyers
🟧 Below 25,318
→ Risk zone for PE buyers
🟪 Below 25,183
→ Negative trade view zone
⚫ Below 24,982
→ Opening R1 PE hold level
🟧 Below 24,780
→ 10M PE hold level
🟦 Below 24,622
→ Unwinding zone – Weak market signal
📊 Tomorrow’s Trading Strategy
Opening Above 25,183
Look for CE Buying Opportunities.
Target 25,318 → 25,518.
Opening Between 25,071–24,982
Neutral to cautious zone.
Wait for price action confirmation near key levels.
Opening Below 24,780
Look for PE Buying or CE Selling.
Possible test of 24,622 → 24,500 zone.
Trendline Support Near 24,850
If broken, expect downside acceleration.
Monday,June 24 Nifty 50 Intraday Trade Plan & kye leves
🔴 Resistance Zones:
25,138 – Crucial Resistance (Above 10M hold = Positive Trade View)
Break & sustain above = bullish continuation
25,330 – Above 10M hold CE by entry level
25,390+ – Closing short-cover zone
🟡 Neutral Zone:
25,100 to 24,970
Sideways/volatility zone between positive and negative trade views
🔵 Support Zones:
24,970 – Opening S1 Hold CE By Level (Important support)
24,740 – 10M hold CE By Level (Demand zone)
24,538 – Safe Zone for CE holding
📌 Trade Plan:
🔼 Bullish Scenario:
If sustains above 25,138 → expect rally towards 25,330 and 25,390+
Entry near 25,110–25,138 zone (on retest) with SL below 25,070
🔽 Bearish Scenario:
If price breaks below 24,970 → watch for decline towards 24,740 and then 24,538
Entry on breakdown with SL above 25,000
🧠 Sentiment Strategy:
Above 25,138 = bullish bias (Buy on dips)
Below 25,100 = neutral
Below 24,970 = bearish sentiment builds up

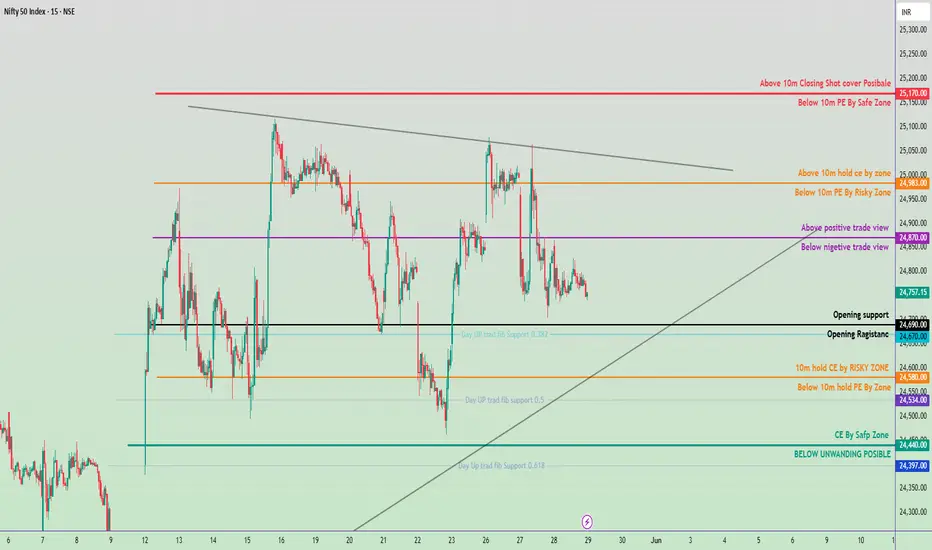
May 29, 2025 Nifty 50 Trading Zone 🔺 Bullish Bias If:
Price sustains above 24,870:
Expect move towards 24,983 (Above 10M CE zone).
Target: 25,170 (Short covering may trigger).
Strategy: Buy on dips above 24,870 with SL below 24,840.
🔻 Bearish Bias If:
Price falls below 24,670:
Likely to test 24,580 and 24,534 ( PE zones).
Break below 24,440 opens downside to 24,397 (unwinding zone).
Strategy: Sell on rise below 24,670 with SL above 24,720.
⚖️ Neutral/Bounce Zone:
Between 24,710 – 24,870:
Choppy moves expected; avoid fresh positions unless breakout confirms.
📌 Key Levels to Watch:
Breakout Level (Upside): 24,870
Breakdown Level (Downside): 24,670
Major Support: 24,397
Major Resistance: 25,170
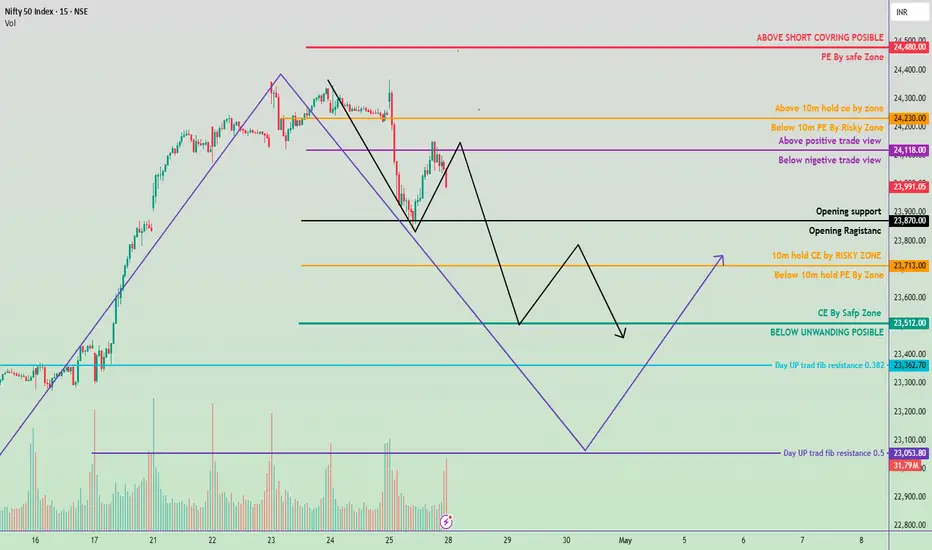
28 april nifty trading zone#Nifty50 #option trading
99% working trading plan
👉Gap up open 24118 above & 15m hold after positive trade target 24230,
👉Gap up open 24118 below 15 m not break upside after nigetive trade target 23870, 23713, 23512
👉Gap down open 24112 above 15m hold after positive trade target 24118 , 24230
👉Gap down open 24112 below 15 m not break upside after nigetive trade target 23870, 23713, 23512
💫big gapdown open 23713 above 1st positive trade view
💫big Gapup opening 24230 below 1st nigetive trade view
📌 Trade plan for education purpose I'm not responsible your trade
More education follow social media and boost my idea
📌 koi bhi trade leval se 20 point ke sl ke bhina karan nahi hi
📌 koi trade app activate tabhi karana hota hi level pe 2 candle uper ya niche closing aati hai to
📌 leval par Ane pe turant trade plan na kare ...
📌 Full risk apaki hi hi meri nah
Option Chain AnalysisOption chain analysis is the process of evaluating the information provided in the option chain to identify potential trading opportunities. Traders use option chain analysis to evaluate the market's expectations of an asset's future price movements and make informed decisions about their investments.
OI stands for Open Interest, which is the total number of outstanding option contracts that have not yet been settled. OI helps to gauge market trends and shows how many options contracts are still open. Higher open interest generally indicates higher liquidity and market activity for that contract.
Use Graphs and Charts: You can plot the option chain data on graphs and charts. It will help understand the trends associated with different components of the option chain. Technical and Fundamental Analysis: Investors must analyse technical factors (associated with price) to make informed decisions.

option chain analysisTo study an option chain, focus on the current market price, displayed in the centre. Analyse the built-up data to understand market direction based on recent changes in open interest and price. ITM call options are typically highlighted in yellow, making it easier to distinguish them from other options.
Nifty option chain is considered to be the best advance warning system of sharp moves or break outs in the index.

Nifty moments for intraday and option trading 22/Nov/2024Nifty moments for intraday and option trading 22/Nov/2024
follow us for more updates and information.

OPTION DATABASE TRADING An option chain is a comprehensive list that shows you all available option contracts for a given stock. These are sorted by their expiration date, which is the last day you can trade or use the option, and strike price, which is the price at which you can buy (call) or sell (put) the stock.
Nifty option chain is considered to be the best advance warning system of sharp moves or break outs in the index.

Database Option Trading #TradingviewOption chain data is the complete picture pertaining to option strikes of a particular stock or index in a single frame. In the Option chain frame, the strike price is at the centre and all data pertaining to calls and puts on the same strike are presented next to each other.

Option chainAn option chain is a comprehensive list that shows you all available option contracts for a given stock. These are sorted by their expiration date, which is the last day you can trade or use the option, and strike price, which is the price at which you can buy (call) or sell (put) the stock.
An option chain is a valuable tool for traders who want to make informed decisions about their investments. It provides information on the strike price, expiration date, and the price of each option.

Option TradingTo read an option chain, you can look for the following information:
Strike price: The price at which the stock is bought if the option is exercised
Premium: The price of the options contract, or the upfront fee paid by the investor
Expiry dates: The dates on which the option expires, which can affect the premium
Open interest (OI): The total number of outstanding option contracts that have not been settled
Implied volatility (IV): A percentage that indicates the expected price fluctuations, and the level of uncertainty or risk in the market
Bid: The best available price at which the option can be sold
Ask: The best available price at which the option can be purchased
Volume: The number of transactions that have occurred on the current trading day
Net change: The net change of LTP, where a positive change indicates a rise in price and an unfavorable change indicates a decrease in price
Bid qty: The number of buy orders for a specific strike price
Ask qty: The number of open sell orders for a specific strike price
Here are some other tips for reading an option chain:
The option chain is divided into two sections, calls and puts, with calls on the left and puts on the right
The current market price is displayed in the center
ITM call options are usually highlighted in yellow
Higher open interest usually indicates higher liquidity and market activity
