Maruti - Compression Setup Near Resistance💹 Maruti Suzuki India Ltd (NSE: MARUTI)
Sector: Automobiles | CMP: 16187 | View: Compression Setup Near Resistance
STWP Support & Resistance – MARUTI
Resistances: 16264 | 16311 | 16426
Supports: 16102 | 16017 | 15940
While the above levels highlight the nearest technical markers, the chart shows that the broader resistance band between 16264–16426 is relatively weak, marked by shallow rejection wicks and limited seller follow-through, suggesting only mild supply overhead. On the downside, the support pockets around 16102–16017 and the deeper zone near 15940 appear structurally stronger, backed by prior accumulation and repeated stabilization attempts that show institutional interest absorbing dips. This configuration reflects a market in compression near resistance, where buyers are defending declines but have yet to demonstrate strong breakout conviction; sustained movement above 16264 may improve momentum, while failure to hold 16017 could shift short-term control back to sellers.
STWP Volume & Technical Setup – MARUTI
MARUTI continues to display a tightly coiled structure, reflecting clear price compression and controlled volatility as the stock trades within a contracting range after a series of higher-lows and overlapping candles. The volume profile remains within normal distribution, with no abnormal spikes, signalling that institutional participation has been steady but not aggressive. Momentum indicators show a mixed landscape — RSI stabilizing in the mid-zones, MACD maintaining a neutral-to-slightly positive crossover profile, and CCI oscillating around its mean — collectively suggesting that the stock is preparing for a decisive move rather than trending with strength. Compression metrics, such as narrow-body candles and tightening ranges, indicate that liquidity is positioning but not yet committed, while the BB bands remain moderately tightened, hinting at a potential volatility expansion trigger. Despite this consolidation, the broader structural undertone leans mildly bullish, supported by the trend strength seen in prior legs and the stock’s ability to hold above key support pockets even after intraday profit-booking phases. Overall, MARUTI’s setup resembles a pre-breakout equilibrium phase where buyers and sellers are evenly matched, and a clean breakout or breakdown candle will determine the next directional impulse.
STWP Summary View
Final Outlook: Momentum: Developing|Trend: Mildly Bullish|Risk: Moderate|Volume: Normal
The overall MARUTI derivatives landscape reflects a broadly bearish environment observed across intraday, short-term swing, volatility, buildup, ATM structure, strategy alignment, smart-money behaviour and straddle characteristics, where the prevailing trend remains down and sentiment stays negative, with an STWP Edge Score of 6.4/10 indicating a moderate yet structured setup that requires disciplined sizing rather than aggressive positioning. The frequently referenced strike throughout the analysis is the 16200 level, where the PUT (delta -0.46) recorded an LTP of 229.15 after a 19.63% gain, supported by volume expansion of 15.5% to 6363 contracts and a mild IV rise to 16.2%, while open interest dropped sharply by 26.5% (-24,450 contracts), creating a short-covering signature that often reflects trapped participants exiting positions as prices shift. These dynamics form part of a broader mixed-to-moderate structural zone where the option behaves closer to futures because of its delta profile, giving smoother directional sensitivity with controlled convexity. The intraday and swing illustrations revolve around defined levels such as the entry around 229.15, a protective threshold at 194.78 and reference targets near 280.71 and 297.89, used purely to demonstrate risk structuring and reward modelling practices in an academic context. Volatility sits in a balanced band, with average IV near 15.65%, a high of 18.69% at the 15000 PUT and a low of 13.97% at the 16000 CALL, creating an environment where different option structures behave differently depending on how implied volatility evolves. The buildup distribution further reinforces the bearish tilt seen in derivatives behaviour: the CALL side held moderate short build-up and long unwinding, whereas the PUT side displayed strong short-covering activity supported by minor long additions, highlighting pressure points and exhaustion pockets in the flow. The ATM strike at 16200 acts as the central sensitivity zone with the CE at 253.75 (delta 0.55, IV 14.31%) and the PE at 229.15 (delta -0.46, IV 16.22%), helping market participants understand how gamma, delta shifts and volatility behaviour influence intraday reactions. Broader strategy illustration shows how trend strength, call-side dominance in flows, a mid-range IV environment and a PCR of 0.66 combine to form a generalized bearish framework, while the Smart Money Heat assessment indicates about 36% bearish momentum derived from long build-up, short build-up, short-covering and unwinding activity across liquid strikes; liquidity metrics such as a median OI of 88750 and a median volume of 3380 provide context for depth and participation. The straddle analysis at the 16200 strike shows a combined premium of 2.98% against an expected move of 3.83%, an average IV band of 15.27%, a near-flat net delta of 0.09, a symbol-level PCR of 0.78 and a max pain level anchored at 16200, illustrating how volatility expectations, premium richness, delta neutrality and positioning pressures interact. Collectively, these elements present a comprehensive educational study of how trend, volatility, open interest behaviour, buildup distribution, gamma-zone dynamics, straddle structure and flow-based sentiment can be read together as part of an institutional-style analytical exercise, without forming any investment advice or trade recommendation of any kind.
⚠️ STWP Legal Disclaimer
This document is strictly for educational and informational purposes. All examples, charts, levels, and option structures discussed are illustrative and are not intended as buy, sell, or hold recommendations. STWP does not provide investment advice, trading tips, signals, or personalized financial guidance of any kind, nor is it a SEBI-registered intermediary or research analyst. The analyses, illustrations, and risk–reward structures included here are generic in nature and based on publicly available data and observed market behaviour, which may change without notice. Financial markets involve significant risk; derivatives in particular carry the potential for substantial losses. Option premiums, implied volatility, open interest, delta, and other market variables can fluctuate rapidly and unpredictably.
Readers are solely responsible for their trading decisions, capital management, and risk assessment. Before making any investment or trading decision, please consult a SEBI-registered investment advisor. STWP, its representatives, and affiliates shall not be liable for any direct or indirect loss arising from the use of this material. Historical patterns or past market behaviour do not guarantee future outcomes, nor should any part of this document be interpreted as a promise of performance, accuracy, or returns.
Position Status: No active position in this instrument at the time of analysis.
Data Source: TradingView & NSE India.
💬 Found this useful?
🔼 Boost this post to support structured learning
✍️ Share your thoughts or questions in the comments
🔁 Forward this to traders who value clean technical studies
👉 Follow for disciplined, structured, STWP-style analysis
🚀 Stay Calm. Stay Clean. Trade With Patience.
Trade Smart | Learn Zones | Be Self-Reliant 📊
Optionchainanalysis

ADANIENT - Range Support Retest near 2280💹 Adani Enterprises Ltd (NSE: ADANIENT)
Sector: Conglomerate | CMP: 2280.00 | View: Range Support Retest near 2280
ADANIENT spent the day moving weakly, and the price behaviour was fairly simple to understand. The stock opened soft, tried to move up for a short while, but sellers stepped in around 2320–2340 and pushed it back down. After that, the price slowly fell and ended close to 2280 again. This shows that sellers were stronger throughout the day. The volumes also increased on the down-moves, which means the selling was genuine, not panic.
On bigger charts, the stock has been moving inside a wide range between 2240 at the bottom and 2600 at the top. Every time it tries to go up near 2320–2360 or even higher toward 2540–2600, it gets rejected. Since it is now close to the lower part of this range again, the stock is still sideways — not in a strong uptrend. For a beginner, the simple takeaway is: sellers are active above 2320, buyers support the stock near 2240–2280, and until one side breaks these levels, the stock will continue to move inside this range.
Today’s option activity shows that traders were expecting ADANIENT to stay within a range rather than make a big breakout. Call options (especially the 2300 CE) saw buying earlier in the day, which usually signals that some traders were hoping for an upward move if the stock stayed above support. However, not all call strikes were useful — some were too deep in the money or too far out of the money, making them less effective for quick intraday moves.
On the put side, a lot of traders were selling puts at 2280 and 2300. When traders sell puts, it usually means they believe the stock will stay above those levels. This also keeps put premiums lower, because sellers expect stability rather than a big fall. Since the price stayed near support, the put sellers had the advantage — they earned from slow premium decay.
Volatility (IV) remained moderate, meaning the market wasn’t expecting a huge jump or crash. The overall setup shows a tug-of-war: call buyers are holding on for a bounce, while put sellers are confident that 2280–2300 will act as a support zone.
In simple terms:
• If ADANIENT stays above 2280, call options may gain.
• If ADANIENT breaks below 2280, the fall may continue — but usually only after a retest confirms the breakdown.
This structure fits a typical range-bound market where both sides are active but support levels still matter.
For next session, the most important level on the chart is 2280. If the stock stays above this area, it can bounce toward 2320–2340. If it slips below 2280 and fails to get back above it, the next support lies around 2240–2250. For a bounce setup, the cleaner option is the 2300 CE — only take it if the stock holds 2280 and then climbs back above 2292–2295 on a 5 or 15-minute chart. Exit if the option premium drops around 20–25% or if the stock closes below 2275. For a breakdown setup, the safer choice is the 2260 PE, but only after the stock breaks 2280, retests it from below, and stays under 2275. Exit if the premium falls about 25–30% or if the spot goes back above 2285.
Avoid trading in the tight 2280–2298 band — price gets choppy there and option premiums decay quickly. Keep your position sizes reasonable and use strict stop-losses based on option premium, not just spot price. Watch how open interest and volumes behave — sudden changes often reveal the next move early. Overall, 2280–2300 is the fight zone. Holding it means a possible bounce; losing it opens the door to a deeper dip. Monday may be volatile in the first hour, so follow levels, watch volume, and react only after confirmation.
⚠️ STWP Legal Disclaimer
This document is strictly for educational and informational purposes. All examples, charts, levels, and option structures discussed are illustrative and are not intended as buy, sell, or hold recommendations. STWP does not provide investment advice, trading tips, signals, or personalized financial guidance of any kind, nor is it a SEBI-registered intermediary or research analyst. The analyses, illustrations, and risk–reward structures included here are generic in nature and based on publicly available data and observed market behaviour, which may change without notice. Financial markets involve significant risk; derivatives in particular carry the potential for substantial losses. Option premiums, implied volatility, open interest, delta, and other market variables can fluctuate rapidly and unpredictably.
Readers are solely responsible for their trading decisions, capital management, and risk assessment. Before making any investment or trading decision, please consult a SEBI-registered investment advisor. STWP, its representatives, and affiliates shall not be liable for any direct or indirect loss arising from the use of this material. Historical patterns or past market behaviour do not guarantee future outcomes, nor should any part of this document be interpreted as a promise of performance, accuracy, or returns.
Position Status: No active position in this instrument at the time of analysis.
Data Source: TradingView & NSE India.
💬 Found this useful?
🔼 Boost this post to support structured learning
✍️ Share your thoughts or questions in the comments
🔁 Forward this to traders who value clean technical studies
👉 Follow for disciplined, structured, STWP-style analysis
🚀 Stay Calm. Stay Clean. Trade With Patience.
Trade Smart | Learn Zones | Be Self-Reliant 📊

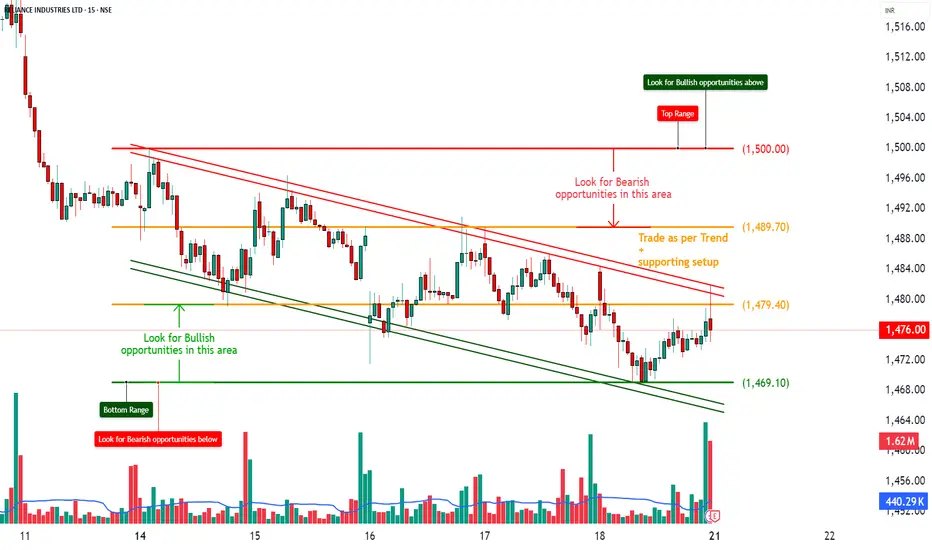
RELIANCE – Positive Outlook Post Q1 Results with Bullish OI________________________________________________________________________________📈 RELIANCE – Positive Outlook Post Q1 Results with Bullish OI Confirmation
📅 Setup Date: 17.07.2025 | ⏱ Timeframe: Daily
📍 Strategy: Post-Earnings Momentum Setup with Defined Risk
________________________________________________________________________________
🔍 Overall View
Spot Price: ₹1476
Q1 Result Update: Profit ↑12% YoY, beat estimates — strong earnings trigger
Trend: Bullish Reversal – Price holding above 1470 with fresh long build-up in CEs
Volatility: IV ~23–27%, stable to slightly rising → good for directional plays
Ideal Strategy Mix: Bullish directional spreads or high delta long CE
________________________________________________________________________________
1️⃣ Bullish Trade
Best CE: Buy 1480 CE @ ₹25.15
Why:
• Long Build-Up (+60.38% OI) with price ↑3.5% — strong institutional buying
• At-the-money with delta 0.50 → responsive to price movement
• High OI (27.5 lakh) with active volumes confirms smart money activity
• Matches post-result momentum — ideal CE for breakout strategy
________________________________________________________________________________
2️⃣ Bearish Trade (Contrarian)
Best PE: Sell 1450 PE @ ₹10.75
Why:
• Short Covering seen (-5.57% OI) → downside hedge positions getting closed
• Price ↑3.3% and IV stable (22.36%) → premium erosion favorable
• Spot is comfortably above ₹1450, providing buffer
• Rests below key support zone post-result → limited downside expectation
________________________________________________________________________________
3️⃣ Strategy Trade (As per trend + OI data)
Strategy: Bull Call Spread → Buy 1480 CE / Sell 1520 CE
→ ₹25.15 / ₹8.85
Net Debit: ₹16.30
Max Profit: ₹40 – ₹16.30 = ₹23.70
Max Loss: ₹16.30
Risk:Reward: ≈ 1 : 1.45 ✅
Lot Size: 500
Total Risk: ₹8,150
Max Profit: ₹11,850
📊 Breakeven Point: ₹1496.30
📉 Exit If: Spot closes below ₹1465 (invalidates CE strength and post-result optimism)
________________________________________________________________________________
Why:
• Strong Q1 numbers + fresh long build-up on 1480 CE and 1470 CE
• 1520 CE also active but minor short covering = good candidate to sell
• IVs are moderate, giving clean pricing for spreads
• Defined risk, R:R > 1:1, and positive delta makes this strategy safer
________________________________________________________________________________
📘 My Trading Setup Rules
Avoid Gap Plays
→ Check pre-open price action to avoid trades influenced by gap-ups/gap-downs.
Breakout Entry Only
→ Enter trades only if price breaks previous day’s High (for bullish trades) or Low (for bearish trades).
Watch Volume for Confirmation
→ Monitor volume closely. No volume = No trade.
Enter on Strong Candle + Volume
→ Execute the trade only if a strong candle appears with increasing volume in the direction of the trade.
Defined Risk:Reward Only
→ Take trades only if R:R is favourable (ideally ≥ 1:2).
Premium Disclaimer
→ Option premiums shown are based on EOD prices — real-time premiums may vary during execution.
Time Frame Preference
→ Trade with your preferred time frame — this strategy works across intraday or positional setups.
________________________________________________________________________________
⚠ Disclaimer (Please Read):
• These Trades are shared for educational purposes only and is not investment advice.
• I am not a SEBI-registered advisor.
• The information provided here is based on personal market observation.
• No buy/sell recommendations are being made.
• Please do your own research or consult a registered financial advisor before making any trading decisions.
• Trading involves risk. Always use proper risk management.
I am not responsible for trading decisions based on this post.
________________________________________________________________________________
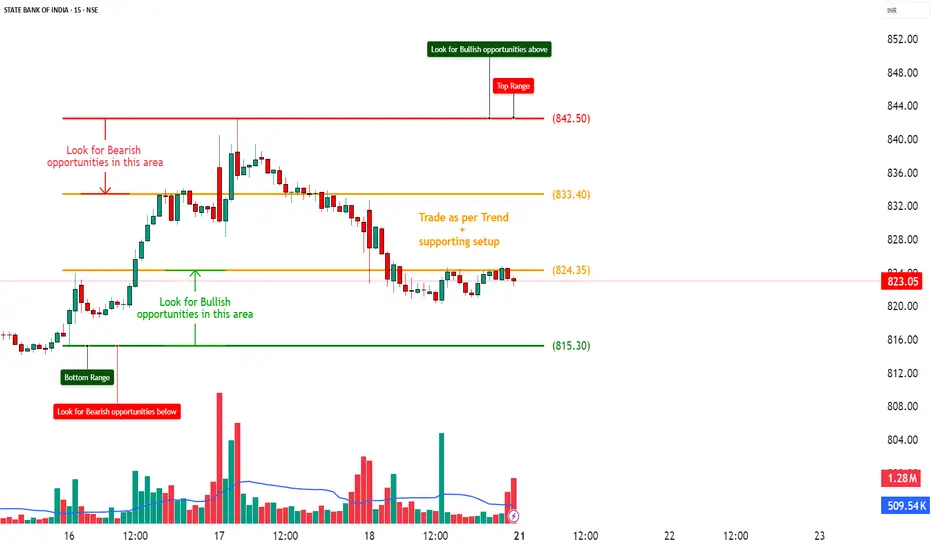
SBIN – Bearish Bias with Heavy CE Shorts and Weak Call Structure________________________________________________________________________________📈 SBIN – Bearish Bias with Heavy CE Shorts and Weak Call Structure
📅 Setup Date: 17.07.2025 | ⏱ Timeframe: Daily
📍 Strategy: Short-Term Bearish Momentum Setup with Defined Risk
________________________________________________________________________________
🔍 Overall View
Spot Price: ₹823.35
Trend: Mildly Bearish – Spot facing resistance at 830–840 with weak CE premiums
Volatility: IV ~18%–22% (stable to slightly elevated)
Ideal Strategy Mix: Bearish directional trades or credit spreads near resistance
________________________________________________________________________________
1️⃣ Bullish Trade (Contrarian Setup)
Best CE: Buy 820 CE @ ₹12.65
Why:
• ATM strike with highest delta (0.56) among CEs
• Smallest short build-up in CE chain (OI ↑0.73%, vs ~+4%–12% on other CEs)
• If spot reclaims 830+, this option will respond fastest
• IV is lowest (17.73%) = cheapest in premium vs other strikes
Contrarian Setup – Not ideal unless spot crosses 830 with strong volume
________________________________________________________________________________
2️⃣ Bearish Trade
Best PE: Buy 820 PE @ ₹8.65
Why:
• Strong Long Build-Up (+29.5% OI), volume-led spike (+46.6%)
• Solid delta (-0.44) with decent Vega → responds well to downside
• IV is relatively low (19.6%), allowing room for expansion
• Ideal strike as spot sits slightly above – quick delta pickup expected
________________________________________________________________________________
3️⃣ Strategy Trade (As per trend + OI data)
Strategy: Bear Put Spread → Buy 820 PE / Sell 800 PE
→ ₹8.65 / ₹3.00
Net Debit: ₹5.65
Max Profit: ₹20 – ₹5.65 = ₹14.35
Max Loss: ₹5.65
Risk:Reward: ≈ 1 : 2.54 ✅
Lot Size: 750
Total Risk: ₹4,237.50
Max Profit: ₹10,762.50
📊 Breakeven Point: ₹814.35
📉 Exit If: Spot closes above ₹832 (invalidates PE strength and bearish structure)
________________________________________________________________________________
Why:
• Heavy CE short build-up across 820–850 strikes (Bearish Call Ladder)
• 820 PE has strong long buildup + clean delta = momentum PE
• 800 PE still holding OI, good strike to sell for defined risk
• IVs are still in mid-range = spread cost low, R:R > 1:2.5
________________________________________________________________________________
📘 My Trading Setup Rules
Avoid Gap Plays
→ Check pre-open price action to avoid trades influenced by gap-ups/gap-downs.
Breakout Entry Only
→ Enter trades only if price breaks previous day’s High (for bullish trades) or Low (for bearish trades).
Watch Volume for Confirmation
→ Monitor volume closely. No volume = No trade.
Enter on Strong Candle + Volume
→ Execute the trade only if a strong candle appears with increasing volume in the direction of the trade.
Defined Risk:Reward Only
→ Take trades only if R:R is favourable (ideally ≥ 1:2).
Premium Disclaimer
→ Option premiums shown are based on EOD prices — real-time premiums may vary during execution.
Time Frame Preference
→ Trade with your preferred time frame — this strategy works across intraday or positional setups.
________________________________________________________________________________
⚠ Disclaimer (Please Read):
• These Trades are shared for educational purposes only and is not investment advice.
• I am not a SEBI-registered advisor.
• The information provided here is based on personal market observation.
• No buy/sell recommendations are being made.
• Please do your own research or consult a registered financial advisor before making any trading decisions.
• Trading involves risk. Always use proper risk management.
I am not responsible for trading decisions based on this post.
________________________________________________________________________________
HDFCBANK – Bullish Potential Post Results, But OI Shows Bearish________________________________________________________________________________📈 HDFCBANK – Bullish Potential Post Results, But OI Shows Bearish Overhang
📅 Setup Date: 17.07.2025 | ⏱ Timeframe: Daily
📍 Strategy: Post-Earnings Reaction Play with Mixed Sentiment in Options
________________________________________________________________________________
🔍 Overall View
Spot Price: ₹1957.4
Trend: Mixed – Strong Q1 results (profit ↑12%, bonus/dividend declared), but price action weak
Volatility: High IVs — Calls ~23–25%, Puts ~29–32% → post-result event premium still elevated
Ideal Strategy Mix: Neutral-to-bullish spreads with defined risk or post-IV crush contrarian longs
________________________________________________________________________________
1️⃣ Bullish Trade (Contrarian Setup with Fundamental Trigger)
Best CE: Buy 1980 CE @ ₹24.2
Why:
• Strong earnings + corporate action (bonus/dividend) → triggers potential sentiment reversal
• CE 1980 saw Short Build-Up (+144% OI), premium ↓25% → ideal for short-covering setup
• Delta ~0.41 with high IV (~24.3%) → moderate leverage & gamma in case of price breakout
• Use only if price breaks and sustains above ₹1975 with strong candle + volume
________________________________________________________________________________
2️⃣ Bearish Trade (Trend Following)
Best PE: Sell 1900 PE @ ₹16.65
Why:
• PE 1900 saw massive Long Build-Up (+70%) but IV surged → may now face decay pressure
• Selling this deep OTM PE gives ~₹57 buffer from spot (≈3% downside cushion)
• Post-results, downside may be limited → good candidate to play post-IV crush
• Spot stability around 1950–1960 invalidates aggressive downside
________________________________________________________________________________
3️⃣ Strategy Trade (Defined Risk Based on Mixed Setup)
Strategy: Bull Call Spread → Buy 1980 CE / Sell 2020 CE
→ ₹24.2 / ₹10.7
Net Debit: ₹13.50
Max Profit: ₹40 (spread width) – ₹13.5 = ₹26.5
Max Loss: ₹13.50
Risk:Reward: ≈ 1 : 1.96 ✅
Lot Size: 550
Total Risk: ₹7,425
Max Profit: ₹14,575
📊 Breakeven Point: ₹1993.5
📉 Reversal Exit Level: Exit if Spot < ₹1940 (invalidates breakout + earnings move fade)
________________________________________________________________________________
Why:
• Bullish news (Q1 beat, bonus/dividend) could trigger CE short covering if price moves above 1980
• Limited risk strategy — works well if post-result rally is moderate
• High IVs favour spread over naked options (caps loss from premium crush)
• CE OI from 1960–2060 mostly short → if momentum picks up, rally could be fast
________________________________________________________________________________
📘 My Trading Setup Rules
Avoid Gap Plays
→ Check pre-open price action to avoid trades influenced by gap-ups/gap-downs.
Breakout Entry Only
→ Enter trades only if price breaks previous day’s High (for bullish trades) or Low (for bearish trades).
Watch Volume for Confirmation
→ Monitor volume closely. No volume = No trade.
Enter on Strong Candle + Volume
→ Execute the trade only if a strong candle appears with increasing volume in the direction of the trade.
Defined Risk:Reward Only
→ Take trades only if R:R is favourable (ideally ≥ 1:2).
Premium Disclaimer
→ Option premiums shown are based on EOD prices — real-time premiums may vary during execution.
Time Frame Preference
→ Trade with your preferred time frame — this strategy works across intraday or positional setups.
________________________________________________________________________________
⚠ Disclaimer (Please Read):
• These Trades are shared for educational purposes only and is not investment advice.
• I am not a SEBI-registered advisor.
• The information provided here is based on personal market observation.
• No buy/sell recommendations are being made.
• Please do your own research or consult a registered financial advisor before making any trading decisions.
• Trading involves risk. Always use proper risk management.
I am not responsible for trading decisions based on this post.
________________________________________________________________________________

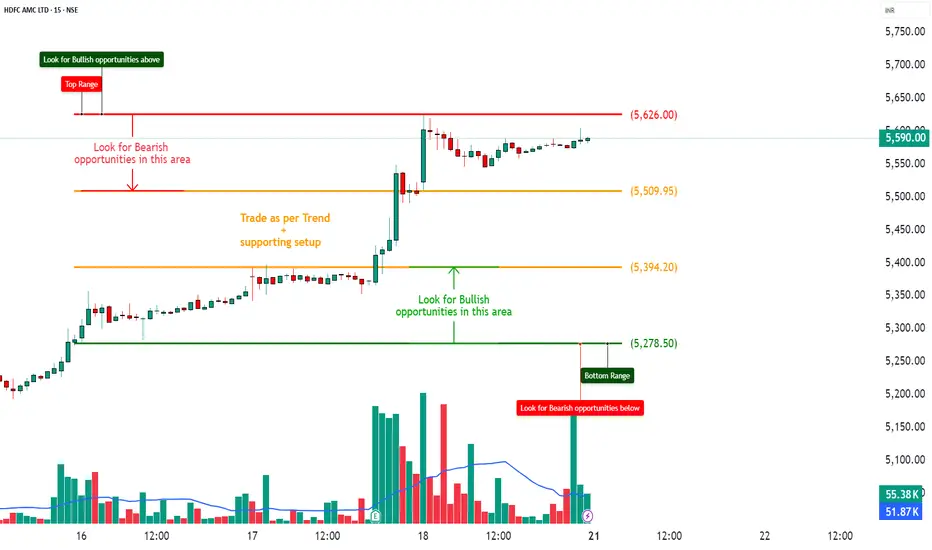
HDFCAMC – Bullish Momentum with Short Covering Base________________________________________________________________________________📈 HDFCAMC – Bullish Momentum with Short Covering Base
📅 Setup Date: 18.07.2025 | ⏱ Timeframe: Daily
📍 Strategy: Momentum Trade Setup with Defined Risk
________________________________________________________________________________
🔍 Overall View
Spot Price: ₹5590
Trend: Bullish Bias – Price sustaining above 5500 with momentum
Volatility: IV ~26–29%, relatively stable with mild contraction
Ideal Strategy Mix: Directional long with partial risk spreads
________________________________________________________________________________
1️⃣ Bullish Trade (Naked options as per trend)
Best CE: Buy 5700 CE @ ₹60.75
Why:
• Long Build-Up (+11.91% OI) with price ↑6.49% = bullish conviction
• Strike just ₹110 above spot → good balance of delta (0.41) and premium
• High TTV (₹89.9 Cr) and stable IV (~26.6%) → institutional activity
• CE 5600 also active, but 5700 is cleaner structure due to fresh longs
________________________________________________________________________________
2️⃣ Bearish Trade (Contrarian Trade – if present)
Best PE: Sell 5500 PE @ ₹59.5
Why:
• Short Build-Up on 5500 PE (+118.7% OI), but price ↓45.84% → strong put writing
• Spot comfortably above strike (₹5590), adding margin of safety
• IV stable → theta decay benefits seller
• Acts as support-level hold strategy in case of mild retracement
________________________________________________________________________________
3️⃣ Strategy Trade (As per trend + OI data)
Strategy: Bull Call Spread → Buy 5700 CE / Sell 5800 CE
→ ₹60.75 / ₹34.15
Net Debit: ₹26.60
Max Profit: ₹100 (spread width) – ₹26.60 = ₹73.40
Max Loss: ₹26.60
Risk:Reward ≈ 1 : 2.75 ✅
Lot Size: 150
Total Risk: ₹3,990
Max Profit: ₹11,010
📊 Breakeven Point: ₹5726.60
📉 Reversal Exit Level: Exit if Spot < ₹5550 (invalidates breakout + weakens CE 5700)
________________________________________________________________________________
Why:
• Strong Long Build-Up at 5700 CE, resistance only mild at 5800
• High IVs make selling 5800 CE favourable → lowers net debit
• Defined risk with RR ≈ 1:2.75 fits your trade rule
• Market supports bullish continuation over 5600-5650 levels
________________________________________________________________________________
📘 My Trading Setup Rules
Avoid Gap Plays
→ Check pre-open price action to avoid trades influenced by gap-ups/gap-downs.
Breakout Entry Only
→ Enter trades only if price breaks previous day’s High (for bullish trades) or Low (for bearish trades).
Watch Volume for Confirmation
→ Monitor volume closely. No volume = No trade.
Enter on Strong Candle + Volume
→ Execute the trade only if a strong candle appears with increasing volume in the direction of the trade.
Defined Risk:Reward Only
→ Take trades only if R:R is favourable (ideally ≥ 1:2)(safe = 1:1).
Premium Disclaimer
→ Option premiums shown are based on EOD prices — real-time premiums may vary during execution.
Time Frame Preference
→ Trade with your preferred time frame — this strategy works across intraday or positional setups.
________________________________________________________________________________
⚠ Disclaimer (Please Read):
• These Trades are shared for educational purposes only and is not investment advice.
• I am not a SEBI-registered advisor.
• The information provided here is based on personal market observation.
• No buy/sell recommendations are being made.
• Please do your own research or consult a registered financial advisor before making any trading decisions.
• Trading involves risk. Always use proper risk management.
I am not responsible for trading decisions based on this post.
________________________________________________________________________________
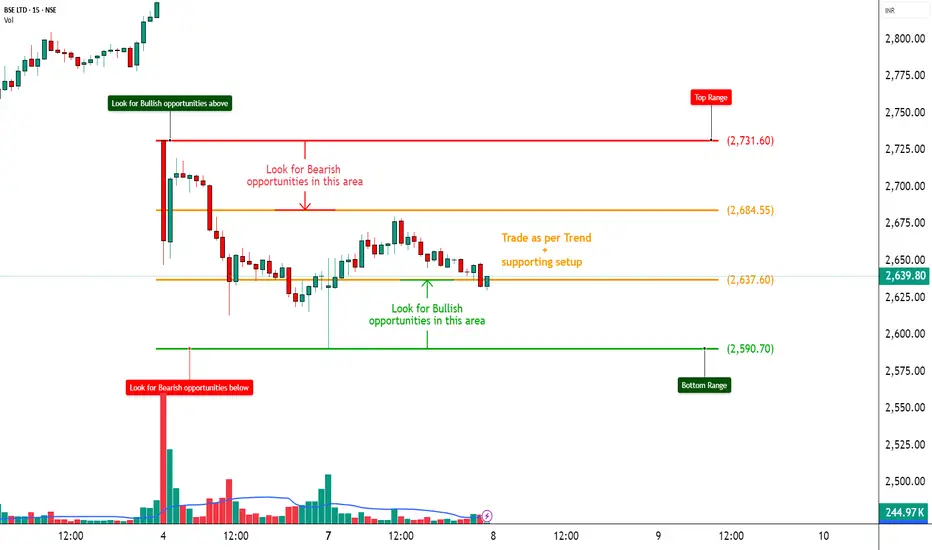
BSE – Heavy Call Writing Indicates Resistance Ahead________________________________________
📈 BSE – Heavy Call Writing Indicates Resistance Ahead | OI + Price Action Analysis
🕒 Chart Type: 15-Minute
📆 Date: July 7, 2025
________________________________________
🔍 What’s Catching Our Eye:
BSE is trading near ₹2636, and the Option Chain is showing aggressive Short Build-Up on Calls from 2650 to 3000, clearly highlighting a resistance zone above current price. Meanwhile, Put writers are unwinding, especially at ₹2600 PE, confirming weak bullish conviction. Traders are playing defensively with bearish bias dominating.
________________________________________
📌 What We’re Watching For:
If BSE breaks below ₹2600, we may see a quick slide toward ₹2550–2500. However, a sharp breakout above ₹2700 with strong volume may trigger a round of short-covering. Until then, upside looks capped due to excessive Call writing.
________________________________________
📊 Volume Footprint:
Options activity is backed by strong volume —
• Over 8.9k contracts at ₹2700 CE
• Over 8.1k contracts at ₹2800 CE
• Over 7k contracts at ₹3000 CE
→ Traders are betting on price staying below 2700–2800 levels, creating a strong supply wall.
________________________________________
📈 Option Chain Highlights:
• Calls (Short Build-Up):
o ₹2700 CE: +81,375 OI | Price ↓ 8.82%
o ₹2800 CE: +18,375 OI | Price ↓ 11.07%
o ₹3000 CE: +77,250 OI | Price ↓ 16.60%
o ₹2650 CE: +38,250 OI | Price ↓ 8.01%
• Puts:
o ₹2600 PE: -42,375 OI | Price ↓ 10.94% → Long Unwinding
o ₹2500 PE: +102,375 OI | Price ↓ 16.55% → Short Build-Up
📌 Inference:
Bulls are on the back foot. CE writers are dominating across all key strikes, and only the 2500 PE is showing fresh interest — which is far from spot, indicating potential room for further downside.
________________________________________
🔁 Trend Bias:
🔴 Bearish to Neutral – Unless 2700 breaks cleanly
________________________________________
🧠 Trade Logic / Reasoning:
Every CE strike from ATM to OTM is under short build-up — that's a clear ceiling forming. With no visible strength in Put writing near spot, the path of least resistance appears to be on the downside. Keep a close eye on ₹2600.
________________________________________
📍 Important Levels to Mark:
🔺 Top Range (Resistance): ₹2731.60
🔻 Bottom Range (Support): ₹2590.70
________________________________________
🎯 Trade Plan (Educational Purpose Only):
✅ Best Buy (Equity): Only if BSE crosses ₹2700 with volume
✅ Best Sell (Equity): Below ₹2600 for target ₹2550–2500
✅ Best CE to Long: ❌ None – All major Calls under Short Build-Up
✅ Best PE to Long: ₹2500 PE – Showing fresh bearish positioning
🟢 Demand Zone: NA
🔴 Supply Zone: NA
⚠️ Invalidation Below:
Bullish view invalidated if price sustains below ₹2600
________________________________________
⚠️ Disclaimer:
This analysis is for educational purposes only.
STWP is not a SEBI-registered advisor.
No buy/sell recommendations are made.
Please consult your financial advisor before trading.
STWP is not responsible for trading decisions based on this post.
________________________________________
💬 Spotting the weakness early helps plan smarter.
What’s your view on BSE – comment below ⬇️
🔁 Share this if you're tracking BSE this week
✅ Follow STWP for clean price + OI based setups
🚀 Be Self-Reliant | Trade with Patience | Learn with Logic
________________________________________
How to Trade Nifty Weekly Expiry with OI Shift Setup!Hello Traders!
Weekly expiry in Nifty is full of quick moves, sharp reversals, and big traps. To stay ahead of the curve, you need to track where the real money is moving — and that’s where the OI Shift Setup (Open Interest Shift) comes in. This simple but powerful method helps you read the options data live and take trades with strong conviction.
What is OI Shift?
OI (Open Interest): It shows where option writers are building or exiting positions. A sudden spike or unwinding can signal a shift in sentiment.
Shift in Support & Resistance: When Put writers shift to higher strikes and Call writers shift lower , it tells you the market range is changing.
Live Clues from Smart Money: This gives you an edge in real-time — letting you ride the move before it becomes obvious.
How to Use the OI Shift Setup on Expiry Day
Step 1 – Watch 15-Min Option Chain Updates: Look for sudden changes in highest OI build-up or unwinding.
Step 2 – Identify the Range Shift:
Example – If 22,000 PE OI drops and 22,100 PE OI rises, support has shifted up = bullish signal.
Step 3 – Combine with Price Action: Breakout from VWAP, range, or previous day high/low = confirmation.
Step 4 – Take Entry with SL Below Breakout Candle: Ride the momentum but stay risk-managed.
When This Setup Works Best
During 9:30 AM – 12:30 PM: Fresh OI gives early trend signs.
During Range Breakouts: Especially when new OI builds just before the breakout.
During Reversal Traps: If OI shifts opposite to price move, expect a false breakout and trap.
Rahul’s Tip
Let OI shift be your expiry compass. It’s not about predicting – it’s about reading the market in real-time. React smartly and follow the flow.
Conclusion
The OI Shift Setup is a must-know tool for expiry traders. Once you master how to spot range shifts through live OI data and combine it with price action, your expiry trading will become much more strategic and consistent.
Have you tried trading with OI shifts? Let’s discuss in the comments below!
