Support Breakdown Excepted in JIOFINThe idea shown in this TradingView chart is a strategy based on a support breakdown in Jio Financial Services Limited (JIOFIN), coupled with a position in its associated put option for further downside protection and potential profit.
Support Breakdown Concept
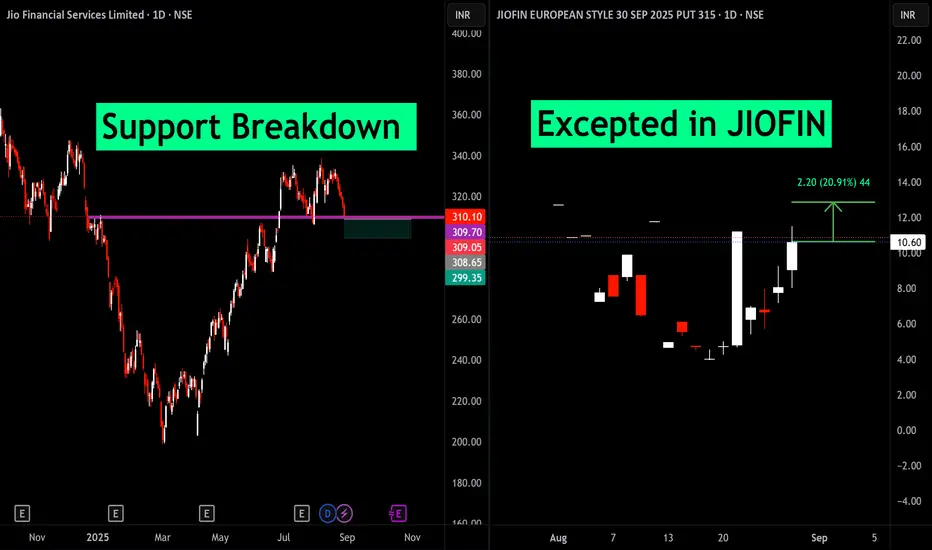
The left side of the chart highlights a horizontal support level that has been tested multiple times and subsequently broken by the recent price action.
A support breakdown typically signals bearish sentiment; traders expect further decline after such a technical event.
This setup is classified as a short or sell signal for JIOFIN shares as long as price remains below the broken support.
Put Option Reaction
On the right, the chart shows JIOFIN’s 315 European Style Put Option expiring in September 2025.
The put option price has surged (up 31.68%) in response to the underlying stock’s breakdown, reflecting increased demand for downside protection and speculative profit.
Options traders might buy puts to profit from further decline or hedge against losses in the underlying stock.
Trading View Idea Summary
JIOFIN’s support breakdown signals potential further downside in the stock.
The associated put option sees buying interest, aligning with bearish expectations.
This is a classic technical-plus-derivatives strategy often used in active trading: combine chart-based signals with options to amplify or hedge results.
Optionsanalysis
NIFTY 50 13-07-2021 AnalysisSo Nifty 50 is looking very bullish and it can also give a gap up opening because of some factors that I will tell you. these are;
1. There is a perfect green hammer in the weekly chart and the daily chart as well.
2. After analyzing the option chain we saw that the call writers exited their shorts in huge and amount and their is a short buildup heavily on the bullish side.
3. The PCR is 0.8 which is also indicating a slight oversold market.
4. The nifty has gave a great closing of above the dangerous level of 15800 which is a very bullish sign.
Now there is no major support or resistance levels in the market and the view is highly bullish.
.
.
.
.
.
.
.
.
.
.
.
.
.
.
*Disclaimer*- This is just an analysis of the data on the basis of technical factors such as chart patterns, candlestick patterns, trend line , option chain data, etc,. Stock Market or Trading in any type of market is subject to high financial risk. You should see this idea as just an analysis. You are not obliged to follow my instructions. You will be responsible for all types gains or loses in the market.
