Institution Option Trading📌 1. Multi-leg Strategic Trades
Institutions rarely take single-leg naked options. They use advanced setups like:
✅ Vertical Spreads (Bull Call / Bear Put)
✅ Iron Condor / Iron Butterfly
✅ Calendar / Diagonal Spreads
✅ Ratio Spreads
✅ Box Spreads (riskless arbitrage)
These strategies offer:
Defined risk
Better reward-to-risk ratios
Controlled exposure to market direction and volatility
📌 2. Delta Hedging
Institutions holding large stock or futures positions hedge delta using options.
For example:
Holding ₹50 crore worth of Reliance shares
Buy Reliance PUT options to protect against fall
Or, dynamically sell call options as price rises to adjust exposure
This is called Delta Hedging, and it’s done in real-time using algorithms.
📌 3. Open Interest (OI) Tracking
Institutions use option chain OI to:
Spot support/resistance based on strike activity
Identify traps and short-covering zones
Detect institutional presence via unusual OI spikes
For example:
Sudden OI surge at 22,000 PE in Bank Nifty
Might indicate put writers protecting downside, expecting reversal
📌 4. Time Decay (Theta) Exploitation
Institutions are the real beneficiaries of theta decay.
They sell options (straddles, strangles, spreads) around key levels (like VWAP, CPR) and let time decay eat the premium.
Especially on:
Expiry day (Thursday in India)
After big moves
In range-bound markets
They deploy millions of rupees in premium-selling strategies to generate daily/weekly returns.
🔶 Institutional Option Strategies Explained
Let’s break down some common institutional strategies in real terms:
🔷 1. Short Straddle
Sell ATM Call and ATM Put at same strike
Works in sideways markets
Profits from time decay and low movement
✅ Used heavily by institutions on weekly expiry
✅ Risk: Sharp move in either direction
🔷 2. Bull Call Spread
Buy a lower strike Call
Sell a higher strike Call
Lower cost, limited risk & reward
✅ Used when institutions expect moderate bullish move
✅ Controlled exposure + reduced premium
🔷 3. Iron Condor
Sell OTM Call & Put
Buy further OTM Call & Put
Net credit strategy with limited risk
✅ Best in low volatility, non-trending markets
✅ Profitable if market stays between two levels
🔷 4. Calendar Spread
Sell near-term option
Buy far-month option (same strike)
Used when:
Near-term IV is high
Long-term view is neutral or unclear
✅ Profits from IV difference and time decay advantage
🔷 5. Protective Put
Holding equity or futures
Buy Put Option to insure position
Institutions use this to hedge large portfolios during high uncertainty (e.g., elections, war threats, Fed rate decisions)
🔶 Real Example – How an Institution Trades Nifty Options
Let’s say Nifty is at 22,000.
📊 Scenario:
IV is high
No major event ahead
OI buildup seen at 22000 PE and 22100 CE
📈 Institutional Strategy:
Sell 22000 PE and 22100 CE (Short Straddle)
Buy 21900 PE and 22200 CE (hedge legs)
Result:
If Nifty stays in range → theta decay = profit
If it breaks out → hedge legs protect loss
✅ Low-risk, smart premium capture strategy
🔶 Key Tools Institutions Use in Options Trading
Bloomberg Terminal (real-time global data)
Opstra / Sensibull / QuantsApp (for Greek/OI analysis)
Option Vega/IV scanners
Algo trading engines
Python/R-based custom backtesting engines
Retail traders can start by using TradingView + Sensibull/Opstra.
🔶 How to Learn Institutional Options Trading?
Here’s a step-by-step approach:
✅ Understand Options Basics – Calls, Puts, Moneyness
✅ Study Greeks Deeply – Delta, Theta, Vega, Gamma
✅ Learn Option Chain Analysis – OI, IV, Max Pain
✅ Explore Spreads & Multi-leg Setups
✅ Practice Risk Management & Position Sizing
✅ Track Institutional Behavior via OI shifts & volume
✅ Backtest Your Strategy before going live
🔶 Final Takeaways
Institutional Options Trading is not about guessing. It’s about data, structure, and risk.
Retail traders who try to copy institutions without understanding their objectives often get trapped.
But if you:
Study Smart Money behavior
Use strategic entries based on volume + volatility
Respect risk and capital preservation
…you can trade with the institutions, not against them.
Optionsstrategies

Institution Option Trading🏢 Who Are These Institutions?
Institutions involved in option trading include:
🏦 Hedge Funds
🏢 Proprietary (Prop) Trading Firms
💼 Investment Banks
🌍 FIIs/DIIs
🧠 Pension Funds & Insurance Companies
They trade options across equities, indices (like Nifty/Bank Nifty), commodities, and currencies, often managing portfolios worth hundreds of crores.
🔍 Institutional Option Trading Strategies
1. Delta Neutral Strategy (Market-Neutral)
Example: Sell ATM straddle and hedge with futures.
Objective: Profit from time decay (theta) while keeping position neutral to price movement.
2. Volatility Arbitrage
Institutions bet on difference between implied and actual volatility.
Buy options when IV is low, sell when IV is high.
3. Calendar Spreads
Sell near expiry option, buy longer expiry of the same strike.
Used when institutions expect IV to rise but minimal short-term price movement.
4. Iron Condors and Butterflies
Multi-leg strategies for range-bound markets.
Used with large capital to generate steady income with limited risk.
5. Protective Puts / Covered Calls
Portfolio hedging: buy puts to protect against downturns, sell calls to earn extra income.
Very common among mutual funds and long-term portfolios.
📈 Option Chain Reading – Institutional Footprint
When institutions enter or adjust option positions, they leave footprints in the option chain. You can spot them by watching:
Sudden spike in OI (Open Interest) at specific strikes
Sharp rise in IV without much price movement
Heavy Put or Call writing near resistance/support zones
Unusual option activity (UOA) before key events
⚠️ How Retail Traders Can Learn From Institutional Option Trading
Track Option Chain + OI Changes Daily
Learn to Read Greeks Before Taking a Trade
Watch How IV Shifts Before & After Events
Backtest Simple Institutional Strategies (e.g. ATM Straddles)
Focus on Consistency and Capital Protection
🛑 Common Retail Mistakes in Options (Avoided by Institutions)
Buying deep OTM options blindly
Overtrading in low-volume strikes
Selling naked options without hedge
Ignoring IV or theta decay
Trading without stop-loss or adjustment plans
🧘 Conclusion: Why Mastering Institutional Option Trading Matters
Understanding how institutions trade options allows you to:
✅ Avoid emotional traps
✅ Trade with the flow of smart money
✅ Use real risk management
✅ Build income and protection strategies
✅ Improve win-rate and longevity in trading

Macro + Rate-Sensitive Asset Trading✅ What is Macro + Rate-Sensitive Asset Trading?
In basic terms:
Macro Trading is trading based on big picture economic trends — like inflation, interest rates, GDP growth, central bank policies, and geopolitical risks.
Rate-Sensitive Asset Trading focuses on those assets that react strongly when interest rates change, like:
Government bonds
Bank stocks
Real estate investment trusts (REITs)
Gold
Growth tech stocks
Commodities
Currency pairs (like USD/INR, EUR/USD)
Together, macro and rate-sensitive asset trading means analyzing global and national economic data to predict movements in specific assets and sectors.
🧠 Why is This So Important?
Because big players (FII, DII, Hedge Funds) move billions of dollars based on these macro themes.
Imagine this:
If inflation spikes → Central bank may raise interest rates
If rates go up → Bond yields rise → Bank profits rise
At the same time → Real estate slows down, gold may fall, tech stocks may suffer
And the currency (like USD or INR) may strengthen or weaken
As a trader, understanding these domino effects lets you ride big, high-conviction trades that can last for days, weeks, or even months.
🏛️ Who Controls Interest Rates?
Central banks — like the Federal Reserve (USA) or RBI (India) — adjust interest rates to control inflation and support economic growth.
Rate Hike = Borrowing becomes expensive = Slows the economy
Rate Cut = Borrowing becomes cheaper = Boosts growth
Market participants react even to expectations of these changes.
So, successful traders often read between the lines of central bank speeches, economic releases, and policy statements.
🧮 Examples of Rate-Sensitive Assets
Let’s break them down one by one:
1. Banking Stocks (HDFC Bank, ICICI Bank, SBI, Axis)
Banks make more profit when interest rates are high.
They charge more on loans and earn better margins.
So, when the RBI hikes rates, banking stocks usually go up.
📈 Trade Idea: Buy banking stocks on rate hike expectations, especially when inflation is rising.
2. Bonds and Bond Yields
Bond prices move inversely to interest rates.
When rates go up, bond prices go down, and yields go up.
Traders use this to position in debt instruments or short-duration bonds.
📉 Trade Idea: Short long-duration bonds when interest rates are expected to rise.
3. Gold and Silver
Gold is a non-interest-bearing asset.
When rates rise, bonds become more attractive → People shift from gold to fixed income → Gold falls
But during high inflation or crisis, gold can also rise as a hedge.
⚖️ Trade Idea: If real interest rates (adjusted for inflation) rise → Sell gold. If inflation is rising faster than rates → Buy gold.
4. Tech and Growth Stocks (Rate-Sensitive Equities)
High-growth companies (like tech startups or innovation companies) often rely on borrowing.
Rising interest rates increase their cost of capital.
This can compress future profits, and stock prices fall.
📉 Trade Idea: Avoid high-P/E or growth stocks during rising rate cycles. Favor value or dividend-paying stocks.
5. Real Estate / REITs
Real estate is interest-rate sensitive because home loans, EMIs, and mortgages get costlier.
When rates rise, property demand slows, and REITs (real estate investment trusts) fall.
📉 Trade Idea: Short REITs or reduce allocation during rate hike cycles.
6. Currency Pairs (Forex)
When a country hikes rates, its currency becomes stronger because it offers better returns to foreign investors.
For example, if the US Fed raises rates, the USD strengthens against INR, EUR, JPY, etc.
📈 Trade Idea: Go long on USD/INR or USD/JPY when Fed is expected to hike.
📌 How Traders Use This Information (Practical Steps)
Step 1: Develop a Macro View
Ask: Is the global economy growing or slowing?
Is inflation rising or under control?
What are central banks signaling?
Step 2: Find Asset Classes That React
If inflation rising → Buy banks, sell bonds and gold
If growth slowing → Buy bonds, sell cyclicals, maybe gold
Step 3: Time Your Entry with Technicals
Use charts (e.g., TradingView) to find good levels to enter.
Look for breakout or pullback entries.
Step 4: Manage Risk
Macro trades can move fast and big.
Always use stop losses and size your position smartly.
🧠 Pro Tips From Institutional Traders
Macro moves are slow but deep.
These trades often play out over days or weeks. Be patient.
Market moves on expectations, not news.
Price reacts before the news comes out. Get in early.
Central banks don’t always do what they say.
Learn to interpret tone, not just statements.
Watch global flows.
US rate hikes can affect Indian markets. Always zoom out.
Be aware of cycles.
Every asset class has cycles. Learn when each one outperforms.
⚠️ Risks of Macro and Rate-Sensitive Trading
Data surprises can flip the market instantly
Correlations can break (e.g., gold going up with rates)
Over-trading on news can lead to losses
Requires understanding of multiple asset classes
Long holding periods may tie up capital
📈 Real-Life Example: RBI Hike Cycle in India
Let’s say inflation in India is rising fast — food prices, fuel, etc.
RBI responds by:
Raising repo rates from 6.5% to 7.0%
Goal: Slow down spending and borrowing
What happens?
Banks rally → Nifty Bank goes up
Bonds fall → 10-year yield rises
Real estate cools off
Gold weakens if INR strengthens
Tech stocks underperform
A smart trader could:
Go long on Bank Nifty Futures
Short REITs or real estate stocks
Exit tech or auto sector temporarily
This is a textbook example of macro + rate-sensitive trading in action.
📚 Final Thoughts: Is This For You?
Macro trading with rate-sensitive assets is not for absolute beginners, but it is a powerful approach for intermediate and advanced traders.
✅ Advantages:
Big moves with logic behind them
Insight into how institutions think
Ability to diversify across assets
Institutional Trading StrategiesWhat is Institutional Trading?
Institutional trading means the buying and selling of stocks, futures, options, and other financial instruments by large organizations. These organizations are often:
Mutual Funds
Pension Funds
Hedge Funds
Banks and Insurance Companies
Foreign Institutional Investors (FII)
Domestic Institutional Investors (DII)
Unlike retail traders who trade with small amounts of capital, institutional players move huge sums of money, sometimes trading in crores or billions in a single day.
Why Do Institutions Trade Differently?
Institutions have massive capital, so their approach is completely different:
They can’t enter or exit a stock quickly without moving its price.
They focus more on long-term positions or large short-term trades.
They use advanced tools like algorithms, high-frequency trading, and exclusive market data.
In simple words: they trade like whales in the ocean, while retail traders are like small fish.
Core Institutional Trading Strategies Explained
1. Order Flow and Volume Analysis
Institutions often leave their footprint in the market by how much they buy or sell. This is visible through volume spikes and order flow. Retail traders can track this by:
Watching unusual volume on a stock
Monitoring delivery percentage (for cash segment)
Using indicators like VWAP (Volume Weighted Average Price) to see where large trades are happening
Institutions use volume as a key indicator because when big money flows in, prices generally follow.
2. Order Block and Supply-Demand Zones
Institutions don’t buy stocks in one go. They accumulate positions slowly within certain price ranges. These areas are called:
Order Blocks – zones where large buying or selling has happened in the past.
Supply-Demand Zones – areas where the market reacts due to prior institutional activity.
When price comes back to these zones, you will often see a strong bounce (demand) or rejection (supply).
3. Breakout and False Breakout Manipulation
Institutions are masters of manipulation. They often cause:
False Breakouts to trap retail traders.
Breakdown traps to collect positions cheaply.
You will see prices breaking key levels (like support or resistance), triggering retail stop losses, and then reversing sharply. Institutions use liquidity from these retail stop losses to enter or exit positions.
4. Volume Weighted Average Price (VWAP) Strategy
Most institutions benchmark their trades around VWAP.
When prices are above VWAP, the bias is bullish.
When prices are below VWAP, the bias is bearish.
Institutions often buy when price retraces to VWAP after a breakout and sell when it tests VWAP after a breakdown. VWAP acts like a fair value line for many large traders.
5. Liquidity Hunting and Stop Loss Fishing
Institutions need liquidity to place large orders. So they create fake moves:
Push prices higher to make retail buy, then sell into it.
Push prices lower to trigger retail stop-losses and then reverse the price upwards.
This is why retail traders often feel the market is “hitting my stop-loss and then moving in my direction”.
6. Options Data Analysis
Institutions hedge their cash and futures positions using options:
High Open Interest (OI) at certain strike prices indicates important levels.
Sudden OI build-up can show institutional call writing (bearish) or put writing (bullish).
Institutions use Option Selling strategies because time decay (theta) works in their favor.
Retail traders can track option data to understand institutional bias, especially around expiry.
7. Algorithmic Trading (Algo Trading)
Institutions use computers (algos) to execute trades based on pre-defined rules:
Speed: Algos trade in microseconds.
Precision: No emotions, just system-based entries and exits.
Scalability: Handles thousands of orders simultaneously.
You can’t compete with algos on speed, but you can follow the flow by watching patterns like sudden large candles without news or price bouncing off VWAP repeatedly.
8. Fundamental Catalysts Trading
Institutions also trade based on news, earnings, and economic data:
Positive quarterly results → gradual accumulation before the news
Interest rate changes → repositioning in banking stocks
Government policy changes → entering sectors like infrastructure or defense
They often buy early before the public knows and sell after retail traders start entering.
9. Sector Rotation Strategy
Institutions rotate money between sectors:
Moving from IT to Banks
From FMCG to Auto
From Metal to Pharma
Retail traders get stuck chasing one stock, while institutions follow where big sector money is flowing. You can track sector indices (like Nifty Bank, Nifty Auto) to ride these moves.
10. Index Balancing Strategy
In indices like Nifty 50 or Sensex, institutions adjust portfolios based on:
Index addition/removal
Rebalancing due to quarterly reviews
Passive fund flows
Stock prices often jump or fall sharply around these events, giving smart traders easy trading opportunities.
How to Identify Institutional Activity as a Retail Trader
Look for unusual volume spikes
Watch for rejection or breakout around order blocks
Use VWAP as a guidance tool
Track option chain data before key events
Follow sector rotation via index charts
Watch price-action near important news events
Practical Tips for Retail Traders
Trade less, trade better: Institutions don’t chase every small move, neither should you.
Wait for confirmation: Let institutions show their hand through volume before entering.
Avoid emotional trades: The market is designed to make you emotional — don’t fall for it.
Risk management is king: Institutions have risk teams; you must use stop-loss.
Never blindly follow tips: By the time you hear news, institutions are already in or out.
Why Institutional Strategies Work Better
Institutions follow a data-driven approach backed by:
Risk management policies
Trained analysts
Large capital to manage volatility
No emotional trading
Use of technology (Algos)
Retail traders who respect market structure and trade alongside institutions improve their win rate dramatically.
Final Thoughts
Institutional Trading is all about structure, discipline, and patience. It’s not about guessing but about observing market behavior — where are the big players active? Why is volume rising? Where is liquidity flowing?
You don’t need huge capital to benefit from institutional strategies. You simply need to follow the footprints, avoid traps, and focus on high-probability trades.
Sensex 1D Timeframe
📈 Sensex (BSE 30) Today’s Overview (1D Time Frame)
Opening Level: Sensex opened higher around 82,350 to 82,500 points, continuing the positive momentum from previous sessions.
Intraday High: Reached around 82,530 in the first half of the session.
Intraday Low: Dropped to approximately 82,170–82,200 in the afternoon session.
Current Trading Range: Mostly trading between 82,200 and 82,500 levels, with a slight upward bias.
Previous Close: Around 82,180–82,200.
Net Change: Trading +0.2% to +0.3% higher, showing slight gains.
🔍 Key Market Drivers Today
Positive Impact:
Strong earnings from banking stocks, especially HDFC Bank and ICICI Bank, are boosting index strength.
Eternal Group (parent of Zomato) surged significantly, adding positivity to market sentiment.
Low volatility today, with India VIX falling, indicating reduced fear in the market.
Negative Impact:
Realty, PSU Banks, and Media sectors underperformed, capping higher gains.
Profit booking seen in auto and pharma stocks, causing minor mid-session dips.
📝 Technical Summary
Trend: Overall uptrend remains intact, with minor intraday corrections.
Support Levels: Immediate support around 82,170–82,200 zone.
Resistance Levels: Strong resistance around 82,500–82,550, breakout beyond which could take Sensex toward 83,000.
Volatility: Low volatility suggests possible slow and steady upward movement
✅ Summary Conclusion
Today, Sensex is mildly positive, driven by financial sector strength and earnings momentum. Some sector rotation is visible with pockets of weakness in PSU and Realty stocks. Volatility remains low, supporting a controlled trading session with limited intraday swings.

Nifty 1D Timeframe📈 Nifty 50 – Market Overview
Opening Level: Nifty 50 opened positive above 25,100, continuing momentum from the previous session.
Intraday High: Touched around 25,166 during the early session.
Intraday Low: Hovered around 25,111 in the later session.
Current Range: Mostly trading between 25,110 to 25,160, with a slight upward bias.
Previous Close: Around 25,090.
Current Gains: Around +0.1% to +0.3% for the day.
🔍 What’s Driving Nifty Today
Banking Sector Strength: Strong performance from HDFC Bank, ICICI Bank, and other financial stocks lifted the index.
Quick Commerce Rally: Companies like Eternal (Zomato parent) showed double-digit gains, adding upward pressure.
Volatility Decline: The India VIX dropped nearly 3%, suggesting reduced market fear and more stable price action.
Mid-Session Profit Booking: Sectors like Realty, Pharma, and Media witnessed some selling, causing small dips during the day.
📊 Technical Snapshot
Support Level: Immediate support seen around 25,100, below which the next strong zone is around 24,950.
Resistance Level: Strong resistance around 25,160–25,200, with breakout potential toward 25,300–25,400 if breached.
Trend Outlook: The market is holding a bullish tone, with minor intraday corrections typical in a trending market.
💡 Traders’ Perspective
Direction Trigger Level Expected Move
Bullish Scenario Above 25,166–25,200 Target next zone between 25,300–25,400
Neutral/Range-bound Between 25,100–25,160 Choppy movement, watch sector rotation
Bearish Scenario Below 25,100 Possible quick slide toward 24,950–25,000
✅ Summary
Today’s session on Nifty 50 shows mild positivity driven by financial stocks and quick-commerce momentum. The market remains range-bound near recent highs, with sectors like realty and pharma underperforming. The index is showing strength above 25,100, and a breakout above 25,200 could lead to further upside in the coming days
Technical Class📊 Technical Class — Complete Guide for Technical Trading
A Technical Class is focused on teaching traders how to analyze price action, chart patterns, indicators, and market behavior using technical analysis. This class is ideal for beginners and intermediate traders who want to understand how to make trading decisions based purely on market charts — without needing insider news or fundamentals.
✅ What is Technical Trading?
Technical trading means you:
Read the charts to find trading opportunities.
Use price history, patterns, and indicators to predict future price moves.
Do not rely on news, instead focus on what the market shows through charts.
Big traders (institutions) also use technical setups, combined with liquidity and order flow, making technical analysis an essential skill.
📚 What You Will Learn in a Technical Class
1. Chart Basics
Candlestick chart vs Line chart vs Bar chart
Timeframes: from 1 minute to monthly
Volume and market sessions
2. Candlestick Patterns
Reversal Patterns: Pin Bar, Engulfing, Morning Star, Evening Star
Continuation Patterns: Inside Bar, Flags, Pennants
Indecision Candles: Doji, Spinning Top
3. Support & Resistance
How to draw key support/resistance levels
Identifying key zones where price reacts
Turning resistance into support (flip zones)
4. Trend Trading Techniques
Recognizing Higher Highs and Higher Lows (uptrend)
Spotting Lower Highs and Lower Lows (downtrend)
Using Trendlines effectively
5. Indicators Used by Pros
Moving Averages (MA) — 50 EMA, 200 EMA for trend
RSI — Overbought/Oversold zones
MACD — Trend and momentum detection
Fibonacci Retracement — Spotting pullback levels
Volume Profile — Finding high-volume zones
6. Chart Patterns
Double Top/Bottom, Head & Shoulders, Triangles
Breakout Strategies — entering after confirmation
Fakeouts and Trap Patterns
7. Risk Management & Psychology
Setting proper Stop Loss (SL) and Take Profit (TP)
Position sizing: how much to risk per trade
Building discipline and patience like a pro trader.
🎯 Benefits of Learning Technical Trading
✅ Trade any market: Forex, Stocks, Crypto, Commodities
✅ Become an independent trader — no reliance on signals
✅ Combine with institutional concepts for Smart Money Trading
✅ Understand why market moves and avoid beginner mistakes
✅ Build a professional mindset with proper risk management
🎓 After Completing Technical Class You Will Be Able To:
Analyze any chart professionally
Trade with higher win-rate setups
Control risk like institutional traders
Identify market traps and avoid fakeouts
Grow your account safely with discipline + strategy.

HDFCBANK – Bullish Potential Post Results, But OI Shows Bearish________________________________________________________________________________📈 HDFCBANK – Bullish Potential Post Results, But OI Shows Bearish Overhang
📅 Setup Date: 17.07.2025 | ⏱ Timeframe: Daily
📍 Strategy: Post-Earnings Reaction Play with Mixed Sentiment in Options
________________________________________________________________________________
🔍 Overall View
Spot Price: ₹1957.4
Trend: Mixed – Strong Q1 results (profit ↑12%, bonus/dividend declared), but price action weak
Volatility: High IVs — Calls ~23–25%, Puts ~29–32% → post-result event premium still elevated
Ideal Strategy Mix: Neutral-to-bullish spreads with defined risk or post-IV crush contrarian longs
________________________________________________________________________________
1️⃣ Bullish Trade (Contrarian Setup with Fundamental Trigger)
Best CE: Buy 1980 CE @ ₹24.2
Why:
• Strong earnings + corporate action (bonus/dividend) → triggers potential sentiment reversal
• CE 1980 saw Short Build-Up (+144% OI), premium ↓25% → ideal for short-covering setup
• Delta ~0.41 with high IV (~24.3%) → moderate leverage & gamma in case of price breakout
• Use only if price breaks and sustains above ₹1975 with strong candle + volume
________________________________________________________________________________
2️⃣ Bearish Trade (Trend Following)
Best PE: Sell 1900 PE @ ₹16.65
Why:
• PE 1900 saw massive Long Build-Up (+70%) but IV surged → may now face decay pressure
• Selling this deep OTM PE gives ~₹57 buffer from spot (≈3% downside cushion)
• Post-results, downside may be limited → good candidate to play post-IV crush
• Spot stability around 1950–1960 invalidates aggressive downside
________________________________________________________________________________
3️⃣ Strategy Trade (Defined Risk Based on Mixed Setup)
Strategy: Bull Call Spread → Buy 1980 CE / Sell 2020 CE
→ ₹24.2 / ₹10.7
Net Debit: ₹13.50
Max Profit: ₹40 (spread width) – ₹13.5 = ₹26.5
Max Loss: ₹13.50
Risk:Reward: ≈ 1 : 1.96 ✅
Lot Size: 550
Total Risk: ₹7,425
Max Profit: ₹14,575
📊 Breakeven Point: ₹1993.5
📉 Reversal Exit Level: Exit if Spot < ₹1940 (invalidates breakout + earnings move fade)
________________________________________________________________________________
Why:
• Bullish news (Q1 beat, bonus/dividend) could trigger CE short covering if price moves above 1980
• Limited risk strategy — works well if post-result rally is moderate
• High IVs favour spread over naked options (caps loss from premium crush)
• CE OI from 1960–2060 mostly short → if momentum picks up, rally could be fast
________________________________________________________________________________
📘 My Trading Setup Rules
Avoid Gap Plays
→ Check pre-open price action to avoid trades influenced by gap-ups/gap-downs.
Breakout Entry Only
→ Enter trades only if price breaks previous day’s High (for bullish trades) or Low (for bearish trades).
Watch Volume for Confirmation
→ Monitor volume closely. No volume = No trade.
Enter on Strong Candle + Volume
→ Execute the trade only if a strong candle appears with increasing volume in the direction of the trade.
Defined Risk:Reward Only
→ Take trades only if R:R is favourable (ideally ≥ 1:2).
Premium Disclaimer
→ Option premiums shown are based on EOD prices — real-time premiums may vary during execution.
Time Frame Preference
→ Trade with your preferred time frame — this strategy works across intraday or positional setups.
________________________________________________________________________________
⚠ Disclaimer (Please Read):
• These Trades are shared for educational purposes only and is not investment advice.
• I am not a SEBI-registered advisor.
• The information provided here is based on personal market observation.
• No buy/sell recommendations are being made.
• Please do your own research or consult a registered financial advisor before making any trading decisions.
• Trading involves risk. Always use proper risk management.
I am not responsible for trading decisions based on this post.
________________________________________________________________________________

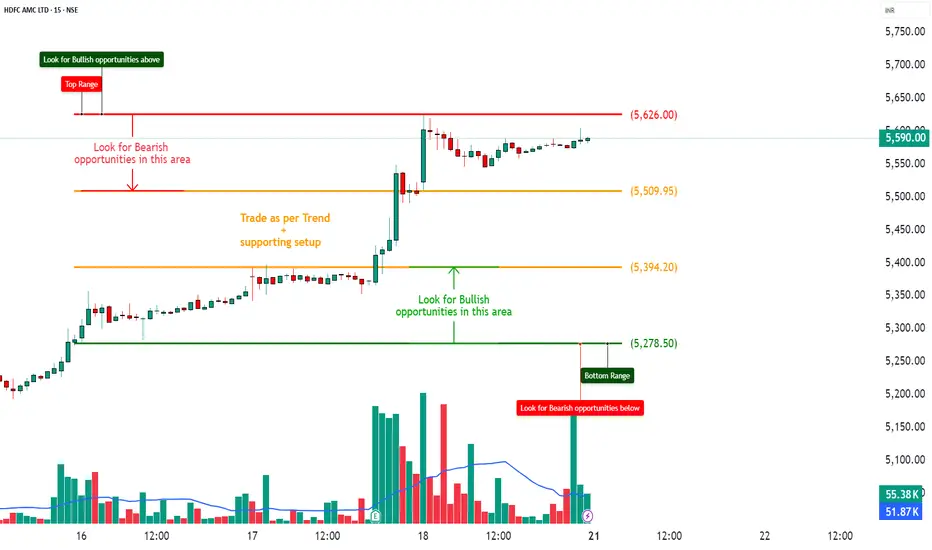
HDFCAMC – Bullish Momentum with Short Covering Base________________________________________________________________________________📈 HDFCAMC – Bullish Momentum with Short Covering Base
📅 Setup Date: 18.07.2025 | ⏱ Timeframe: Daily
📍 Strategy: Momentum Trade Setup with Defined Risk
________________________________________________________________________________
🔍 Overall View
Spot Price: ₹5590
Trend: Bullish Bias – Price sustaining above 5500 with momentum
Volatility: IV ~26–29%, relatively stable with mild contraction
Ideal Strategy Mix: Directional long with partial risk spreads
________________________________________________________________________________
1️⃣ Bullish Trade (Naked options as per trend)
Best CE: Buy 5700 CE @ ₹60.75
Why:
• Long Build-Up (+11.91% OI) with price ↑6.49% = bullish conviction
• Strike just ₹110 above spot → good balance of delta (0.41) and premium
• High TTV (₹89.9 Cr) and stable IV (~26.6%) → institutional activity
• CE 5600 also active, but 5700 is cleaner structure due to fresh longs
________________________________________________________________________________
2️⃣ Bearish Trade (Contrarian Trade – if present)
Best PE: Sell 5500 PE @ ₹59.5
Why:
• Short Build-Up on 5500 PE (+118.7% OI), but price ↓45.84% → strong put writing
• Spot comfortably above strike (₹5590), adding margin of safety
• IV stable → theta decay benefits seller
• Acts as support-level hold strategy in case of mild retracement
________________________________________________________________________________
3️⃣ Strategy Trade (As per trend + OI data)
Strategy: Bull Call Spread → Buy 5700 CE / Sell 5800 CE
→ ₹60.75 / ₹34.15
Net Debit: ₹26.60
Max Profit: ₹100 (spread width) – ₹26.60 = ₹73.40
Max Loss: ₹26.60
Risk:Reward ≈ 1 : 2.75 ✅
Lot Size: 150
Total Risk: ₹3,990
Max Profit: ₹11,010
📊 Breakeven Point: ₹5726.60
📉 Reversal Exit Level: Exit if Spot < ₹5550 (invalidates breakout + weakens CE 5700)
________________________________________________________________________________
Why:
• Strong Long Build-Up at 5700 CE, resistance only mild at 5800
• High IVs make selling 5800 CE favourable → lowers net debit
• Defined risk with RR ≈ 1:2.75 fits your trade rule
• Market supports bullish continuation over 5600-5650 levels
________________________________________________________________________________
📘 My Trading Setup Rules
Avoid Gap Plays
→ Check pre-open price action to avoid trades influenced by gap-ups/gap-downs.
Breakout Entry Only
→ Enter trades only if price breaks previous day’s High (for bullish trades) or Low (for bearish trades).
Watch Volume for Confirmation
→ Monitor volume closely. No volume = No trade.
Enter on Strong Candle + Volume
→ Execute the trade only if a strong candle appears with increasing volume in the direction of the trade.
Defined Risk:Reward Only
→ Take trades only if R:R is favourable (ideally ≥ 1:2)(safe = 1:1).
Premium Disclaimer
→ Option premiums shown are based on EOD prices — real-time premiums may vary during execution.
Time Frame Preference
→ Trade with your preferred time frame — this strategy works across intraday or positional setups.
________________________________________________________________________________
⚠ Disclaimer (Please Read):
• These Trades are shared for educational purposes only and is not investment advice.
• I am not a SEBI-registered advisor.
• The information provided here is based on personal market observation.
• No buy/sell recommendations are being made.
• Please do your own research or consult a registered financial advisor before making any trading decisions.
• Trading involves risk. Always use proper risk management.
I am not responsible for trading decisions based on this post.
________________________________________________________________________________
Learn Institutional Trading Part-4📌 What is Institutional Trading?
Institutional trading refers to the strategies, mindset, and techniques used by large financial institutions when they participate in the markets. These entities trade with huge volumes and require liquidity, accuracy, and control in their execution.
Unlike retail traders who might buy or sell a few lots or shares, institutions often enter with millions of dollars at a time. If they enter the market carelessly, they would move the price against themselves. Hence, they use highly calculated and strategic methods to enter and exit positions without creating obvious footprints.
These strategies are often referred to as Smart Money Concepts (SMC) — techniques that revolve around price manipulation, liquidity traps, and understanding market structure.
🎯 Why Do You Need to Learn Institutional Trading?
Most retail traders lose because:
They chase price.
They follow lagging indicators.
They get trapped in fake breakouts.
They trade based on emotions, not logic.
Institutional trading flips that mindset. You learn to:
Trade with the big players, not against them.
Identify where the real buying and selling is happening.
Understand why price reverses suddenly — often after retail entries.
Predict market moves based on logic and liquidity, not noise.
By learning how institutions think and act, you become a more disciplined, data-driven trader with higher probability setups and better risk management.
🧠 Core Concepts of Institutional Trading
Let’s dive into the most important concepts every institutional trader must understand:
1. Market Structure
Institutions operate within clear phases of market movement:
Accumulation: Smart money quietly builds positions in a range.
Manipulation: They fake breakouts or induce retail traders to create liquidity.
Expansion: The actual move begins in the intended direction.
Distribution: They offload their positions to late traders before reversing.
If you can identify these phases, you’ll always know where you are in the market — and what’s likely to come next.
2. Liquidity Pools
Liquidity is the fuel institutions need to place trades. They don’t use limit orders like retail traders. Instead, they seek zones with large clusters of stop-losses, pending orders, and breakout trades to enter and exit positions.
These zones are:
Swing highs and lows
Trendline breaks
Support/resistance levels
Retail breakout levels
You’ll often see the market spike into these areas and reverse — that’s not a coincidence. That’s institutional activity.
3. Order Blocks
An order block is a candle (usually bearish or bullish) where institutions placed large orders before a major market move. These zones often act as future supply and demand levels, where price returns to fill orders again.
Order blocks help you:
Identify powerful entry points.
Predict reversals or continuations.
Understand institutional footprints on the chart.
4. Fair Value Gaps (FVG)
A Fair Value Gap is a price imbalance between buyers and sellers — often created when institutions enter with speed and aggression. The market typically returns to fill this gap before continuing the trend.
FVGs are great for:
Entry confirmations
Predicting retracements
Identifying imbalance zones where price is “unfair”
6. Inducement & Mitigation
Inducement: Institutions create fake signals to trick retail traders into entering, generating the liquidity they need.
Mitigation: Institutions revisit previous zones to close old trades or rebalance positions — often creating hidden entries.
These tactics show how institutions intentionally manipulate price to maximize their position efficiency.
📊 Tools Institutional Traders Use
While many retail traders rely heavily on indicators like RSI, MACD, or Bollinger Bands, institutional traders focus more on:
Price action
Volume analysis
Open interest in options/futures
Liquidity maps
Time-based market behavior (sessions: London, NY, Asia)
Their edge comes from understanding what the market is doing, not what an indicator is telling them.
🧱 Institutional Risk Management
Institutions don’t gamble. Every trade is backed by:
Precise entry, stop-loss, and take-profit levels
Predefined risk percentages
Diversification and hedging
Capital allocation rules
They don’t revenge trade. They don’t overtrade. They focus on high-probability setups with calculated risk.
Retail traders can learn from this by:
Sticking to a trading plan
Managing emotions
Risking only a small % of their capital
Focusing on quality over quantity
📈 Institutional Trading in Action (Example)
Let’s say the market has been ranging for 3 days. Suddenly, price spikes up through a resistance level — a breakout! Retail traders jump in long.
But then, within minutes, price reverses sharply downward. Stop-losses are hit. Panic sets in.
What happened?
Institutions induced a breakout, used retail stop-losses as liquidity, filled their short positions, and now the real move — downward expansion — begins.
Understanding this flow helps you trade with the move, not against it.
👨🏫 Who Should Learn Institutional Trading?
This approach is ideal for:
Day traders looking for accurate short-term moves
Swing traders seeking strong trend setups
Options traders who want to align positions with institutional flow
Forex and crypto traders who want to stop chasing signals and start following structure
🚀 Benefits of Learning Institutional Trading
✅ Higher accuracy entries
✅ Better reward-to-risk ratios
✅ Less emotional trading
✅ Deeper understanding of price movement
✅ Freedom from lagging indicators
✅ Long-term trading consistency
🎓 Final Thoughts: Become the Hunter, Not the Hunted
Retail traders are often the prey in a game designed by institutions. But by learning institutional trading, you flip the script. You become the hunter — identifying setups, planning moves, and acting with precision.
Institutional trading is not about being right every time — it's about being strategic, calculated, and aligned with the flow of money

Learn Institutional Trading Part-3🔍 What You'll Learn:
✅ Market Structure Mastery
Understand how price moves through different phases — accumulation, manipulation, expansion, and distribution — and how institutions position themselves at each level.
✅ Order Flow & Liquidity Concepts
Institutions focus on liquidity. Learn how they seek out stop-losses and resting orders to fill large positions without moving the market too much.
✅ Smart Money Concepts
Identify where "smart money" (institutional money) is entering and exiting the market using tools like:
Fair Value Gaps (FVG)
Order Blocks
Breaker Blocks
Liquidity Pools
Inducement and Mitigation zones
✅ Volume & Open Interest Analysis
Discover how volume analysis and options open interest reveal institutional footprints in futures and options markets.
✅ Institutional Risk Management
Learn how institutions manage massive portfolios with strict risk control, position sizing, and hedging techniques.
✅ High Probability Trade Setups
Master trade setups based on institutional logic — including trap setups, liquidity grabs, and imbalance trades — with better reward-to-risk ratios.
🧠 Why Learn Institutional Trading?
Retail traders often fall prey to emotional trading and market manipulation. Institutional traders, however, rely on logic, data, and strategy. By learning institutional trading:
You'll stop chasing price and start anticipating moves.
You'll learn to trade with the big players, not against them.
You'll gain confidence by using smart money principles instead of random indicators.
🚀 Who Should Learn This?
Day traders looking to level up
Swing traders aiming for high precision
Option traders focusing on large-scale setups
Anyone who wants to understand how real money moves the market
📈 Ready to Ride the Big Moves?
“Learn Institutional Trading” is your pathway to mastering the strategies that drive the global markets. Say goodbye to confusion and emotional trades — and start thinking like a professional.

High-Probability Scalping Techniques🔍 What Is Scalping?
Scalping is a fast-paced intraday trading style where traders aim to take multiple small profits throughout the trading day. Instead of holding trades for hours or days, scalpers may be in and out of trades within minutes or even seconds.
Scalping is all about:
Quick entries and exits
High accuracy
Controlled risk
Small but frequent gains
The core idea? “Many small wins add up to a big win.”
Scalping works best in liquid markets, like Nifty, Bank Nifty, large-cap stocks, or high-volume futures and options.
💡 Why Do Traders Choose Scalping?
Scalping is perfect for traders who:
Have limited capital but want to grow it steadily
Prefer not to hold positions overnight (no gap-up/gap-down risk)
Love short-term action and decision-making
Want to trade professionally in 1-2 hours daily
Also, scalping can reduce your exposure to market news, global events, or overnight uncertainty.
But remember: scalping isn’t easy. It’s a skill. You need discipline, speed, and a proven strategy.
🎯 Key Characteristics of High-Probability Scalping
To make scalping successful, your strategy must include:
Factor Requirement
Speed Fast entries and exits with minimal slippage
Liquidity Trade only stocks/indexes with high volume
Precision Narrow stop losses, clear targets
Discipline No emotions, stick to plan
Risk Management Small risk per trade, compounding over time
🧠 Scalper's Mindset: Think Like a Sniper, Not a Machine Gunner
You’re not shooting randomly. You’re waiting patiently for high-probability opportunities where the odds are clearly in your favor.
Scalping is not about trading more—it’s about trading better.
🔧 Tools Every Scalper Needs
Before we dive into strategies, here’s what you must have in place:
Fast internet connection
Live market depth / Level 2 data
5-min, 1-min, and tick charts
Hotkeys for fast order placement
Broker with low brokerage per trade
Scalping involves dozens of trades per session, so costs matter!
🛠️ High-Probability Scalping Techniques (Explained in Human Language)
Let’s now explore some proven techniques that many experienced scalpers use.
🔹 1. VWAP Bounce Strategy
VWAP = Volume Weighted Average Price. It tells you the average price where most volume happened during the day.
📌 Concept:
In a trending market, price often bounces off VWAP before continuing the trend.
You trade that bounce.
✅ Rules:
Identify trend (price above VWAP = uptrend, below = downtrend)
Wait for a pullback to VWAP
Look for confirmation (like a bullish candle in uptrend)
Enter trade with tight SL below VWAP
Target = 0.5% to 1% move
🔍 Chart Timeframe:
1-minute or 5-minute candles
Ideal for: Nifty/Bank Nifty, Reliance, HDFC, SBIN, INFY
🔹 2. Opening Range Breakout (ORB)
This is a classic scalping setup used in the first 15–30 minutes of market open.
📌 Concept:
First 15-min range defines the initial battle between buyers/sellers.
Breakout from this range = strong momentum.
✅ Rules:
Mark high and low of 15-min candle from 9:15 to 9:30
Buy when price breaks above the high + volume rises
Sell when price breaks below the low + volume rises
SL = below/above opposite side of the range
Target = 1:1 or trail profit
💡 Tip:
Works best on trending news days or earnings release days.
🔹 3. Scalping Breakouts with Volume Confirmation
A breakout is only real if volume supports it. Otherwise, it’s a trap.
✅ Rules:
Use 5-minute chart
Identify consolidation (flat price action with narrow range)
Watch for breakout with spike in volume
Enter with SL just outside the range
Exit with a 1:1 or 1.5:1 risk-reward
🎯 Indicators:
Bollinger Bands tightening
Volume histogram
Price breaking upper/lower band
🔹 4. RSI Divergence Scalping
You can scalp reversal points using RSI divergence.
✅ Rules:
Use 5-min or 3-min chart
RSI near 70 or 30 signals overbought or oversold
If price makes higher high but RSI makes lower high → Bearish divergence
If price makes lower low but RSI makes higher low → Bullish divergence
Enter for quick reversal scalp
SL = recent swing high/low
Target = VWAP or recent pivot
🔹 5. News-Based Scalping
Scalping on earnings releases, news events, or market-moving headlines can be profitable—but risky.
✅ Approach:
Stick to high-volume large-cap stocks
Avoid holding more than a few minutes
Use Level 2 order book to watch supply/demand shifts
Trade the initial burst, exit quickly
📈 Ideal Indicators for Scalping
VWAP
RSI (5 or 14-period)
Bollinger Bands
EMA crossover (e.g., 8 EMA vs 21 EMA)
MACD (fast settings for short-term signals)
But remember: indicators are tools, not guarantees. Always combine them with price action and volume.
📉 Risk Management: The Scalper’s Shield
This part matters even more than the strategy itself.
Rule Explanation
Risk only 0.5% to 1% of capital per trade Protects you from wipeout on a bad day
Always have a stop-loss No SL = no survival
Don’t average losing trades You’re scalping, not investing
Exit on SL or target—no emotion Don’t hope, don’t pray
Track your win-rate Aim for 60%+ with 1:1 risk-reward
🧮 Sample Scalping Day Plan
Time Action
9:15–9:30 AM Watch first 15-min candle for ORB
9:30–11:00 AM Take 2-3 high-quality trades (VWAP bounce, RSI scalp)
11:00–2:00 PM Avoid choppy markets or only scalp consolidations
2:00–3:00 PM Look for afternoon breakouts
3:00–3:20 PM Avoid taking fresh trades, exit open ones
🔁 Scalping Checklist
Before you place any trade, ask yourself:
✅ Is the setup clear and backed by volume?
✅ Am I trading with the trend or against it?
✅ Is my SL defined and within risk limit?
✅ Am I emotionally calm and focused?
✅ Is this a high-probability or random trade?
📊 Example of a High-Probability Scalping Trade
Stock: Reliance
Chart: 1-min
Setup: VWAP bounce + bullish engulfing candle
Entry: ₹2,950
Stop-Loss: ₹2,944
Target: ₹2,958
Result: Profit of ₹8 per share in 3 minutes
This may look small—but scalpers do 5–10 such trades a day, scaling with quantity.
🚨 Common Mistakes to Avoid
❌ Overtrading (more is not better)
❌ No plan or random entries
❌ Chasing trades late
❌ Holding scalps like swing trades
❌ Trading during news without preparation
❌ Ignoring transaction costs
🧾 Final Words: Is Scalping Right for You?
Scalping is not for everyone. It requires:
High focus and speed
Strong discipline
Quick decision-making
Excellent risk control
But if you develop the skill, it can provide:
Daily consistency
Limited overnight risk
Quick compounding
Full control over trades
✅ Start small.
✅ Practice on paper or low quantity.
✅ Use one strategy, track results, then scale up.
Nifty 50 - 1D Timeframe📊 Nifty 50 – Daily Chart Overview (1D Timeframe)
Current Close (July 18): Around 24,968
Change: Down ~143 points (–0.57%)
Intraday Range: High ~25,145 | Low ~24,918
52‑Week Range: 21,744 to 26,277
YTD Performance: Approximately +5.6%
📈 Technical Indicators
RSI (14-day): ~32.5
This shows that the market is entering bearish territory, but not yet oversold.
MACD: Below signal line, value ~–67
A clear sell signal, confirming negative momentum.
Stochastic Oscillator: Above 98
Indicates that the index is overbought, and a correction may be due.
ADX (Average Directional Index): ~48
Signifies a strong trend—right now, it’s favoring bearish movement.
Other Oscillators (CCI, ROC, Ultimate): Mostly giving sell signals
🧠 Market Sentiment & Context
Nifty has been bearish for the third straight week
Trading is happening below the 20-day EMA, suggesting downward pressure
Overall tone is range-bound and lacking momentum due to:
Weak quarterly earnings
Foreign investor selling
Global market uncertainty
📉 Volatility & Risk Gauge
India VIX: ~11.2 to 11.4
This is the lowest in 15 months, signaling low market fear
Low VIX often means sideways consolidation and narrow movement
📊 Put-Call Ratio (PCR) & Options View
PCR (based on open interest): ~0.80
Indicates a bearish bias
More calls being written compared to puts
🏦 Bank Nifty Overview (for Comparison)
Close: ~56,283
Drop: ~1%
RSI: ~28 (Bearish)
MACD: Sell signal
Resistance: 57,200 – 57,600
Support: 56,300 – 55,800
Bank Nifty is also showing bearish momentum and mirrors Nifty’s structure.
📅 What to Watch Next
Corporate Q1 results – especially from large caps like Reliance, HDFC, ICICI
Global cues – US inflation, interest rate decisions, global markets
India VIX – If it spikes above 14–15, market fear might return
FIIs activity – Any strong buying/selling can swing the market
✅ Summary (Daily Timeframe)
Nifty is currently weak and range-bound
Key level to hold: 24,900
Key level to break: 25,250
Momentum is with sellers; cautious approach recommended
If no trigger appears, expect sideways movement or slow decline

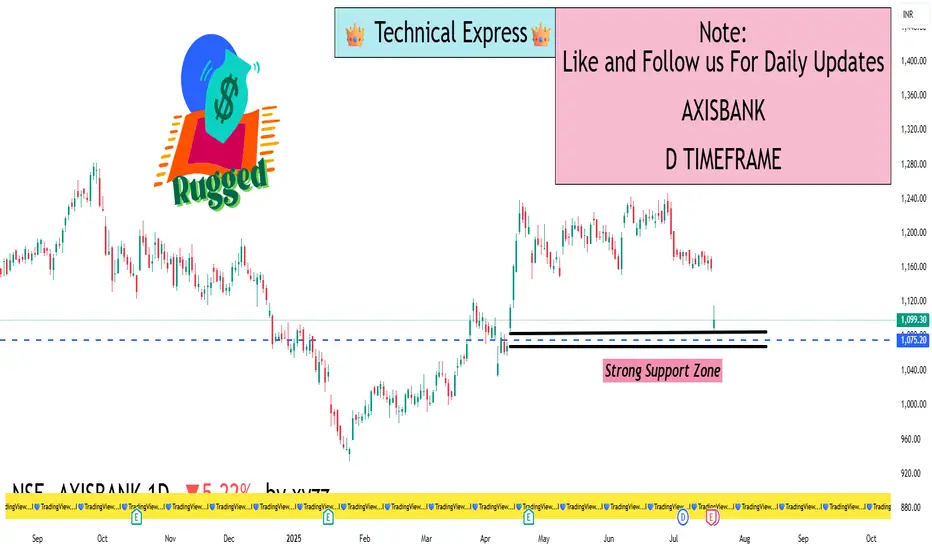
AXISBANK – 1D Timeframe📊 AXISBANK – DAILY CHART (1D TIMEFRAME)
📅 Date: July 18, 2025
Closing Price: ₹1,099
Change: –₹60.50 (–5.2%)
Intraday Range: ₹1,074 (Low) – ₹1,159 (High)
52‑Week Range: ₹867 – ₹1,186
YTD Return: Approx. +8%
Volume: Heavier than average, indicating strong selling pressure.
⚠️ MARKET CONTEXT & TREND
Bearish Trend: Axis Bank has broken below key support zones.
Oversold RSI: While it suggests possible short-term bounce, confirmation is needed.
Strong ADX: Indicates trend strength is increasing — in this case, on the downside.
High Volume Sell-off: Indicates institutional or heavy selling pressure.
No reversal indicators yet – MACD is still negative and falling.
🔍 SUMMARY VIEW
Trend: Strongly Bearish
Momentum: Weak, heavily oversold
Volatility: High
Reversal Signs: Not yet confirmed
Short-Term Outlook: Bearish to sideway unless price reclaims ₹1,120–1,150 zone
🔮 WHAT TO WATCH NEXT
Reversal Confirmation: Look for RSI climbing back above 30 and MACD crossover.
Volume Drop on Red Days: If selling volume dries up, it may signal weakening bears.
Breakout above ₹1,150: Could confirm fresh buying and trend reversal.
Further Drop Below ₹1,070: Could lead to panic selling and deeper correction
Geopolitical & US Macro WatchWhat Is Geopolitical & US Macro Watch?
This is a two-part term:
1. Geopolitical Watch
This refers to tracking and analyzing global political situations that can impact trade, oil, currency, defense, or investor confidence. Examples include:
Wars or conflicts (Ukraine-Russia, Israel-Gaza, China-Taiwan)
Global oil sanctions
Strategic alliances (e.g., BRICS+ expansion, NATO decisions)
Diplomatic tensions between countries
These events influence:
Crude oil prices
Foreign exchange rates
FII flows (Foreign Institutional Investment)
Global demand-supply outlooks
2. US Macro Watch
This focuses on tracking economic developments in the United States, the world's largest economy. Key areas to watch include:
Inflation reports (CPI, PCE)
US Federal Reserve interest rate decisions
Jobs data (non-farm payrolls, unemployment rate)
Retail sales, housing starts
US GDP growth
U.S. debt levels and political decisions on trade/tariffs
Because the US dollar is the world's reserve currency, and because Wall Street often sets the tone for global markets, these macro signals directly affect India’s equity market, bond yields, and rupee valuation.
🧠 Why Does This Matter to Indian Traders & Investors?
You may ask—“Why should I care about some news in the U.S. or Europe when I’m only buying shares of Indian companies?”
Here’s the reality:
Over 50% of the daily movement in Indian indices like Nifty and Sensex is now influenced by global cues.
Foreign investors (FIIs), who own a huge portion of Indian stocks, take buy/sell decisions based on global trends, not just local stories.
US interest rates affect where FIIs want to put their money—if US bonds are yielding more, they might pull out of India.
Crude oil, which India imports heavily, is priced globally—if a war breaks out, oil shoots up and hits inflation in India.
In short: What happens outside India often decides how India trades.
🔥 Major Geopolitical Risks in 2025
Let’s look at some real-world developments that have been shaking or supporting markets this year:
1. Russia-Ukraine Conflict (Still Ongoing)
Even in 2025, the war isn’t over.
It affects wheat prices, natural gas, and military spending globally.
India has been balancing ties with both Russia and the West, but disruptions affect commodity markets, logistics, and inflation.
2. Middle East Tensions (Gaza, Iran, Red Sea Attacks)
Ongoing conflicts have kept crude oil prices elevated.
Shipping through the Suez Canal and Red Sea has become riskier, increasing global logistics costs.
This directly affects India’s import bill, trade deficit, and rupee stability.
3. US–China Trade Friction
The US has imposed tech restrictions on China; China is retaliating.
If tensions escalate further, it will impact the global supply chain, especially for semiconductors, electronics, and electric vehicles.
Indian tech companies (like TCS, Wipro) may see ripple effects due to changes in global outsourcing dynamics.
4. Taiwan Risk
Any Chinese military action on Taiwan could be catastrophic for markets, especially in electronics and semiconductors.
Since semiconductors power everything from phones to EVs, even a threat here affects stocks globally.
📊 Key US Macro Trends Impacting Markets in 2025
1. US Inflation is Cooling, But Not Gone
After peaking in 2022, inflation has come down, but in 2025, it’s still sticky.
That means the Federal Reserve (US central bank) is not cutting rates as aggressively as markets hoped.
➡️ When the Fed keeps rates high:
US bond yields rise
FIIs pull money out of emerging markets like India
Nifty and Sensex feel the pressure
2. US Job Market Is Strong
A robust job market signals continued economic expansion, good for global demand.
This is why metals, IT, and manufacturing stocks in India rally when US jobs data is good.
3. The Fed’s Interest Rate Policy
The biggest global event each month is the Fed meeting.
If they cut rates, stocks rally globally.
If they pause or raise rates, money flows into safe assets like gold or the US dollar—hurting Indian equities.
Real-Time Example: July 2025
In July 2025, Indian markets have been:
Rallying due to strong US jobs data and earnings
Cautious due to potential Trump-era tariffs on countries buying Russian oil
Watching closely for US inflation print and Fed meeting signals
GIFT Nifty shows bullish strength in pre-market hours when the US ends green. But we’ve also seen sell-offs on days of oil spikes or war-related news.
🧭 How to Track These Developments (Even If You’re Busy)
Here’s a simple checklist for staying informed:
✅ Every Morning
Check GIFT Nifty
Read major global headlines (US data, oil prices, geopolitics)
Note the USDINR trend
Watch India VIX
✅ Every Week
Look at US job reports, inflation (CPI), and Fed speeches
Follow crude oil and gold charts
Track FII/DII activity
Keep an eye on shipping, metals, and defense-related stocks
✅ Final Thoughts
"Geopolitical & US Macro Watch" is not just a fancy term—it's a crucial lens for today’s markets. The biggest stock market moves often come not from company news but from macroeconomic surprises or global tensions.
In 2025, being globally aware gives you an edge:
You’ll avoid panic on news-driven crashes
You’ll better understand why your portfolio is up or down
You’ll identify trade setups ahead of others
👉 Think global, act local—that’s the new mantra for smart Indian investors.
If you want daily or weekly updates summarizing these events and their impact on Indian markets, let me know—I’ll be happy to prepare a custom watchlist or dashboard for you
GIFT Nifty Signals Bullish Start🏛️ What is GIFT Nifty?
Let’s start with the basics.
GIFT Nifty is the new name for what used to be known as the SGX Nifty—a derivative contract that mirrors the Nifty 50, but is traded outside India.
It now runs on the GIFT City platform (Gujarat International Finance Tec-City).
It gives traders, especially foreign institutional investors (FIIs), the ability to trade in Nifty futures even before the Indian market opens.
Think of it as an early indicator of how the Nifty 50 might perform when the Indian market opens at 9:15 am.
✅ Important: GIFT Nifty is NOT a separate index.
It simply reflects the expected movement of the Nifty 50 index, based on global market cues and overnight developments.
🧠 Why Did SGX Nifty Become GIFT Nifty?
Until July 2023, the Nifty futures were traded on the Singapore Exchange (SGX).
But to bring more liquidity and volume back to Indian shores and to establish India as a global financial hub, the trading of Nifty derivatives was moved from Singapore to the GIFT IFSC platform.
Thus, SGX Nifty became GIFT Nifty.
📈 Why GIFT Nifty’s Morning Move Matters
Each morning, traders, analysts, media houses, and even retail investors check GIFT Nifty levels.
Why?
Because it acts as a directional clue. Here’s how:
If GIFT Nifty is up by 100 points, it’s a sign that Nifty 50 is likely to open higher.
If it’s down by 75 points, it hints at a gap-down opening.
It reflects the sentiment of global markets, overnight US cues, geopolitical risks, and FII mood.
📊 Example:
GIFT Nifty trading at 22,450 (up 80 points)
Yesterday’s Nifty close: 22,370
→ Bullish sign → Indian markets may open with a gap-up of 70–100 points.
📌 What Does “Bullish Start” Mean?
A bullish start means the market is expected to open on a positive note—meaning, the index (like Nifty or Sensex) may start the day higher than the previous day’s closing.
This can happen due to:
Strong global cues (e.g., Dow Jones, Nasdaq closing higher)
Positive FII activity
Good earnings announcements
Supportive macroeconomic data
Favorable government or budget policy
Cooling of global tensions or crude oil prices
So, when GIFT Nifty shows a positive movement before 9 am, traders call it a bullish pre-market setup.
🔍 Real-World Example – July 18, 2025
On July 18, 2025:
GIFT Nifty was up by 55 points, indicating a positive start.
This came after a volatile weekly expiry on Thursday.
Strong earnings expected from companies like Reliance, JSW Steel, L&T Finance added to positive sentiment.
US markets closed flat, but no major negative surprise.
FIIs were net sellers, but DIIs absorbed selling pressure.
→ All this combined gave a green signal from GIFT Nifty to the domestic market.
💼 How Traders Use GIFT Nifty in Strategy
✅ 1. Pre-Market Planning
GIFT Nifty gives early clues, so:
Intraday traders plan opening range setups
Option traders adjust straddles/strangles based on expected gap
F&O traders look at overnight position rollover
✅ 2. Risk Management
A weak GIFT Nifty warns of gap-downs due to global negativity.
This allows traders to:
Hedge long positions
Tighten stop-losses
Avoid aggressive morning trades
✅ 3. Sectoral Rotation
If GIFT Nifty is up, focus shifts to high-beta stocks like Bank Nifty, Reliance, Adani Group, etc.
If it's down, defensive plays like FMCG and Pharma may perform better.
🧮 How to Read GIFT Nifty Properly?
Here are 3 simple tips:
✔️ Tip 1: Compare with Previous Day’s Nifty Close
If GIFT Nifty > Last close → Gap-up expected
If GIFT Nifty < Last close → Gap-down likely
✔️ Tip 2: Watch Global Cues
Dow/Nasdaq closing + crude oil + USD/INR = impact GIFT Nifty
If all show strength, GIFT Nifty usually reacts positively
✔️ Tip 3: Use With FII/DII Data
Bullish GIFT Nifty + FII Buying = Strong setup
Bullish GIFT Nifty + FII Selling = Weak opening might reverse later
🌎 GIFT Nifty & Global Linkage
India is now deeply linked with:
US markets (Nasdaq, S&P 500)
Crude oil
Dollar Index
Global interest rate policies (Fed, ECB)
So if:
US markets crash overnight → GIFT Nifty reacts instantly
Crude oil falls sharply → Positive for India → GIFT Nifty turns green
📍 Important: GIFT Nifty Is Not Always Accurate
Sometimes GIFT Nifty shows bullish signs, but:
Domestic news (politics, budget) pulls market down
FII/DII data surprises post-opening
Index gaps up but then reverses during the day
That’s why traders use GIFT Nifty as a clue, not a guarantee
🚦 Final Thoughts – Why You Should Watch GIFT Nifty
GIFT Nifty is like the morning alarm for the market:
It tells you what’s likely to happen before the bell rings.
Gives you a head start to plan your trades.
Helps spot sectoral strength, F&O positioning, and market mood.
Bitcoin (BTC/USD) – 1D Timeframe✅ Closing Summary:
Closing Price: ~$119,138 USD
Change: +$836 (+0.7%)
Opening Price: ~$118,302
Intraday High: ~$120,714
Intraday Low: ~$117,715
Bitcoin continued to show resilience by holding above the crucial $118,000 support level, despite facing overhead resistance near its previous high. The price action reflects bullish consolidation following recent surges above $120,000.
🔍 Key Reasons Behind the Price Action:
Institutional Demand Strengthening:
Bitcoin ETFs in the U.S. are witnessing rising inflows.
Hedge funds and family offices are seen increasing allocations, especially as digital assets gain legitimacy post-regulation discussions.
Regulatory Momentum:
U.S. Congress is pushing clearer frameworks around crypto taxation and stablecoins.
Global regulatory certainty (from EU & Japan) boosts confidence among investors and traders.
Weakening U.S. Dollar Index (DXY):
The DXY declined slightly, indirectly aiding BTC’s upward momentum.
Bitcoin remains a favored alternative store of value during fiat uncertainty.
Limited Miner Selling:
On-chain data shows a decline in miner distribution, meaning less sell-side pressure.
Miners seem optimistic about long-term prices and are holding reserves.
📈 Technical Outlook (Short-Term):
Support Zone: $117,500 to $118,000
Price found strong buyers in this range. It’s crucial that Bitcoin holds this level to maintain bullish structure.
Resistance Zone: $120,700 to $122,500
Previous highs around $122K serve as the next resistance. A daily candle close above this may trigger momentum buying.
Indicators:
RSI (Relative Strength Index): ~62 (bullish but not overbought)
MACD: Bullish crossover confirmed
Volume: Moderate, but above 20-day average
📆 Recent Trend Performance:
1-Day Return: +0.7%
1-Week Return: +2.1%
1-Month Return: +12.8%
3-Month Return: +35.4%
YTD Return: +61.2%
Bitcoin continues to outperform traditional asset classes, showing strong long-term growth despite short-term volatility.
🧠 What Traders & Investors Should Know:
Short-Term Traders: Consider range trading between $118K–$122K. Breakout above $122K may signal fresh upside potential.
Swing Traders: Watch for bullish continuation patterns (bull flags or cup-and-handle). Enter long if price closes above $121.5K on high volume.
Long-Term Investors: Accumulation at current levels could be ideal before the next halving cycle and broader adoption via ETFs and institutions.
🛠️ Chart Behavior and Candlestick Analysis:
Candle Type: Bullish candle with long lower wick, indicating buying pressure near support.
Pattern: Minor flag formation with potential breakout above $121K on next daily move.
🧭 Macro-Level Catalysts to Watch:
U.S. Bitcoin ETF weekly flows (Friday updates)
Fed interest rate guidance (next FOMC meeting)
Crypto regulation developments in U.S., EU, and APAC
On-chain metrics: exchange inflow/outflow, whale accumulation
💬 Conclusion:
BTC/USD is showing solid structure in the 1D chart. With strong institutional demand, improving global regulation, and technical support holding, Bitcoin is in a healthy uptrend. The short-term outlook remains bullish as long as BTC holds above $118K. A breakout above $122K could fuel the next leg towards $125,000–$130,000.

Master Institutional TradingWhat is Master Institutional Trading?
Master Institutional Trading is the advanced knowledge and skill set focused on understanding how big institutions operate in the market. It includes learning about market structure, order flow, liquidity zones, and smart money concepts. The goal is to understand where and why institutional players are placing their trades so individual traders can follow their footprint rather than trade blindly.
Key Elements of Institutional Trading
Smart Money Concepts (SMC):
This focuses on how "smart money" (institutions) moves in the market, including liquidity grabs, fakeouts, and manipulation of retail traders. Mastering SMC helps traders identify high-probability trade setups.
Order Blocks:
Institutions don’t place orders like retail traders. They use large block orders, which leave visible patterns on charts called “order blocks.” Learning to identify these helps in predicting price movements accurately.
Liquidity Pools:
Institutions hunt liquidity because they need large volumes to execute trades. Stop-loss levels and obvious support/resistance zones are common liquidity areas. Master institutional traders learn to identify where liquidity sits in the market.
Market Structure:
Understanding market structure (higher highs, lower lows, break of structure) is critical. Institutions move the market in phases — accumulation, manipulation, expansion, and distribution.
Volume and Order Flow Analysis:
Mastering institutional trading includes studying how volume flows in the market, using tools like volume profile, footprint charts, and delta analysis to see where institutional money is entering or exiting.
Benefits of Learning Master Institutional Trading
Higher Accuracy: You trade with the market makers, increasing your chance of success.
Better Risk Management: Institutional strategies often involve precise entry points and tighter stop-losses.
Avoiding Retail Traps: Most retail traders lose money because they trade in the wrong direction. Institutional trading helps you avoid these traps.
Consistency: You develop a rule-based approach, avoiding emotional decisions.
Why Institutions Dominate the Market
Institutions control over 70% of daily market volume, especially in forex, stocks, and commodities. They have advanced technologies like high-frequency trading (HFT), deep market data, and insider information that allow them to manipulate short-term price actions. By understanding their strategies, you can ride the momentum they create rather than getting trapped.
Final Thoughts
Mastering Institutional Trading is not about predicting the market but reading it correctly. By learning how institutional players think and operate, you can make more informed, disciplined, and profitable trading decisions. It transforms your trading approach from gambling to a professional strategy. This knowledge is essential for anyone serious about making consistent profits in the financial markets

LEARN INSTITUTIONAL TRADING✅ What is Institutional Trading?
Institutional trading focuses on understanding how big money flows in the market. Institutions trade in huge quantities, and their strategies revolve around manipulating prices to collect liquidity, triggering stop-losses, and creating false breakouts. Retail traders often lose money because they follow trends without understanding the market structure set by these institutions.
✅ What You Will Learn in Institutional Trading
1. Smart Money Concepts (SMC):
Learn how smart money (institutions) traps retail traders using fake breakouts, stop hunts, and liquidity grabs.
2. Market Structure:
Higher Highs (HH), Higher Lows (HL), Lower Highs (LH), Lower Lows (LL)
Break of Structure (BOS) and Change of Character (CHOCH)
This helps you predict market direction with logic, not emotions.
3. Order Blocks:
These are zones where institutions place large orders. You’ll learn how to identify them and trade with the big players.
4. Liquidity Pools:
Find out where stop-losses and pending orders are sitting in the market so you can trade smartly by targeting liquidity zones.
5. Entry & Exit Strategies:
Master high-probability entry techniques and learn proper risk management like institutional traders.
✅ Why Learn Institutional Trading?
Retail Trading Institutional Trading
Random entries Planned entries based on logic
Easily manipulated Trades follow the footprint of big players
Low win rate Higher win rate with patience
Emotional trading Rule-based, stress-free trading
✅ Benefits of Mastering Institutional Trading
🎯 Accurate Trades – Follow the market makers.
💸 Better Risk-Reward – Small stop-loss, bigger targets.
⏰ Trade Less, Earn More – No overtrading, only quality setups.
🧠 No Indicators Needed – Pure price action and market reading.
✅ Who Can Learn Institutional Trading?
✅ Beginners who want to start right.
✅ Retail traders who keep losing.
✅ Part-time traders looking for consistency.
✅ Anyone serious about becoming a profitable trader.
✅ Final Words:
Institutional trading teaches you how to trade with the smart money instead of against it. Once you master these strategies, you will understand market moves like a professional and make more consistent profits

UPL – Demand Zone Based Trade Setup________________________________________________________________________________📈 UPL – Demand Zone Based Trade Setup
🕒 Chart Type: 15-Min | 🗓 Date: 17th July 2025
🔍 Simple and Structured Setup for New Traders
________________________________________________________________________________
🚦 Key Zones to Watch
🔴 Top Range (Resistance) – 697.45
🟠 Mid-Level Zones – 685.60 | 673.75
🟢 Bottom Range (Support) – 661.95
📦 Possible Demand Zone – 671.95 to 669.70 (SL: 669 | Risk: 2.95)
________________________________________________________________________________
💡 What’s Happening on the Chart?
✅ Strong price rally from the demand area 📈
✅ Price is now consolidating just below major resistance (697.45)
✅ Volume spikes indicate strong participation
✅ Market respecting zones cleanly — ideal for zone learners 📚
________________________________________________________________________________
🎯 How to Plan Trades (For Educational Use Only):
🔼 Best Buy Setup:
• Entry: Near 671.95–669.70 (Demand Zone)
• Stoploss: 669
• Target: 685 / 697
• Why: Tested demand zone + strong uptrend + low-risk trade
🔽 Best Sell Setup:
• Entry: Near 697.45 (Resistance Zone)
• Stoploss: 699
• Target: 685.60 / 673.75
• Why: Top zone tested + price may reverse with exhaustion
________________________________________________________________________________
🧠 Learning Points for New Traders:
• ✅ Always trade with trend until you hit opposite zone
• 🧱 Focus on buying near support and selling near resistance
• 📊 Use volume and structure for entry confirmation
• 🧠 Risk should always be smaller than reward
________________________________________________________________________________
📦 Zone Summary for Quick Reference:
• 🔴 Resistance Zone: 697.45
• 🟢 Demand Zone: 671.95 – 669.70 (Risk only ₹2.95!)
⚠ Disclaimer (Please Read):
• These Trades are shared for educational purposes only and is not investment advice.
• I am not a SEBI-registered advisor.
• The information provided here is based on personal market observation.
• No buy/sell recommendations are being made.
• Please do your own research or consult a registered financial advisor before making any trading decisions.
• Trading involves risk. Always use proper risk management.
I am not responsible for trading decisions based on this post.
________________________________________________________________________________
💬 Found this helpful?
Drop your thoughts or questions in the comments below ⬇️
🔁 Share this post with your trading community – let them benefit from clean charts, structured setups, and zone-based learning.
✅ Follow simpletradewithpatience for charts, clean setups, and educational content based on price action, zones, and risk-managed trades.
🚀 Trade with patience, trust your charts, and stay clear-headed!
Be Self-Reliant | Trade with Patience | Learn with Charts & Zones 📊
________________________________________________________________________________
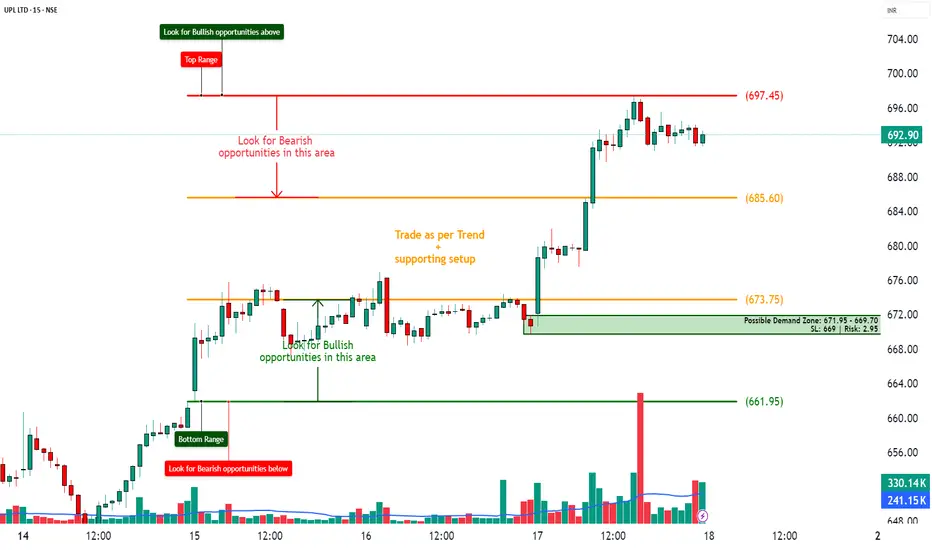
BALKRISIND – Zone Based Price Action Setup________________________________________________________________________________
📈 BALKRISIND – Zone Based Price Action Setup
🕒 Chart Type: 15-Min | 🗓 Date: 17th July 2025
🔍 Easy-to-Understand Setup for New Traders
________________________________________________________________________________
🚦 Key Zones to Watch
🔴 Top Range (Resistance) – 2779.00
🟠 Mid-Level Zones – 2730.30 | 2681.75
🟢 Bottom Range (Support) – 2633.20
________________________________________________________________________________
💡 What’s Happening on the Chart?
✅ Strong Up-Move seen from the support zone 📈
✅ Price is now consolidating below a tested Supply Zone (2779 - 2758)
✅ Volume spike shows interest near breakout
✅ A clean structure for price action-based planning 🔍
________________________________________________________________________________
🎯 How to Plan Trades (Educational Purpose Only):
🔼 Best Buy Setup:
• Entry: Above 2779 (Breakout signs)
• SL: Below 2730
• Target: R:R 1:1 | 1:2 +
• Reason: Trend continuation + price holding above key levels
🔽 Best Sell Setup:
• Entry: Near 2775–2780 (Supply Zone)
• SL: 2781.30
• Target: R:R 1:1 | 1:2 +
• Reason: Strong supply zone tested + limited upside + defined risk
________________________________________________________________________________
🧠 Simple Learning Points:
• ✅ Trade with the trend until price reaches an opposing zone
• 🧱 Use zones (not random entries) for planning
• 📉 If price enters Supply → look for bearish signs
• 📈 If price pulls back to Demand → look for bullish setups
________________________________________________________________________________
📦 Zone Markings for Reference:
• 🔴 Supply Zone: 2779 – 2758.20
⚠ Disclaimer (Please Read):
• These Trades are shared for educational purposes only and is not investment advice.
• I am not a SEBI-registered advisor.
• The information provided here is based on personal market observation.
• No buy/sell recommendations are being made.
• Please do your own research or consult a registered financial advisor before making any trading decisions.
• Trading involves risk. Always use proper risk management.
I am not responsible for trading decisions based on this post.
________________________________________________________________________________
💬 Found this helpful?
Drop your thoughts or questions in the comments below ⬇️
🔁 Share this post with your trading community – let them benefit from clean charts, structured setups, and zone-based learning.
✅ Follow simpletradewithpatience for charts, clean setups, and educational content based on price action, zones, and risk-managed trades.
🚀 Trade with patience, trust your charts, and stay clear-headed!
Be Self-Reliant | Trade with Patience | Learn with Charts & Zones 📊
________________________________________________________________________________
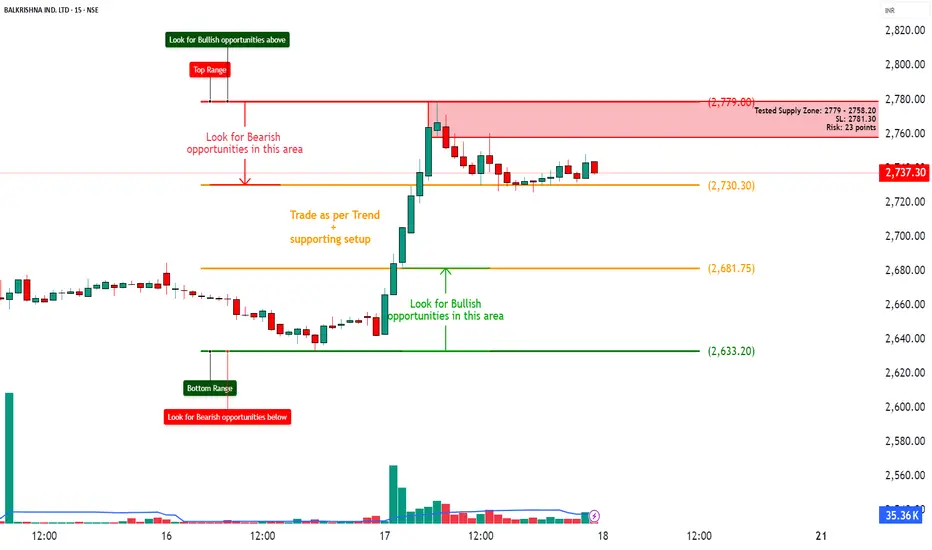
KEI – Bullish Continuation Setup with Breakout Potential________________________________________________________________________________
🚀 KEI – Bullish Continuation Setup with Breakout Potential
📅 Setup Date: 18.07.2025 | ⏱ Timeframe: Daily
📍 Strategy: Defined-Risk Bullish Spread (Short-Term Swing with OI Confirmation)
________________________________________________________________________________
🔍 Overview
Overall Bias: Bullish with supportive Put buildup
Spot Price: ₹3933.3
Trend: Sustained uptrend with OI buildup on CE/PE sides
Volatility (IV): 40–42%, stable with light compression
Ideal Strategy Mix: Defined-risk bullish strategy like vertical call spread
________________________________________________________________________________
1️⃣ Bullish Trade (Naked options as per trend)
Best CE: Buy 3900 CE @ ₹145.05
Why:
• Highest OI among CEs (7.05L) with strong Long Buildup
• Good volume and premium correction (▼16.32%) = cheaper entry
• Spot just above strike → early breakout zone
• Stable IV (40.34) gives clean delta tracking
________________________________________________________________________________
2️⃣ Bearish Trade (Naked options as per trend)
Best PE: Sell 3850 PE @ ₹82.65
Why:
• Long Buildup (OI ↑10.3%) on PE shows bullish support
• Strike sits just below spot → safety buffer
• IV stable and theta erosion beneficial
• Rich premium for selling with bullish bias intact
________________________________________________________________________________
⚙️ 3️⃣ Strategy Trade (As per trend + OI data)
Strategy: Bull Call Spread → Buy 3900 CE / Sell 4100 CE
Net Debit: ₹145.05 - ₹62.35 = ₹82.70
Max Profit: ₹200 - ₹82.70 = ₹117.30
Max Loss: ₹82.70
Risk:Reward ≈ 1 : 1.42 ✅ Within range
Lot Size: 175
Total Risk: ₹14,472.50
Max Profit: ₹20,527.50
Breakeven Point: ₹3982.70
Reversal Exit Level: Exit if Spot < ₹3879.32 (bullish spread invalidation below support)
________________________________________________________________________________
Why:
• Strong Long Buildup on 3900 CE and 4100 PE creates clean structure
• Risk:Reward = 1:1.42 fits strategy filters
• IV cooling supports call spread entry
• Breakout continuation likely with defined risk
________________________________________________________________________________
📘 My Trading Setup Rules
Avoid Gap Plays
→ Check pre-open price action to avoid trades influenced by gap-ups/gap-downs.
Breakout Entry Only
→ Enter trades only if price breaks previous day’s High (for bullish trades) or Low (for bearish trades).
Watch Volume for Confirmation
→ Monitor volume closely. No volume = No trade.
Enter on Strong Candle + Volume
→ Execute the trade only if a strong candle appears with increasing volume in the direction of the trade.
Defined Risk:Reward Only
→ Take trades only if R:R is favorable (ideally ≥ 1:2).(Safe R:R – 1:1)
Premium Disclaimer
→ Option premiums shown are based on EOD prices — real-time premiums may vary during execution.
Time Frame Preference
→ Trade with your preferred time frame — this strategy works across intraday or positional setups.
________________________________________________________________________________
⚠ Disclaimer (Please Read):
• These Trades are shared for educational purposes only and is not investment advice.
• I am not a SEBI-registered advisor.
• The information provided here is based on personal market observation.
• No buy/sell recommendations are being made.
• Please do your own research or consult a registered financial advisor before making any trading decisions.
• Trading involves risk. Always use proper risk management.
I am not responsible for trading decisions based on this post.
________________________________________________________________________________
💬 Found this helpful?
Drop your thoughts or questions in the comments below ⬇️
🔁 Share this post with your trading community – let them benefit from clean charts, structured setups, and zone-based learning.
✅ Follow simpletradewithpatience for charts, clean setups, and educational content based on price action, zones, and risk-managed trades.
🚀 Trade with patience, trust your charts, and stay clear-headed!
Be Self-Reliant | Trade with Patience | Learn with Charts & Zones 📊________________________________________________________________________________
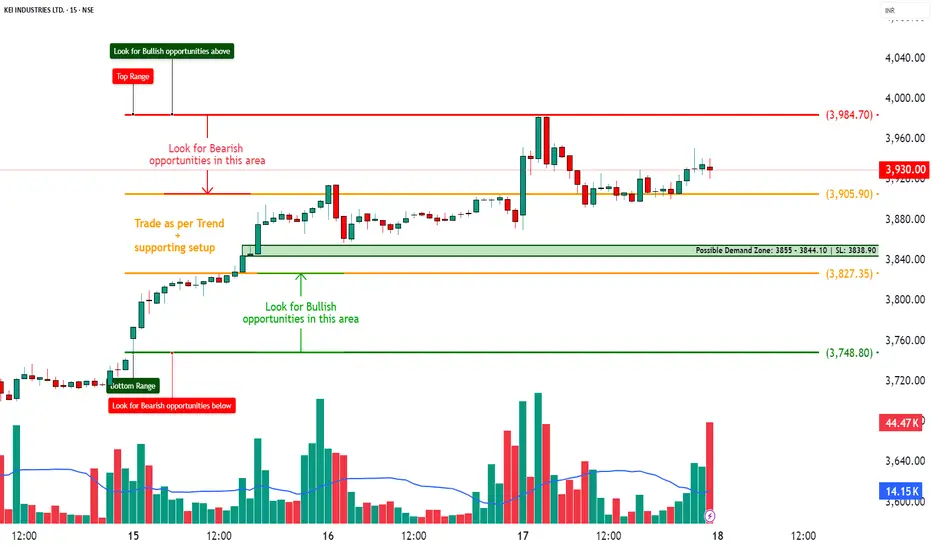
PRESTIGE – Bullish Continuation with Aggressive Call Build-Up________________________________________________________________________________📈 PRESTIGE – Bullish Continuation with Aggressive Call Build-Up
📅 Setup Date: 18.07.2025 | ⏱ Timeframe: Daily
📍 Strategy: Options Trade Setup
________________________________________________________________________________
Overall Bias: Bullish
Spot Price: ₹1,783.2
Trend: Uptrend resumption with aggressive Call OI build-up
Volatility: IV slightly falling in puts, rising in calls → good for defined risk bullish setups
Ideal Strategy Mix: Bullish with defined reward → Bull Call Spread or Naked CE
________________________________________________________________________________
1. 🔼 Bullish Trade (Naked options as per trend)
Best CE: Buy 1800 CE @ ₹49.10
Why:
• Strong Long Build Up with OI up 225%
• Massive volume (1.78L contracts) and ₹33.2 Cr TTV → clear interest
• Decent delta (approx. 0.5–0.55) → good sensitivity to price movement
• Strike closest to spot + high liquidity = ideal for directional trade
________________________________________________________________________________
2. 🔽 Bearish Trade (Naked options as per trend)
Best PE: Sell 1740 PE @ ₹28.6
Why:
• Price down 46% with high volume (4.2L) = put writing
• OI dropped 6.94% → likely unwinding from short bias
• Deep OTM with stable delta (-0.25 approx)
• Favorable if bullish view sustains and price stays above ₹1,740
________________________________________________________________________________
3. ⚙️ Strategy Trade (As per trend + OI data)
Strategy: Call Debit Spread → Buy 1780 CE + Sell 1820 CE
Net Debit: ₹57.3 - ₹41.1 = ₹16.2
Max Profit: ₹40 (spread) - ₹16.2 = ₹23.8
Max Loss: ₹16.2
Risk:Reward ≈ 1 : 1.47
Lot Size: 450
Total Risk: ₹7,290
Max Profit: ₹10,710
Why:
• 1780 CE shows explosive Long Build Up (OI ↑1031%) → active strike for bulls
• 1820 CE also shows strong Long Build Up (OI ↑1000%) → defined bullish target
• Much better R:R than 1800–1840 while staying aligned with trend
• Defined risk with improved capital efficiency and lower theta burn
________________________________________________________________________________
📘 My Trading Setup Rules
Avoid Gap Plays
→ Check pre-open price action to avoid trades influenced by gap-ups/gap-downs.
Breakout Entry Only
→ Enter trades only if price breaks previous day’s High (for bullish trades) or Low (for bearish trades).
Watch Volume for Confirmation
→ Monitor volume closely. No volume = No trade.
Enter on Strong Candle + Volume
→ Execute the trade only if a strong candle appears with increasing volume in the direction of the trade.
Defined Risk:Reward Only
→ Take trades only if R:R is favorable (ideally ≥ 1:2).(Safe R:R – 1:1)
Premium Disclaimer
→ Option premiums shown are based on EOD prices — real-time premiums may vary during execution.
Time Frame Preference
→ Trade with your preferred time frame — this strategy works across intraday or positional setups.
________________________________________________________________________________
⚠ Disclaimer (Please Read):
• These Trades are shared for educational purposes only and is not investment advice.
• I am not a SEBI-registered advisor.
• The information provided here is based on personal market observation.
• No buy/sell recommendations are being made.
• Please do your own research or consult a registered financial advisor before making any trading decisions.
• Trading involves risk. Always use proper risk management.
I am not responsible for trading decisions based on this post.
________________________________________________________________________________
💬 Found this helpful?
Drop your thoughts or questions in the comments below ⬇️
🔁 Share this post with your trading community – let them benefit from clean charts, structured setups, and zone-based learning.
✅ Follow simpletradewithpatience for charts, clean setups, and educational content based on price action, zones, and risk-managed trades.
🚀 Trade with patience, trust your charts, and stay clear-headed!
Be Self-Reliant | Trade with Patience | Learn with Charts & Zones 📊________________________________________________________________________________