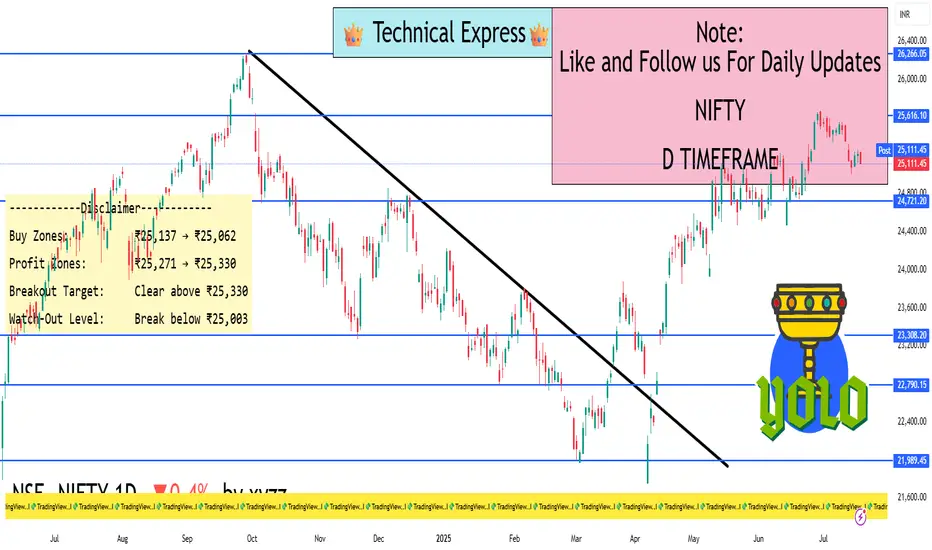
NIFTY 1D TimeframeToday’s Pivot Levels & Zones
(Data sourced from Moneycontrol – based on previous day’s trading range)
Level Type Price (₹)
Pivot Point 25,196
Resistance 1 (R1) 25,271
Resistance 2 (R2) 25,330
Resistance 3 (R3) 25,405
Support 1 (S1) 25,137
Support 2 (S2) 25,062
Support 3 (S3) 25,003
🛡️ Support Levels (Potential Buy Zones)
₹25,137 (S1) – The first support level where buying interest usually emerges during mild pullbacks.
₹25,062 (S2) – A deeper support and safer buying zone if the dip extends.
₹25,003 (S3) – Significant support; break below this may signal deeper correction.
🚧 Resistance Levels (Exit or Caution Zones)
₹25,271 (R1) – Immediate ceiling where profit-taking could occur.
₹25,330 (R2) – Next hurdle; a daily close above this could spark a bullish breakout.
₹25,405 (R3) – Major resistance; a strong move past this would pave the way for higher targets.
✅ How to Trade or Invest Based on These Levels
🔹 If You’re Already Holding
Stay invested while Nifty trades above ₹25,062 (S2).
Consider trimming positions around ₹25,271–25,330 on strength.
🟢 Looking to Buy on Dips?
Enter in tranches at S1 ₹25,137, and add more at S2 ₹25,062.
If Nifty drops toward S3 ₹25,003, you can accumulate more conservatively.
🔵 Planning for a Breakout?
A clean daily close above R2 (₹25,330) can be a signal to add strongly.
Post-breakout, the next target is R3 at ₹25,405.
🛑 Risk Management
If Nifty falls below ₹25,003 (S3), consider reducing exposure—trend bias may shift downward.
🎯 Quick Strategy Summary
Buy Zones: ₹25,137 → ₹25,062
Profit Zones: ₹25,271 → ₹25,330
Breakout Target: Clear above ₹25,330 → aim for ₹25,405
Watch-Out Level: Break below ₹25,003 → trend at risk
Optionsstrategies
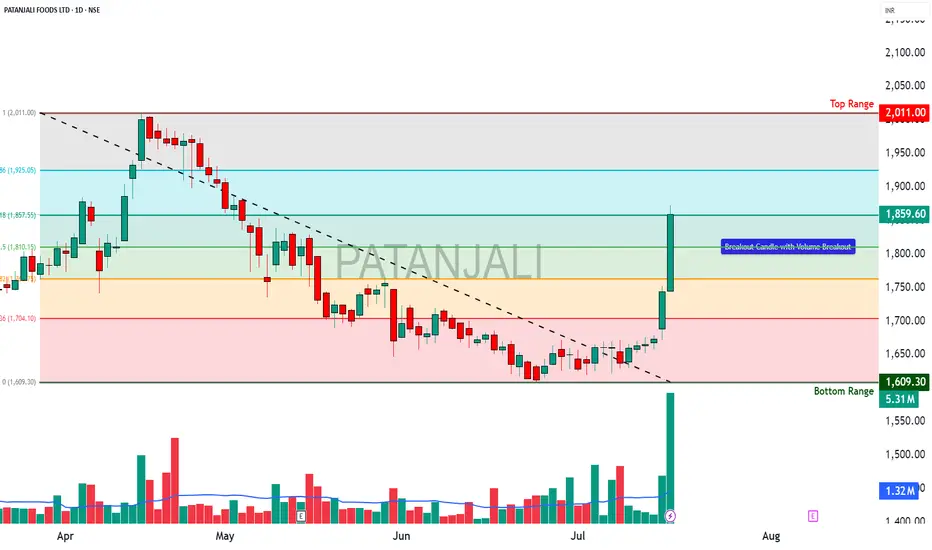
PATANJALI - OPTIONS TRADE SETUPPATANJALI OPTIONS TRADE SETUP – 17 JULY
Spot: ₹1859.6
Trend: Bullish
Volatility: Moderate IV rise (38–41%)
Lot Size: 300
________________________________________
1. Bullish Trade (Naked options as per trend)
Best CE: Buy 1860 CE @ ₹59.45
Why: Strong continuation signal with rising OI and price, heavy volume, and ideal gamma/vega mix for price moves.
________________________________________
2. Contrarian Trade (Naked options against trend)
Best PE: Buy 1800 PE @ ₹31.3
Why: Defensive Put play with unusually high activity and rising IV → could work as hedge if breakdown begins below ₹1840.
________________________________________
3. Strategy Trade (As per trend + OI data)
Strategy: Bull Call Spread → Buy 1860 CE / Sell 1920 CE
Net Debit: ₹59.45 - ₹35.5 = ₹23.95
Max Profit: ₹60 - ₹23.95 = ₹36.05
Max Loss: ₹23.95
Risk:Reward ≈ 1:1.5
Lot Size: 300
Total Risk: ₹7,185
Max Profit: ₹10,815
Why:
• Massive Long Buildup in CE chain (1820 to 1960), with 1860 CE leading in volume and OI surge
• 1860–1920 spread captures ideal move zone before resistance at 1960
• IVs rising moderately → favors debit spread entry
• PE chain showing Short Buildup, especially at 1800/1840/1880 → downside bets getting squeezed
• Balanced risk with great R:R (1:1.5) near breakout zone — clean bullish continuation setup
________________________________________
📘 My Trading Setup Rules
Avoid Gap Plays
→ Check pre-open price action to avoid trades influenced by gap-ups/gap-downs.
Breakout Entry Only
→ Enter trades only if price breaks previous day’s High (for bullish trades) or Low (for bearish trades).
Watch Volume for Confirmation
→ Monitor volume closely. No volume = No trade.
Enter on Strong Candle + Volume
→ Execute the trade only if a strong candle appears with increasing volume in the direction of the trade.
Defined Risk:Reward Only
→ Take trades only if R:R is favorable (ideally ≥ 1:2).
Premium Disclaimer
→ Option premiums shown are based on EOD prices — real-time premiums may vary during execution.
Time Frame Preference
→ Trade with your preferred time frame — this strategy works across intraday or positional setups.
________________________________________
⚠ Disclaimer (Please Read):
• These Trades are shared for educational purposes only and is not investment advice.
• I am not a SEBI-registered advisor.
• The information provided here is based on personal market observation.
• No buy/sell recommendations are being made.
• Please do your own research or consult a registered financial advisor before making any trading decisions.
• Trading involves risk. Always use proper risk management.
I am not responsible for trading decisions based on this post.
________________________________________
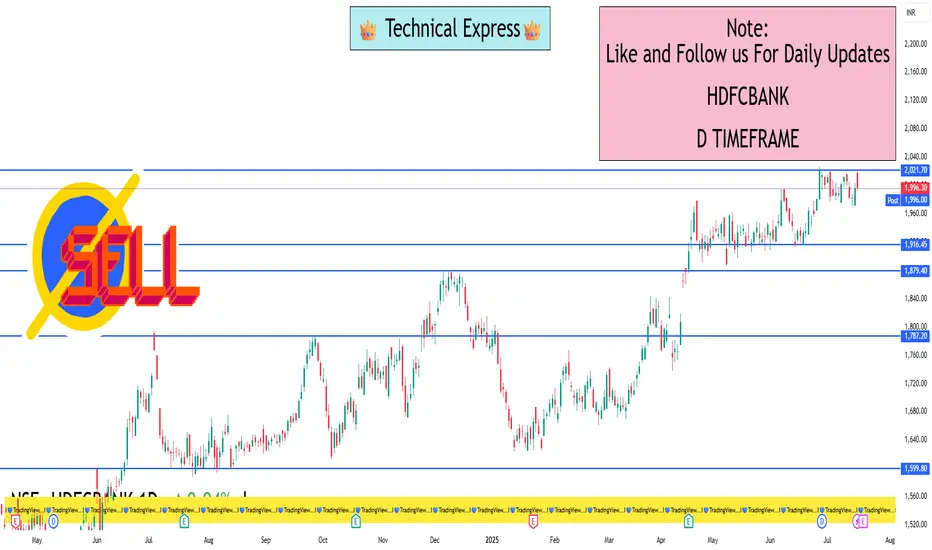
HDFCBANK 1D Timeframe✅ Holding HDFC Bank Already?
Stay invested. The stock is in a strong daily uptrend
Expect potential partial profit-taking near ₹2,021–₹2,025 or ₹2,039–₹2,040.
🟢 Planning to Buy?
First entry zone: ₹1,977–₹1,980 — safe to buy on minor dips.
Deeper buy range: ₹1,960–₹1,963 — ideal for long-term accumulation.
Place a stop-loss just below ₹1,947, especially on deeper entries.
🔵 Breakout Play?
A clean daily close above ₹2,039–₹2,040 with strong volume could launch a fresh rally.
You can add more positions after confirmation
Day-to-Day Tips
Use dips to enter near support levels with disciplined stop-losses.
Scale out or lighten positions near resistance levels.
Add more only after a confirmed breakout with strong volume.
Nifty 1D Timeframe 📍 Current Price: Around ₹25,140
📊 Intraday Range: ₹25,120 (Low) – ₹25,260 (High)
🛡️ Support Levels (Buy-on-Dip Zones)
These are the key levels where buyers may step in:
✅ Support 1 (S1): ₹25,100
Recent intraday low
If Nifty holds this, a bounce is likely
✅ Support 2 (S2): ₹25,020 – ₹25,050
Important daily support zone
Ideal for safe, staggered buying if market dips
✅ Support 3 (S3): ₹24,900 – ₹24,950
Strong technical base
If this breaks, it can trigger more selling pressure
🚧 Resistance Levels (Profit-Booking / Selling Zones)
These are levels where the rally might face hurdles:
🔼 Resistance 1 (R1): ₹25,265 – ₹25,280
Current ceiling zone
Needs strong volume to cross this
🔼 Resistance 2 (R2): ₹25,333 – ₹25,350
Key short-term resistance
If crossed, can push Nifty toward a breakout
🔼 Resistance 3 (R3): ₹25,420 – ₹25,450
Major breakout level
Closing above this could trigger rally toward ₹25,600+
Options Strategy Breakdown – For Educational Purpose Only________________________________________
📈 Options Strategy Breakdown – For Educational Purpose Only
🧠 Learn to Structure a Bull Call Spread Strategically
________________________________________
🔹 Stock Name: BSE
🔹 Spot Price: ₹2546
🔹 Lot Size: 375
🔹 Number of Lots: 1
🔹 Expiry Date: 31-July-2025
🕒 DTE (Days to Expiry): 16 Days
💡 Strategy Type: Bull Call Spread – Limited Risk | Limited Reward Option Structure
________________________________________
📘 Strategy Construction (Illustrative Example):
1️⃣ Buy Call Option – Strike: ₹2500 | Premium Paid: ₹125
2️⃣ Sell Call Option – Strike: ₹2600 | Premium Received: ₹76
🧮 Net Premium Outflow: ₹49
(₹125 - ₹76 = ₹49 * 375 = ₹18,375)
________________________________________
📊 Payoff Metrics (Illustrative & Hypothetical):
• 🔹 Breakeven Point: ₹2549.00
• 📈 Maximum Profit: ₹19,125 (When Spot ≥ ₹2600)
• ⚠️ Maximum Loss (Capital Deployed): ₹18,375 (if Spot ≤ ₹2500)
• 🔄 Real-Time PnL: Subject to market movement
• 🎯 Suggested Profit Booking Threshold: ₹18,375 (illustrative target)
• 🛑 Reversal Exit Point (Invalidation): Spot < ₹2487.75 (Support Violation)
________________________________________
📌 Why Learn This Strategy?
The Bull Call Spread is a risk-defined options strategy designed for moderately bullish views. It reduces premium cost compared to naked options and has a clearly capped loss and reward, making it suitable for learning proper risk management in derivatives trading.
________________________________________
🔍 Key Educational Takeaways:
• Helps manage premium exposure in trending markets
• Builds awareness of breakeven levels and invalidation points
• Encourages use of defined-risk structures over naked positions
• Promotes discipline and technical level-based exits
________________________________________
⚠️ Educational Disclaimer:
📢 This post is intended purely for educational and informational purposes only and does not constitute investment advice, recommendation, or solicitation to trade.
I am not a SEBI-registered investment advisor. All data shared above is illustrative and should not be considered as buy/sell advice.
Trading in derivatives involves risk. Please consult a SEBI-registered advisor before taking any financial decisions.
📘 Past performance or setup structure does not guarantee future results.
Always do your own research and use strict risk management.
________________________________________
💬 Want more educational breakdowns like this?
Drop a comment or message!
🔁 Share this with fellow learners to help them build structured option strategies.
✅ Follow @simpletradewithpatience for charts, clean setups, and educational content based on price action, zones, and risk-managed trades.
________________________________________
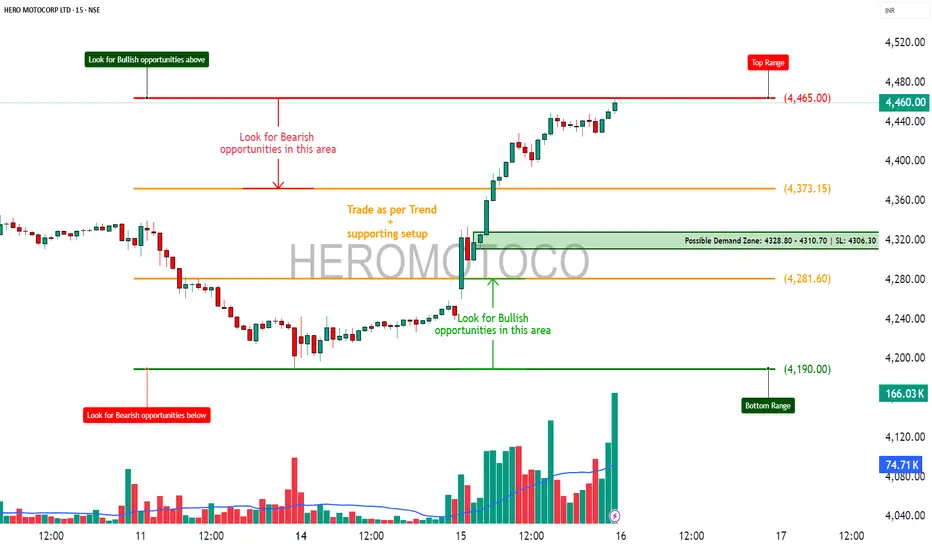
HEROMOTOCO – Option Chain + Price Action Intraday Setup________________________________________
📊 HEROMOTOCO – Option Chain + Price Action Intraday Setup
🕒 Chart Type: 15-Min Timeframe
📅 Date: July 15, 2025
🎯 For Educational Purpose Only
________________________________________
🔍 Chart Observations:
• Clean rally supported by increasing volume.
• Price nearing the Top Range / Resistance at ₹4465.
• A visible Demand Zone formed between ₹4328.80–₹4310.70 with a strong bounce.
• Volume spike confirms strong buying interest near demand levels.
________________________________________
🔢 Option Chain Insights:
🔼 Call Side Activity:
• 4500 CE: Massive Long Build Up — OI +111.76%, premium ₹52.3 → Suggests strength.
• 4450 CE: Also saw strong Long Build Up with rising premium.
• 4400 CE: Witnessed aggressive Short Covering, adding fuel to bullish momentum.
📈 Interpretation: Option writers are unwinding shorts on 4400, and 4500 is seeing heavy buildup — bullish sentiment.
🔽 Put Side Activity:
• 4400 PE: Sharp Short Build Up, IV at 34.5 → Puts being sold aggressively = Bullish bias.
• 4300 PE: Also saw strong Short Build Up, with OI rising despite falling premiums.
📉 Interpretation: Put writers are confident on downside support holding.
________________________________________
✅ Trade Plan Breakdown:
🔼 1. Best Buy – "Buy on Dip to Demand"
• Entry: ₹4328 – ₹4310 (Demand Zone)
• SL: ₹4306
• Risk Reward: 1:1 | 1:2 +
• Logic: Re-entry near demand zone + strong put writing + bullish volume = trend continuation
________________________________________
🔽 2. Best Sell – "Fade the Supply"
• Entry: ₹4460 – ₹4465 (Supply Zone)
• SL: ₹4475
• Risk Reward: 1:1 | 1:2 +
• Logic: Price near resistance with possible exhaustion. CE premiums elevated → good short-risk area
________________________________________
🟢 3. Best CE – "Momentum Play Above ₹4465"
• Strike: 4500 CE
• Trigger: If price breaks above ₹4465 with volume
• Logic: LTP ₹52.3 with Long Build Up, high delta (0.47) → Ready for breakout rally
________________________________________
🔴 4. Best PE – "Rejection Trade Below ₹4430"
• Strike: 4400 PE
• Trigger: If spot breaks below ₹4430
• Logic: LTP ₹95.75, Short Build Up suggests hedge-unwinding or trap possibility on failure
________________________________________
📦 5. Applicable Demand and Supply Zones
• Demand Zone: ₹4328.80 – ₹4310.70 (SL: ₹4306.30)
• Supply Zone: ₹4460 – ₹4465
• Mid-level Zones:
o Watch for support at ₹4373.15
o Breakdown area at ₹4281.60
• Bottom Range Support: ₹4190.00
________________________________________
💬 STWP Summary View:
The sentiment is strongly bullish, backed by long buildup in calls and short buildup in puts. If price breaks above ₹4465, momentum CE trades can fly. But supply pressure could give quick fade setups for scalpers too.
________________________________________
⚠️ Disclaimer (Read Before Trading):
• This setup is shared for educational purposes only.
• No investment advice or trade recommendation is being made.
• Always use proper risk management.
• STWP is not a SEBI-registered advisor.
• Markets involve risk. Trade with a plan, not with emotions.
________________________________________
💬 Found this helpful?
Drop your thoughts or questions below ⬇️
🔁 Share with your trading circle to help them navigate zone-based trades.
✅ Follow @simpletradewithpatience for smart charts, clean setups & demand-supply backed analysis.
📊 Let the price guide you — trade with patience, charts, and clarity!
________________________________________
Midcaps & Smallcaps Giving Multi-Bagger Moves🔍 What’s Going On in the Market?
If you’ve been watching the Indian stock market lately, you’ve probably noticed a massive rally in midcap and smallcap stocks. Stocks that were quietly trading in the background are now suddenly up 50%, 100%, or even 200% within months. Investors who took early positions in these counters are sitting on multi-bagger returns — and everyone wants a piece of the action.
You may have heard of recent examples like:
Suzlon Energy – up over 200% in a year
JTL Infra – up 5x in 2 years
Taneja Aerospace, Tata Tele, Lloyds Metals, Zen Tech, and others doubling in months
So, what’s behind this mega rally?
Should you join now or stay cautious?
Let’s break it all down — without jargon, just real talk.
💼 First, What Are Midcaps and Smallcaps?
These terms refer to the market capitalization (total value of a company’s shares).
Category Market Cap (Approx) Example Stocks
Large Cap ₹50,000 Cr+ Reliance, HDFC Bank, Infosys
Mid Cap ₹10,000 Cr to ₹50,000 Cr Cummins India, PI Industries
Small Cap Below ₹10,000 Cr Suzlon, JTL Infra, RCF
📌 Multi-bagger = A stock that gives 2x, 5x, or 10x returns on your investment
🔥 Why Are Midcaps & Smallcaps Flying in 2025?
Let’s look at the real reasons behind this boom.
1. Strong Economic Growth
India is projected to grow over 7%+ GDP in FY26, highest among large economies.
Sectors like defence, infra, power, and manufacturing are booming — and many mid/smallcap companies are direct beneficiaries.
2. Government Push for Capex & Manufacturing
Schemes like PLI (Production Linked Incentive), ‘Make in India’, and massive infrastructure spending have boosted earnings for niche companies.
Railways, roads, power, and defence see record budget allocations.
3. Retail Participation at All-Time High
More retail investors are trading and investing via Zerodha, Groww, Upstox, etc.
They’re moving beyond large caps and discovering low-priced high-potential stocks.
4. FIIs & DIIs Entering Midcaps Again
Big institutions avoided smallcaps for years due to volatility.
Now, even they are entering quality midcaps, fueling fresh momentum.
5. Technical Breakouts & Volume Surge
Chart patterns (like cup & handle, breakouts) are visible on hundreds of smallcap charts.
Delivery volumes (not just intraday) are rising — a bullish sign.
📈 Real Examples: 2023–2025 Multi-Bagger Stories
🌀 Suzlon Energy
Old wind energy player that was almost bankrupt.
Made a comeback with debt restructuring + clean energy narrative.
Went from ₹5 to ₹40+ in 2 years = 700%+ returns
🛠️ JTL Infra
Steel tube manufacturer for infra and construction.
Strong earnings, high promoter holding, and exports rising.
Stock gave 5x return from 2022 to 2025.
💣 Taneja Aerospace
In the aerospace + defence theme, a lesser-known player.
Low float, strong niche, government defence deals.
Stock moved from ₹90 to ₹500+ in less than 18 months.
These are just a few names. There are dozens of smallcap stocks giving 50–200% returns within 6–12 months.
🧠 The Psychology Behind the Rally
Retail Investors: "Small stocks are cheaper, I can buy 1000 shares instead of 5 of Reliance!"
Traders: "Breakouts with volume? Let’s ride it!"
Institutions: "Let’s grab quality midcaps before they become large caps."
This creates a self-fulfilling cycle:
Rising prices → More buzz → More buyers → Higher prices
🧭 But Is It Safe to Enter Now?
This is where you need clarity and discipline. Not all smallcap stocks are worth buying. Some are quality businesses growing fast. Others are just hype, junk, or operator-driven.
Here’s how to approach the current market:
✅ Smart Strategy to Ride the Rally
1. Focus on Fundamentals First
Ask:
Is the company profitable?
Is debt under control?
Are revenues & profits growing YoY?
Is promoter holding strong?
If yes, it's worth tracking.
2. Use Technical Confirmation
Look for:
Breakouts with volume
Sustained uptrends
Support-retest-bounce zones
Avoid chasing gaps blindly!
3. Track Themes That Are in Focus
Current hot mid/smallcap themes in 2025:
Theme Stock Examples
Defence Zen Tech, BEL, Taneja
Railway Infra RVNL, IRFC, Titagarh
Green Energy Suzlon, IREDA, KPI Green
Capital Goods JTL Infra, KEI, KEC
Fertilizers/Chem RCF, NFL, Deepak Nitrite
These themes are backed by government policy + earnings visibility.
4. Avoid Pump & Dump
Stay away from low-volume, “Telegram tip” kind of stocks.
Check if delivery % is high — if not, it’s probably a trap.
💡 Quick Checklist Before Buying a Smallcap
Question Good Sign?
Promoter Holding > 50%? ✅ Yes
Debt-to-Equity < 1? ✅ Yes
Consistent Profit Growth? ✅ Yes
Trading Above 200 EMA? ✅ Yes
Mentioned in Annual Budget/Sector News? ✅ Yes
If 4–5 of these match, it’s worth researching deeper.
🧾 What to Avoid
Stocks with huge moves but no earnings to justify it
“Operator stocks” — low float, sudden spikes, suspicious circuits
Tips from WhatsApp/Telegram without any proof
Stocks hitting back-to-back upper circuits without volume
These often crash when the tide turns.
🛡️ Risk Management Matters More Than Ever
Midcaps and smallcaps are high-return, high-risk areas.
You must:
Never put more than 10–20% of your portfolio in smallcaps
Use a stop-loss for every trade
Book partial profits on every 20–30% move
Don’t marry any stock — even the good ones fall eventually
📊 Long-Term vs. Short-Term Approach
If You’re a Long-Term Investor:
Stick to quality smallcaps with strong business models.
SIP method works well during volatile phases.
Great time to build wealth if you stay patient.
If You’re a Swing Trader:
Use technical setups: cup & handle, breakouts, flag patterns.
Trade 2–4 week timeframes.
Use position sizing — don’t go all in on one stock.
🔮 Outlook for 2025–26
With elections approaching and strong GDP, midcaps/smallcaps may continue to lead.
But correction or volatility is expected — markets don’t rise in a straight line.
Use dips to add, avoid panic exits.
✍️ Final Words
The midcap and smallcap rally in 2025 is not just a bubble — it’s being driven by real growth, real earnings, and massive retail interest. However, not every rising stock is worth chasing. Be selective, research-driven, and disciplined.
“Everyone wants multi-baggers. But only the patient and the smart ones actually catch them.
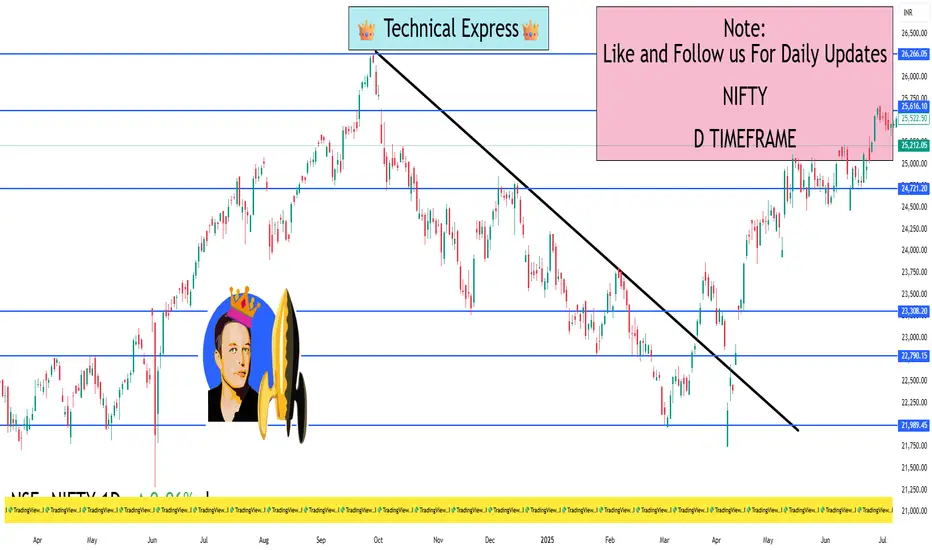
Nifty is consolidating just under ~25,500–25,600
Current Market Picture
Nifty is consolidating just under ~25,500–25,600, having pulled back a bit after last week's dip due to global market jitters and some profit booking
🛡️ Key Support Zones (Ideal Buy-on-Dip Areas)
₹25,000 – ₹25,050
This is the most critical support. A daily close below this could signal deeper weakness.
₹24,900 – ₹24,950
A secondary support zone based on pivot points—if Nifty falls here, it's potentially a good buying window.
₹24,600 – ₹24,700
A deeper backing level used if global or domestic markets take a leg lower.
🚧 Crucial Resistance Levels (Upside Barriers)
₹25,500 – ₹25,600
Near-term ceiling. A breakout and close above ₹25,600 could usher in momentum toward ₹26,000.
₹26,000
Psychological and technical landmark. A decisive move above this signals a strong bullish tilt.
📌 What You Can Do
Already Holding: Stay invested. The trend is constructive unless ₹25,000 is decisively broken.
Looking to Buy:
Watch for mild dips toward ₹25,000–₹25,050—a safe area to add quality index or ETF positions.
Or buy shares now if you believe the upward trend and institutional flows are intact.
Upside Play: A clean daily close above ₹25,600 opens the path to ₹26,000, then all-time highs.

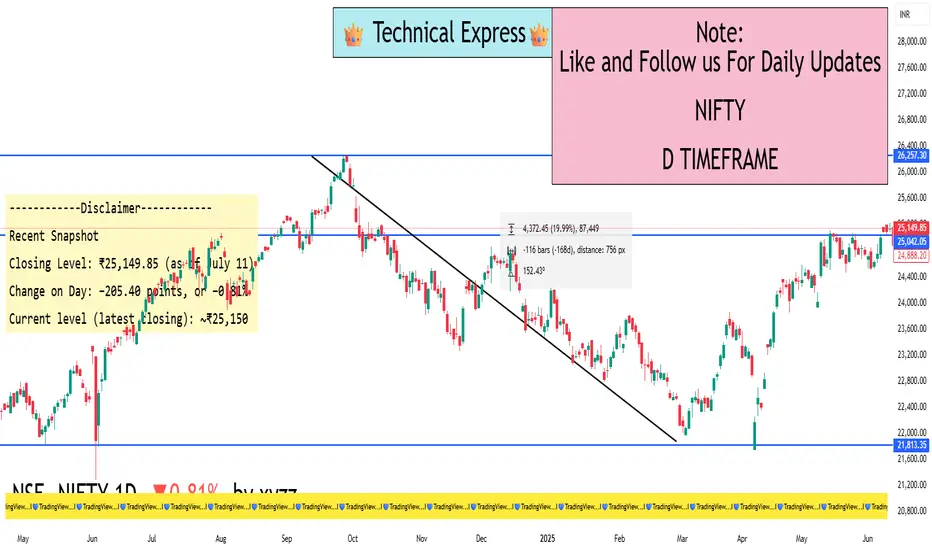
NIFTY Slips Below 25,200 The Nifty closed today at 25,149, down by around 205 points.
It has broken an important support level near 25,330, which could be a warning sign for traders and investors.
The market is showing signs of weakness – key technical indicators like RSI and MACD are also turning negative.
If Nifty slips below 25,000, we might see more downside movement in the coming days.
👉 For now, it’s better to stay cautious.
Long-term investors should wait for stability.
Short-term traders should manage risk and avoid over-trading.
Keep an eye on upcoming Q1 earnings and global market trends.
This is not the time to panic – it’s the time to stay informed and plan smartly.
Caption Highlights (optional for post tags or image text):
Nifty breaks 25,330 support
Watch 25,000 as next key level
Bearish signals on technical charts
Caution advised for traders
Market waiting for fresh cues
Dip-buying in quality large-caps & sectorsDip-Buying in Quality Large-Caps & Sectors: A Simple Investor's Guide
One of the hottest topics in today’s stock market is dip-buying in quality large-cap stocks and sectors. If you’ve been following the market even casually, you’ve probably heard this term thrown around a lot. But what does it really mean? And more importantly, how can you use this strategy to your advantage in a way that’s smart and simple?
This guide breaks it down in plain English, so whether you're new to investing or have been in the game a while, you'll understand exactly how dip-buying works, why it's trending, and what sectors and stocks are currently worth your attention.
What Is Dip-Buying?
"Buying the dip" means purchasing stocks when their prices temporarily fall, with the belief that they will rise again. Think of it like a sale at your favorite store. The item (in this case, a stock) hasn’t lost its value; it’s just cheaper for now. Smart investors take advantage of these moments to buy strong companies at a discount.
But there's a catch. Not every dip is worth buying. That’s why it's important to focus on quality large-cap stocks and strong sectors — companies and industries that have a solid track record, strong financials, and the ability to bounce back from short-term declines.
Why Is Dip-Buying So Popular Right Now?
Market Volatility: Global markets are swinging more than usual due to geopolitical tensions, inflation, interest rate changes, and currency pressure. This creates more short-term dips.
Economic Stability: Despite the ups and downs, long-term economic fundamentals in countries like India are still positive. Sectors like banking, pharma, and FMCG are showing resilience.
Pro Investor Strategy: Top fund managers and seasoned investors often use dip-buying to accumulate high-quality stocks at better prices. Retail investors are now catching on to this technique.
Better Risk-Reward: When you buy during a dip, you increase your chances of getting higher returns when the stock rebounds, while minimizing downside risk (if chosen wisely).
What Makes a Stock "Quality"?
Not every large-cap stock is a safe bet. Here are key signs that a company is worth buying on dips:
Consistent Revenue and Profit Growth
Strong Brand Recognition (like HUL, TCS, Infosys)
Good Corporate Governance
Low to Moderate Debt
Regular Dividends
Presence in a Growing Industry
These are the kinds of stocks that recover quickly after market corrections.
Sectors Worth Watching for Dip-Buying
Let’s break down a few of the most popular sectors where investors are buying dips:
1. FMCG (Fast-Moving Consumer Goods)
These are companies that sell everyday products like soap, toothpaste, and food.
Why it's strong: Demand is stable even in bad times.
Examples: HUL (Hindustan Unilever), Nestle, Dabur, Britannia.
Strategy: Buy during quarterly results disappointment or short-term inflation impact.
2. Pharma & Healthcare
Why it's strong: Healthcare is essential; global export markets offer growth.
Examples: Sun Pharma, Dr. Reddy’s, Cipla, Glenmark.
Strategy: Buy on regulatory setback or global pressure — long-term story is still intact.
3. Private Banking & Financials
Why it's strong: Credit growth is picking up; digital transformation is boosting profits.
Examples: HDFC Bank, ICICI Bank, Kotak Mahindra Bank, Axis Bank.
Strategy: Accumulate on market-wide corrections or temporary bad loan fears.
4. IT & Tech
Why it's strong: Digital services, AI, and automation are booming worldwide.
Examples: TCS, Infosys, Wipro, HCL Tech.
Strategy: Buy during global slowdown fears or margin pressure.
5. Auto & EV-Related Stocks
Why it's strong: Strong demand post-COVID, and EV boom is real.
Examples: Maruti Suzuki, Tata Motors, M&M, Bajaj Auto.
Strategy: Use monthly sales dips or raw material price spikes to enter.
How to Actually Do Dip-Buying (Without Stress)
Make a Watchlist: Pick 10–15 quality large-cap stocks across sectors.
Use Alerts or Apps: Set price alerts so you know when a stock drops 5–10% from recent highs.
Check the News: Was the dip due to a real problem or just market mood swings?
Start Small: Don’t put all your money at once. Invest in chunks. That’s called SIP (Systematic Investment Plan) in stocks.
Stay Updated: Re-evaluate your picks every quarter. Replace weak stocks.
Hold with Patience: Dip-buying is not about overnight returns. Give your stocks 6–12 months at least.
Common Mistakes to Avoid
Buying Every Dip: Not every fall is a buying opportunity. Some companies have deeper problems.
Ignoring Fundamentals: Always check financial health.
Getting Greedy: Don’t try to time the exact bottom.
Panic Selling: If you’ve done your homework, trust your process.
Real Example (as of July 2025)
Let’s say HUL dropped from ₹2,800 to ₹2,580 after weak results. If you believe in the company’s long-term story, that 8% drop is a buying opportunity. Maybe you buy 20% of your planned quantity now, and wait to add more if it drops further to ₹2,450. If it rebounds, great — you already entered.
Another example: Glenmark Pharma recently jumped 14% due to a global licensing deal. It had dipped earlier due to export pressure. Those who bought during that dip are now sitting on solid gains.
Final Thoughts
Dip-buying in quality large-cap stocks isn’t just a smart strategy; it’s also a calm one. It helps you invest without chasing highs or making emotional decisions. It works best when you combine common sense, basic research, and patience.
Markets will always move up and down. But strong companies bounce back. If you can learn to spot those temporary drops in quality businesses, you can grow your wealth steadily and confidently.
Happy Investing!
Banknifty 1day time frame📊 Current Status (as of today)
Bank Nifty is trading around: ₹56,750 – ₹56,800
It's just below its all-time high, which is around ₹57,628.
The trend is still positive (bullish), but it’s taking a breather after a big rally.
🛡️ Strong Support Zones (Buy on Dip Areas)
These are the price areas where Bank Nifty may bounce back if it falls:
₹55,500 – ₹55,700 → Minor support
₹54,300 – ₹54,500 → Stronger support zone (good for long-term entry)
₹52,500 – ₹53,000 → Very strong base; ideal for adding long-term positions if market corrects
🚀 Resistance Levels (Where Price Might Struggle)
These are areas where it might face selling pressure:
₹57,000 – ₹57,200 → Near-term resistance
₹57,600 – ₹57,800 → All-time high zone
Above ₹58,000 → Fresh breakout, could fly to new levels if crossed with volume
✅ What You Can Do (If You’re a Long-Term Investor)
If you already hold: Stay invested. Trend is still up.
If you want to buy:
Wait for a dip to around ₹54,300–₹55,000 for a safer long-term entry.
Or, buy small now and add more on dips.
Breakout Strategy: If Bank Nifty closes above ₹57,800, it may start a new rally.
📌 Summary in One Line:
“Bank Nifty is near its highs — still bullish, but don’t chase. Buy dips around ₹54,500 or add more only if it breaks above ₹57,800.”

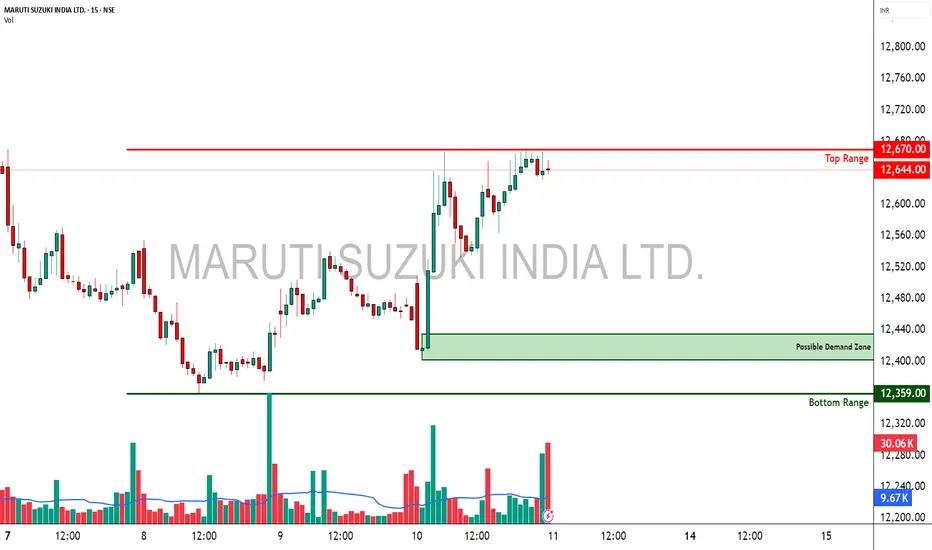
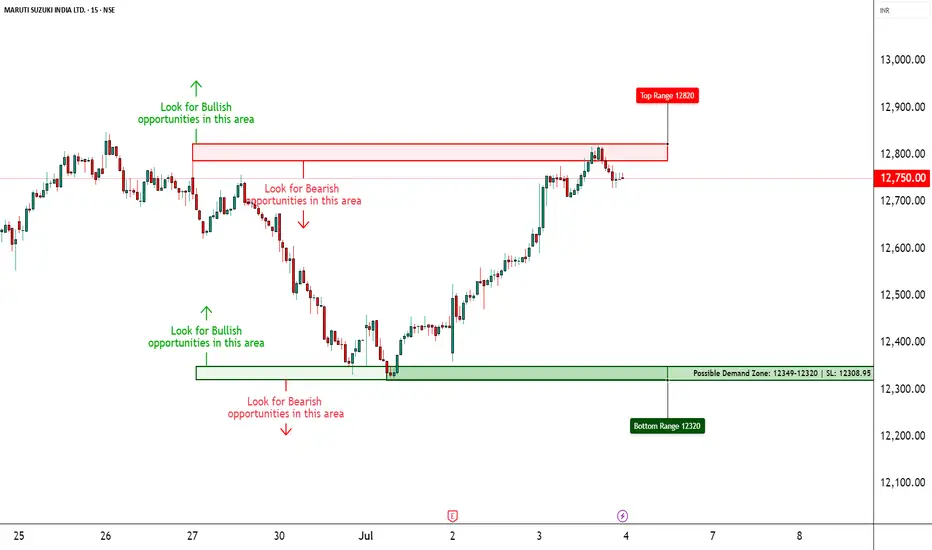
Maruti - Strong Option Chain Signals for Potential Trade Setups________________________________________________________________________________
MARUTI
Bias: Bullish Bias
Strong Long Build-Up across Call strikes (12700–13500)
Simultaneous Short Build-Up on Puts — classic bullish confirmation
________________________________________________________________________________
Best CE:
Strike: 12800
LTP: ₹138.3
OI: 5,14,100 (+78,350 | +17.98%)
Volume: 17,570
Build-Up: Long Build-Up
Interpretation: High OI addition + price rise = active bullish bets at 12800
________________________________________________________________________________
Best PE:
Strike: 12600
LTP: ₹159
OI: 1,05,700 (+76,600 | +263.23%)
Volume: 10,114
Build-Up: Short Build-Up
Interpretation: Strong put writing at 12600 suggests immediate support here
________________________________________________________________________________
Best Strategy:
Bull Call Spread or Naked Call Buy
(Buy 12800 CE, Sell 13200 or 13500 CE for risk-defined play)
- Directional bullish play
- Room to run till 13200–13500 zone based on fresh CE buildup
- Ideal if Spot sustains above 12600
________________________________________________________________________________
Why:
- Long Build-Up seen from 12700 CE to 13500 CE
- Spot = ₹12650, and 12600 PE has heavy Put writing → firm base
- Call Short Covering seen at 12500, 12600 → unwinding resistance
- IVs are rising on PEs, falling on CEs → supports bullish sentiment
- 12800 CE has highest Long Build-Up + Volume → key upside breakout strike
- Above 12800, next resistance zones visible around 13200–13500 based on CE action
________________________________________________________________________________
⚠️ Disclaimer (Please Read):
• This chart is shared for educational purposes only and is not investment advice.
• I am not a SEBI-registered advisor.
• The information provided here is based on personal market observation.
• No buy/sell recommendations are being made.
• Please do your own research or consult a registered financial advisor before making any trading decisions.
• Trading involves risk. Always use proper risk management.
________________________________________________________________________________
💬 Found this helpful?
Drop your thoughts or questions in the comments below ⬇️
🔁 Share this post with your trading community.
✅ Follow simpletradewithpatience for price-action backed technical setups.
🚀 Let’s trade with patience, logic, and clarity!
Be Self-Reliant | Trade with Patience | Learn with Logic
CAMS – Rising Wedge in Focus ________________________________________________________________________________
📈 CAMS – Rising Wedge in Focus
🕒 Chart Type: Daily
________________________________________________________________________________
What’s Catching Our Eye:
CAMS is forming a Rising Wedge, a technical structure that often leads to strong directional moves. The price is nearing the upper boundary of the wedge, indicating possible breakout or reversal. This contraction in range is typically followed by expansion — and smart traders are watching closely.
________________________________________________________________________________
What We’re Watching For:
Price holding above ₹4201.40 could trigger interest from early participants. On the flip side, a breakdown below ₹4090.50 may signal failure of the wedge structure. For more confirmation-driven entries, one may wait for a proper breakout or breakdown candle with volume.
________________________________________________________________________________
Volume Footprint Analysis:
As expected in wedge formations, volume has compressed. A breakout supported by volume expansion could validate the move and offer confidence in continuation. Volume is the key trigger to watch once the wedge resolves.
________________________________________________________________________________ Option Structure Insight:
For educational purposes, one could observe a neutral hedge approach using options:
– Buy 4200 CE
– Buy 4100 PE
This can potentially help capture a sharp move in either direction. Once the move confirms, the opposite leg can be exited to ride the trend with managed risk.
Price Action Logic:
Rising wedge formations typically form after a directional up-move and narrow into a tightening range. This is often followed by an impulsive expansion phase. CAMS is showing that exact setup. The price is sandwiched between key resistance at ₹4200+ and demand near ₹3880.
________________________________________________________________________________
💼 Sector Tailwinds:
CAMS, operating within the mutual fund RTA space, benefits from India's rising retail participation and SIP growth. The digitalisation of mutual fund flows, compliance demand, and data-based services lend long-term support to this sector. These factors offer fundamental strength to this technical setup.
________________________________________________________________________________
⚠️ Risks to Watch:
– A close below ₹4085 could invalidate the bullish wedge setup
– Current price behavior reflects compression, but indicators like Stochastic may suggest near-term overbought conditions
– Avoid chasing — wait for confirmation via breakout + volume or a proper retest candle
– Do not over-leverage in a low-volume wedge structure — focus on proper R:R and sizing
________________________________________________________________________________
🔮 What to Expect Next:
If the wedge breaks upward and sustains above ₹4201.40 with volume, price expansion may be observed toward ₹4330–₹4450 zone. On the downside, a breakdown below ₹4090.50 may trigger a move toward the ₹3950–₹3880 support cluster. Watch for confirmation in the next 2–3 sessions before taking directional exposure.
________________________________________________________________________________
🧠 How to Trade CAMS (For Educational Use Only):
🔹 Breakout Trade Plan
• Entry: Above ₹4201.40
• Stop Loss: Below ₹4090.50 (closing basis preferred)
• Pullback Entry: If price returns to ₹4095–₹4105 zone and shows bounce confirmation
• Risk-Reward: Start with 1:1, trail for 1:2+
• Position Sizing: Based on risk, never overexpose in a wedge
🔹 Options Strategy (Educational View)
• Buy CAMS 4200 CE
• Buy CAMS 4100 PE
• Exit the losing leg once direction confirms with price + volume breakout
________________________________________________________________________________
📍 Levels to Keep an Eye On:
The first key level to observe is ₹4201.40 — a break above this may attract early interest from aggressive participants as it represents the upper boundary of the rising wedge. On the downside, ₹4090.50 acts as the breakdown level; if breached, it could suggest structural weakness and a potential shift in trend.
In case of an upward breakout, we are closely monitoring the ₹4330–₹4450 zone as a possible price expansion area. If the breakdown plays out instead, the ₹3950–₹3880 zone becomes important as a potential reaction area or demand test.
Historically, the ₹3880–₹3950 range has shown signs of buyer interest and may act as a demand zone if retested. On the upside, ₹4320–₹4400 has acted as supply in the past and could present resistance if the price extends higher.
A close below ₹4085 would invalidate the bullish wedge structure and may require a reassessment of directional bias.
________________________________________________________________________________
⚠️ Disclaimer (Please Read):
• This chart is shared for educational purposes only and is not investment advice.
• I am not a SEBI-registered advisor.
• The information provided here is based on personal market observation.
• No buy/sell recommendations are being made.
• Please do your own research or consult a registered financial advisor before making any trading decisions.
• Trading involves risk. Always use proper risk management.
________________________________________________________________________________
💬 Found this helpful?
How would you prefer to approach this — breakout entry or pullback into zone?
Drop your thoughts or questions in the comments below ⬇️
🔁 Share this post with your trading community.
✅ Follow @SimpleTradeWithPatience for price-action backed technical setups.
🚀 Let’s trade with patience, logic, and clarity!
Be Self-Reliant | Trade with Patience | Learn with Logic
________________________________________________________________________________

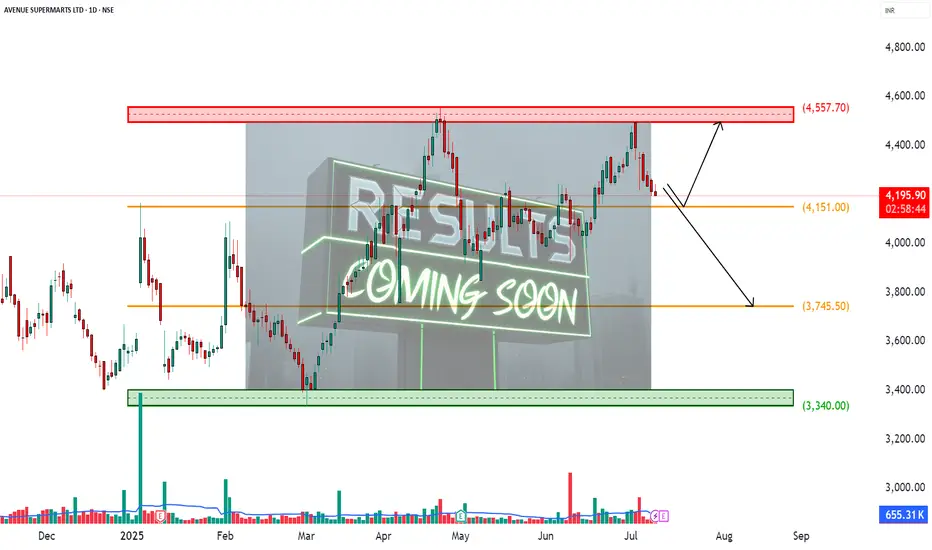
DMART – Earnings Incoming________________________________________________________________________________📈 DMART – Earnings Incoming: What’s the Right Time to Enter an Options Trade?
📆 Result Date: 11th July 2025 (Friday)
🕒 Strategy Style: Beginner + STWP HNI Learning Setup
🔍 For Educational Purposes Only
________________________________________________________________________________
🧠 What's the Setup?
DMART is announcing results on Friday, 11th July. We’re expecting a strong move — either up or down — because of mixed expectations around revenue and margins.
When you trade options around results, timing your entry is just as important as selecting the right strikes.
Let’s simplify it ⬇️ ________________________________________________________________________________✅ Option 1: Enter on 10th July (Thursday, After 2 PM)
💡 This is the ideal time for most traders.
🟢 Better option prices (not too inflated yet)
🟢 Good liquidity for smooth entry
🟢 Gives you overnight time to plan
🟢 You avoid the Friday panic crowd
🎯 STWP Suggested Strategy:
Buy 4300 CE + 4100 PE = ~₹180 total premium
This is called a Long Strangle – You win if the stock moves sharply up or down after results.
________________________________________________________________________________⚠️ Option 2: Enter on 11th July (Friday, Before 2 PM)
🔸 You might think, "Let me wait till Friday to get more clarity" — but there’s a catch:
❌ Option prices become expensive (high IV)
❌ Bid-ask spreads get wide (hard to enter)
❌ No time to react if results come intraday
❌ You’re stuck with weekend gap risk without prep
Unless you're experienced or scalping early, it’s not ideal for beginners.
________________________________________________________________________________🎯 Best Timing Rule – STWP Style:
📌 Enter on 10th July between 2:00 PM – 3:15 PM
Why?
You’ll lock in a clean setup with decent pricing and avoid stress.
📆 Exit Plan:
Hold through the weekend → Exit on Monday (14th July) if stock moves sharply 🔥
________________________________________________________________________________🧠 Alert:
Set alerts at:
₹4450 (Upside)
₹3950 (Downside)
If either hits on Monday, trail the winning side and exit the losing leg.
________________________________________________________________________________
📚 This is a learning example – not a trade recommendation.
Options carry risk. Please manage your capital and don’t trade blindly.
________________________________________________________________________________⚠️ Disclaimer (Please Read):
• This chart is shared for educational purposes only and is not investment advice.
• I am not a SEBI-registered advisor.
• The information provided here is based on personal market observation.
• No buy/sell recommendations are being made.
• Please do your own research or consult a registered financial advisor before making any trading decisions.
• Trading involves risk. Always use proper risk management.
________________________________________________________________________________
KOTAKBANK – Strong Call Long Build-Up________________________________________________________________________________
📈 KOTAKBANK – Strong Call Long Build-Up Signals Possible Upside Attempt
🕒 Chart: 15-Min | 📆 July 8, 2025
________________________________________________________________________________
🔍 What’s Catching Our Eye:
Buyers are aggressively building positions in multiple Call strikes from ₹2200 to ₹2320, hinting at bullish sentiment returning.
________________________________________________________________________________📌 What We’re Watching For:
If price sustains above ₹2240–₹2241.5, we may see a move toward ₹2300+ in the short term.
________________________________________________________________________________📌 OI Inference:
Call side is witnessing Long Build-Up (2240–2320, even 2400 CE), while Put side is under Short Build-Up, showing Put sellers are confident the downside is limited.
________________________________________________________________________________🔁 Trend Bias:
🟢 Bullish to Range-Bound – as long as price holds above ₹2200 with rising Call OI and falling PE premiums.
________________________________________________________________________________🧠 Trade Logic / Reasoning:
• Major Call strikes like 2240, 2260, 2300 under Long Build-Up
• 2200 CE shows Short Covering – a sign of prior bearish positions being exited
• Puts are mostly under Short Build-Up = downside cushion building
• Volatility is low = option buyers betting on directional breakout
________________________________________________________________________________📍 Important Levels to Mark:
🔺 Top Range (Resistance): ₹2241.5
🔻 Bottom Range (Support): ₹2111
🟢 Demand Zone: NA
🔴 Supply Zone: NA
________________________________________________________________________________🎯 Trade Plan (Educational Purpose Only):
✅ Buy (Equity): Above ₹2241.5 with strength and follow-through
✅ Sell (Equity): Only below ₹2200 if fresh PE Long Build-Up appears
✅ Best CE to Buy: ₹2240 CE or ₹2260 CE if price sustains above ₹2240
❌ Avoid Put Buying: Most Put options are under Short Build-Up (bearish bets getting closed)
📌 Strategy Idea (Low Risk):
Bull Call Spread – Buy ₹2240 CE, Sell ₹2300 CE
→ Works well if stock rises, and risk stays limited
________________________________________________________________________________⚠️ Invalidation Levels:
🔻 Below ₹2200 = Long view weakens
🔺 Above ₹2241.5 = bullish breakout confirmed
________________________________________________________________________________
⚠️ Disclaimer:
This is only for educational purposes.
STWP is not a SEBI-registered advisor.
Please consult a financial advisor before making trades.
STWP is not responsible for any trading decisions based on this content.
________________________________________________________________________________
💬 Will KOTAKBANK break out above ₹2240 or stay stuck?
⬇️ Share your view in the comments!
🔁 Repost this if you’re tracking the zone
✅ Follow STWP for clean Options + Price Action setups
🚀 Let’s trade with clarity and confidence!
________________________________________________________________________________

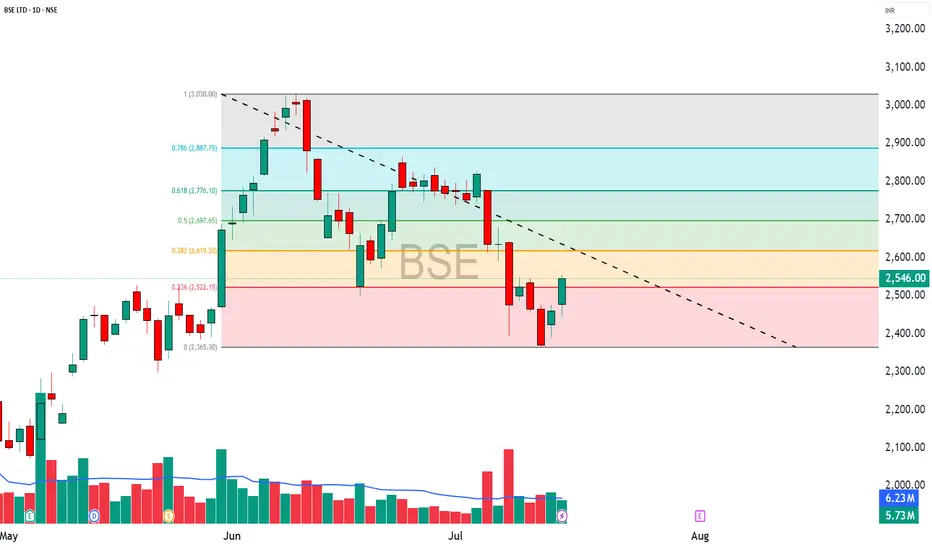
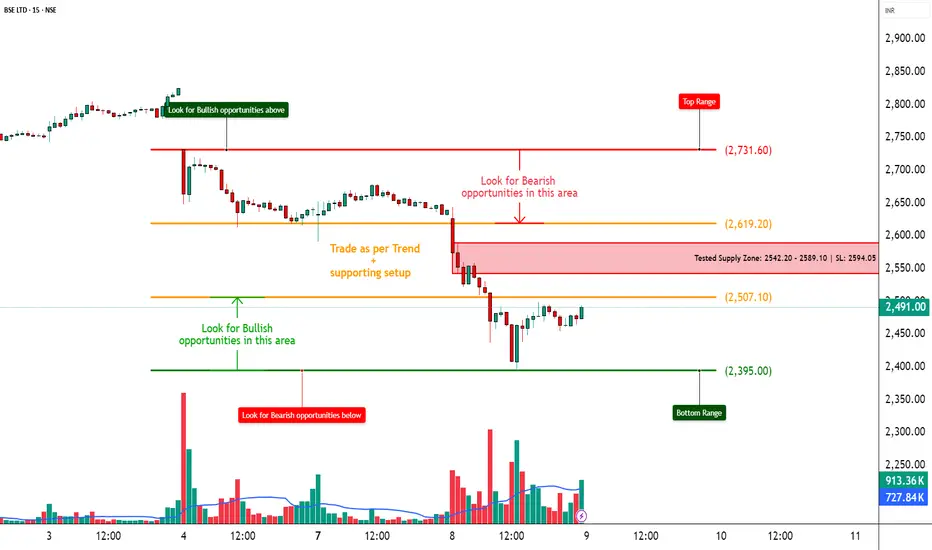
BSE – Strong Call Writing | Tested Supply Zone in Play________________________________________________________________________________
📈 BSE – Strong Call Writing Below 2600 | Tested Supply Zone in Play
🕒 Chart: 15-Min
📆 July 8, 2025
________________________________________________________________________________
🔍 What’s Catching Our Eye:
Massive Call writing seen from ₹2400 to ₹2900, clearly indicating resistance at higher levels.
________________________________________________________________________________📌 What We’re Watching For:
Price is facing selling near the ₹2542–₹2589 supply zone; a rejection here can drag it toward ₹2395 or below.
________________________________________________________________________________📌 OI Inference:
CEs are heavily sold across all levels – especially 2600, 2500, 2700, and 2400 CE.
Strong Put buying from 2400 down to 2000 PE → Market participants are expecting downside.
________________________________________________________________________________🔁 Trend Bias:
🔴 Bearish to Range-Bound – unless price breaks above ₹2594.05 with volume and CE unwinding.
________________________________________________________________________________🧠 Trade Logic / Reasoning:
• 12+ Call Strikes under Short Build-Up = strong ceiling
• Long Build-Up in deep Puts (2500, 2400, 2300, even 2000)
• Tested supply zone between ₹2542–₹2589 = rejection likely
• PE IVs rising = fear building up, especially below 2500
________________________________________________________________________________📍 Important Levels to Mark:
🔺 Top Range (Resistance): ₹2731.6
🔻 Bottom Range (Support): ₹2395
🟢 Demand Zone: NA
🔴 Supply Zone: ₹2542.20 – ₹2589.10 | SL: ₹2594.05(Tested Zone)
________________________________________________________________________________🎯 Trade Plan (Educational Purpose Only):
✅ Sell (Equity): Near ₹2542–₹2589 if price rejects the supply zone
✅ Buy (Equity): Only above ₹2594.05 with strong volume
✅ Best Put to Buy: ₹2500 PE or ₹2400 PE on breakdown
❌ Avoid Call Buying: All Calls are under heavy selling
📌 Strategy Idea (Low Risk):
Bear Put Spread – Buy 2500 PE, Sell 2400 PE
→ Profitable if stock drops, risk stays limited
________________________________________________________________________________⚠️ Invalidation Levels:
🔺 Above ₹2594.05 = bearish setup may fail
🔻 Below ₹2395 = confirms breakdown and trend continuation
________________________________________________________________________________
⚠️ Disclaimer:
This post is for educational purposes only.
STWP is not a SEBI-registered advisor.
No buy/sell recommendations are made.
Please consult your financial advisor before trading.
STWP is not responsible for any trading decisions based on this content.
________________________________________________________________________________
💬 Will BSE break supply and fly, or get rejected again?
⬇️ Share your view in the comments!
🔁 Repost this if you're watching BSE
✅ Follow STWP for clean Options + Price Action insights
🚀 Let’s trade with clarity and confidence!
________________________________________________________________________________
MARUTI – Strong Call Long Build-Up Dominance________________________________________
📈 MARUTI – Strong Call Long Build-Up Dominance | OI + Price Action Analysis
🕒 Chart Type: 15-Minute
📆 Date: July 3, 2025
________________________________________
🔍 What’s Catching Our Eye:
MARUTI closed around ₹12,752, and the entire Call side up to 13,500 is showing strong Long Build-Up, indicating aggressive bullish sentiment from option buyers. Meanwhile, the Put side is displaying Short Build-Up, further confirming bullish undertones. The price is steadily climbing, supported by strong institutional participation.
________________________________________
📌 What We’re Watching For:
If MARUTI sustains above ₹12,800, bullish continuation looks likely. Watch for follow-through toward ₹13,000 and 13,200+ if momentum persists. However, a drop below ₹12,500 could temporarily halt this upward bias.
________________________________________
📊 Volume Footprint:
Options activity is backed by strong volume — over 17k+ contracts at ₹13,000 CE and 15k+ at ₹12,800 CE — showing traders are betting big on further upside.
________________________________________
📈 Option Chain Highlights:
The OI data is highly supportive of the bulls:
• Calls (Long Build-Up):
o ₹13,000 CE: +104,450 OI | Price ↑ 8.6%
o ₹12,800 CE: +101,800 OI | Price ↑ 12.04%
o ₹12,900 CE: +95,650 OI | Price ↑ 10.07%
o Even OTM CE like ₹13,500 is active → trend belief is strong
• Puts:
o ₹12,800 PE & ₹12,700 PE both showing Short Build-Up, i.e., buyers believe downside is limited
Inference: Bulls are clearly in control, with both Call buyers active and Put sellers stepping in. This aligns with the broader bullish trend seen in the stock.
________________________________________
🔁 Trend Bias:
🟢 Bullish – Confirmed via price action and derivative sentiment
________________________________________
🧠 Trade Logic / Reasoning:
Strong accumulation is seen at every major Call level, from ATM to slightly OTM strikes. Short covering at ₹12,500 CE and long build-up in higher CE strikes confirms that the bulls are expecting a continuation rally. PE writers are unwinding or adding shorts – classic sign of strength.
________________________________________
📍 Important Levels to Mark:
🔺 Top Range (Resistance): ₹13,200 – ₹13,500
🔻 Bottom Range (Support): ₹12,500
________________________________________
🎯 Trade Plan (Educational Purpose Only):
✅ Best Buy (Equity): Above ₹12,800 with strong bullish candle
✅ Best Sell (Equity): Avoid unless ₹12,500 is broken
✅ Best CE to Long: ₹13,000 CE – Strongest long build-up with momentum
✅ Best PE to Long: Avoid PE long – sentiment doesn’t support bearish bets
🟢 Demand Zone: NA
🔴 Supply Zone: NA
⚠️ Invalidation Below:
Bullish bias is invalidated below ₹12,500 with high volume selling
________________________________________
⚠️ Disclaimer:
This analysis is for educational purposes only.
STWP is not a SEBI-registered advisor.
No buy/sell recommendations are made.
Please consult your financial advisor before trading.
STWP is not responsible for trading decisions based on this post.
________________________________________
💬 Did this help you spot the momentum early?
Drop your views in the comments ⬇️
🔁 Share this with traders watching MARUTI
✅ Follow STWP for clean price + option chain trades
🚀 Let’s educate more traders with patience and clarity!
________________________________________
RELIANCE – Trapped Between Strikes📈 RELIANCE – Trapped Between Strikes | Option Chain + Price Action Insights
🕒 Chart Type: 15-Minute
📆 Date: July 3, 2025
________________________________________
🔍 What’s Catching Our Eye:
RELIANCE is hovering just above ₹1,517.8 and facing resistance from rising short positions on Calls across 1540–1580 levels. Despite minor short covering at the 1500 and 1520 CEs, fresh Short Build-Up is visible across most strikes, suggesting upward moves are being capped. On the flip side, Puts between 1500–1530 are also witnessing Short Build-Up, indicating traders aren't expecting a major breakdown either.
________________________________________
📌 What We’re Watching For:
RELIANCE appears range-bound, and clear directional strength is missing. Price needs to decisively break above ₹1,540 for bullish strength to materialize. On the downside, support exists around ₹1,500, but if that breaks, expect pressure to mount quickly.
________________________________________
📊 Volume Footprint:
Heavy volume on both sides:
• 13k+ contracts at 1520 CE
• 11k+ contracts at 1600 CE
• Over 9k contracts traded at 1500–1530 PE
→ Traders are actively betting on both sides, suggesting volatility ahead.
________________________________________
📈 Option Chain Highlights:
• Call Side:
o 1530 CE → Long Build-Up (+2.45% OI)
o 1540 CE → Long Build-Up (+2.45%)
o 1550–1580 CE → Short Build-Up, signaling resistance buildup
o 1520 CE → Short Covering
• Put Side:
o 1500–1530 PE → Short Build-Up, hinting at base support around 1500
Inference: The tug-of-war is real. Calls are being written at higher strikes while Puts are being sold at lower strikes. That creates a tight range of ₹1,500–1,540, with traders unsure of breakout direction.
________________________________________
🔁 Trend Bias:
🟡 Neutral to Slightly Bullish – Only if ₹1,540 is reclaimed with volume
________________________________________
🧠 Trade Logic / Reasoning:
Price is squeezed between the ₹1,500 Put writers and ₹1,540+ Call writers. This is a textbook “compression zone” where a breakout or breakdown may soon follow. If bulls want control, they must push above ₹1,540 with volume and follow-through. Else, expect the sideways to weak bias to continue.
________________________________________
📍 Important Levels to Mark:
🔺 Top Range (Resistance): ₹1,540 – Break & sustain needed for upside
🔻 Bottom Range (Support): ₹1,500 – Breakdown will shift sentiment bearish
________________________________________
🎯 Trade Plan (Educational Purpose Only):
✅ Best Buy (Equity): Only above ₹1,540 with confirmation
✅ Best Sell (Equity): If price breaks below ₹1,500
✅ Best CE to Long: 1530 CE – Strong long build-up with good delta
✅ Best PE to Long: Avoid – PE sellers still active; no breakdown confirmed
🟢 Demand Zone: NA
🔴 Supply Zone: NA
⚠️ Invalidation Below:
Bullish view invalid if price fails at ₹1,540 or slips below ₹1,500 with volume
________________________________________
⚠️ Disclaimer:
This analysis is for educational purposes only.
STWP is not a SEBI-registered advisor.
No buy/sell recommendations are made.
Please consult your financial advisor before trading.
STWP is not responsible for any trading decisions based on this content.
________________________________________
💬 Found this helpful?
Drop your feedback in the comments ⬇️
🔁 Share with traders who track RELIANCE
✅ Follow STWP for consistent zone + option chain insights
🚀 Let’s trade smart, with patience and clarity!

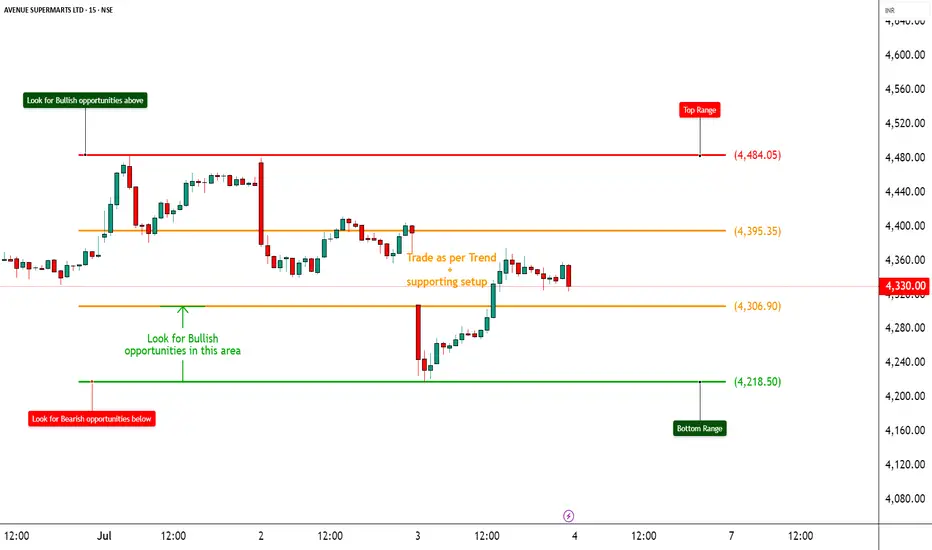
DMART – Mixed Signals with Option Chain Clues________________________________________________________________________________📈 DMART – Mixed Signals with Option Chain Clues | Option Chain + Price Action Analysis
🕒 Chart Type: 15-Minute
📆 Date: July 3, 2025
________________________________________________________________________________
🔍 What’s Catching Our Eye:
DMART is displaying notable volatility near its technical range. While the option chain reveals contrasting setups across strikes—with several Calls showing short build-ups and some Puts indicating long build-ups—the overall price action remains undecided. The current equity price (spot at 4348.70) is being carefully watched in relation to its normalized chart range.
________________________________________________________________________________
📌 What We’re Watching For:
We’re monitoring for a decisive move beyond the established range. A sustained move above the Top Range of 2464.4 (normalized chart level) could validate a bullish reversal; conversely, a breakdown below the Bottom Range of 2326.1 might trigger a bearish slide. Given the option chain dynamics, any clear directional breakout—supported by volume—will be key to shaping our view.
________________________________________________________________________________
📊 Volume Footprint:
Today’s volume is recorded at 1.83M, significantly higher than the previous 836.47k, indicating an active session. A continued high volume reading on a breakout or breakdown from our range will be critical for confirmation.
________________________________________________________________________________
📈 Option Chain Highlights:
• On the Call side, the 4,500 CE and 4,300 CE are showing strong short build-ups, while the 4,400 CE stands out with a long build-up—hinting at an emerging bullish bias if the price rallies. Additionally, the 4,600 CE continues to exhibit short build-up pressure.
• On the Put side, the 4,200 PE displays a strong long build-up, suggesting downside protection, and the 4,000 PE also shows long build-up. A notable short covering is observed in the 4,300 PE and the 4,250 PE shows additional long build-up.
These option-chain cues—combined with the volatility in the underlying—highlight the market’s mixed expectations.
________________________________________________________________________________
🔁 Trend Bias:
The bias remains directionally dependent—bullish if a reversal above the top range is confirmed, or bearish if the price falls below the bottom range.
________________________________________________________________________________
🧠 Trade Logic / Reasoning:
DMART’s price action is teetering near its critical range. The normalized technical levels (Top Range: 2464.4, Bottom Range: 2326.1) serve as key decision zones. On the options side, the presence of long build-up in the 4,400 CE suggests that, if the price reverses, buyers could step in. In contrast, the strong long build-up on the 4,200 PE underlines the protective positions if the price breaks lower. With a higher session volume amplifying the move’s significance, caution is warranted until a clear breakout or breakdown occurs.
________________________________________________________________________________
📍 Important Levels to Mark:
🔺 Top Range: 2464.4 – Look for a breakout or a reversal candlestick pattern with confirmatory volume
🔻 Bottom Range: 2326.1 – Watch for a breakdown or a bullish reversal pattern with volume support
________________________________________________________________________________
🎯 Trade Plan (Educational Purpose Only):
✅ Best Buy (Equity): Enter long on DMART if a robust bullish reversal is confirmed—ideally when the price reclaims above the top range (2464.4) with strong volume and supportive candlestick action.
✅ Best Sell (Equity): Take short positions if the price decisively breaks and holds below the bottom range (2326.1) on high volume.
✅ Best CE to Long: Opt for the 4,400 CE when the reversal is underway; its long build-up in the option chain signals the initiation of bullish interest.
✅ Best PE to Long: In a bearish scenario, consider the 4,200 PE—its long build-up indicates traders are positioning for a downside move.
🟢 Demand Zone: NA
🔴 Supply Zone: NA
⚠️ Invalidation Below:
Any bullish setup becomes invalid if DMART breaks and holds below the bottom range of 2326.1 (normalized level) with strong volume.
________________________________________________________________________________
⚠️ Disclaimer:
This post is for educational purposes only.
STWP is not a SEBI-registered advisor.
This is not a buy/sell recommendation.
Please consult your financial advisor before trading.
STWP is not responsible for any trading outcomes.
________________________________________________________________________________
💬 Found this helpful?
Drop your thoughts in the comments ⬇️
🔁 Share with fellow traders
✅ Follow STWP for zone-based price action & option chain insights
🚀 Let’s boost awareness of smart & patient trading!
________________________________________________________________________________
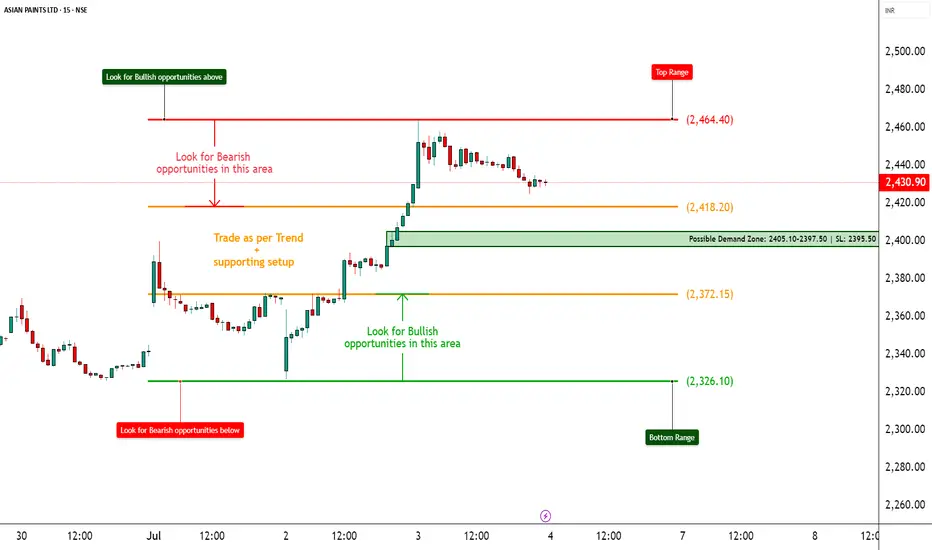
ASIANPAINT – Strong Bounce from Demand Zone________________________________________________________________________________📈 ASIANPAINT – Strong Bounce from Demand Zone | Option Chain + Price Action Breakdown
🕒 Chart Type: 15-Minute
📆 Date: July 3, 2025
________________________________________________________________________________
🔍 What’s Catching Our Eye:
ASIANPAINT saw a sharp intraday rebound from its marked demand zone at ₹2405–₹2397.50, with price closing near ₹2,430.90. The reversal occurred on higher volume and in the presence of long build-ups across multiple Call strikes. This suggests institutional interest and a potential shift in short-term sentiment.
________________________________________________________________________________
📌 What We’re Watching For:
The key observation is that ASIANPAINT respected its demand zone and bounced with strength. If the price sustains above ₹2,440, it could trigger continuation toward the top range of ₹2,464.40. On the downside, any failure to hold the demand zone may bring back pressure toward ₹2,400. Option chain data supports the bullish bias, with fresh long positions across ATM and OTM calls.
________________________________________________________________________________
📊 Volume Footprint:
Today’s volume was 1.55M, higher than the previous 1.36M, signaling strong participation during the bounce. A continuation move with volume > 1.5M may validate breakout setups.
________________________________________________________________________________
📈 Option Chain Highlights:
The 2,500 CE, 2,460 CE, and 2,440 CE all witnessed strong long build-ups, confirming bullish positioning. Even the deep OTM 2,600 CE showed healthy open interest increase. Meanwhile, 2,400 PE showed short build-up, suggesting put writers are confident that the ₹2,400 level will hold. Notably, 2,400 CE also saw short covering, adding further weight to the bullish narrative.
________________________________________________________________________________
🔁 Trend Bias:
🟢 Bullish above ₹2,440, especially if volume confirms a clean move
________________________________________
🧠 Trade Logic / Reasoning:
The bounce from demand was technical and backed by derivatives activity. The presence of long build-ups across multiple Calls and the short covering at 2400 CE suggests strength. Since price closed above key EMA zones and respected the lower boundary, it builds a solid case for an upward move, unless volume suddenly drops or a fresh supply emerges.
________________________________________________________________________________
📍 Important Levels to Mark:
🔺 Top Range Resistance: ₹2,464.40 – Watch for bullish breakout or reversal candlestick
🔻 Bottom Range Support: ₹2,326.10 – Deeper support; unlikely to come into play unless 2400 breaks
________________________________________________________________________________
🎯 Trade Plan (Educational Purpose Only):
✅ Best Buy (Cash/Futures):
Buy above ₹2,440 with bullish price action and volume confirmation. Reversal from the demand zone is valid as long as price holds above ₹2,405.
✅ Best Sell (Cash/Futures):
Sell only below ₹2,405 if the price breaks the demand zone with high volume and bearish structure. Downside may open toward ₹2,380–₹2,360.
💼 Best CE to Long:
2,440 CE or 2,460 CE – Both strikes show strong Long Build-Up; ideal for directional continuation above ₹2,440.
📉 Best PE to Long:
2,400 PE – Consider only if price breaks and sustains below ₹2,405 with heavy volume and weak candle close. Risk-reward turns favourable for downside hedging.
🟢 Demand Zone: ₹2405.10 – ₹2397.50 | SL: ₹2395.50
🔴 Supply Zone: Not clearly visible yet (watch ₹2464+ for fresh seller emergence)
⚠️ Invalidation Below:
Bullish bias invalid if price closes below ₹2,395 with strong volume and momentum.
________________________________________________________________________________
⚠️ Disclaimer:
This post is for educational purposes only.
STWP is not a SEBI-registered advisor.
This is not a buy/sell recommendation.
Please consult your financial advisor before trading.
STWP is not responsible for any trading outcomes.
________________________________________________________________________________
💬 Found this helpful?
Drop your thoughts in the comments ⬇️
🔁 Share this with fellow traders
✅ Follow STWP for zone-based price action & option chain insights
🚀 Let’s grow awareness for structured & patient trading!
________________________________________________________________________________
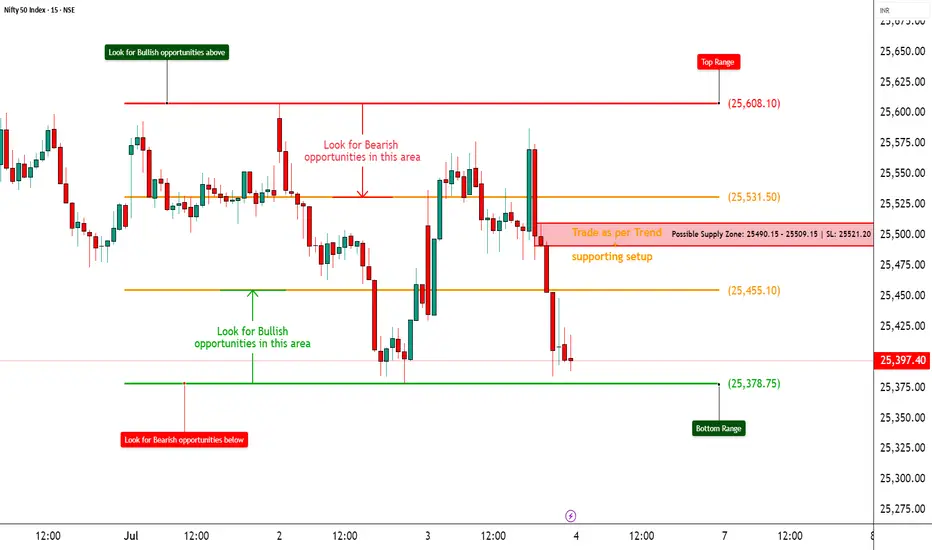
NIFTY – Range-Bound but Bearish Tilt Emerging📈 NIFTY – Range-Bound but Bearish Tilt Emerging | Option Chain + Price Action Analysis
🕒 Chart Type: 15-Minute
📆 Date: July 3, 2025
________________________________________
🔍 What’s Catching Our Eye:
NIFTY closed at ₹25,397.40, hugging the key support zone at ₹25,378. The index remains inside a well-defined range, but the sharp rejection from the ₹25,490–₹25,509 supply zone highlights sustained selling pressure. The failure to reclaim ₹25,455 signals caution from buyers.
________________________________________
📌 What We’re Watching For:
The ₹25,378 level is crucial. A breakdown below it with volume could ignite fast momentum towards ₹25,300–₹25,250. On the other side, a bullish reversal setup is only valid if NIFTY reclaims ₹25,455 with a strong candle and high volume. Option data tilts clearly bearish, showing confidence from institutions—not speculation.
________________________________________
📊 Volume Footprint:
Current volume stands at 293.43M, lower than the previous session’s 330.09M, indicating reduced participation and indecision. Watch for a volume spike below ₹25,378 (for breakdown confirmation) or above ₹25,455 (to validate reversal strength).
________________________________________
📈 Option Chain Highlights:
The 25,500 CE shows heavy short build-up, with OI sharply higher—clear sign of strong resistance. The 25,600 CE adds to that pressure with additional short positions. Meanwhile, 25,400 PE is witnessing long build-up, and strong OI in 25,000 PE shows downside anticipation. Overall, OI positioning strongly supports a bearish view.
________________________________________
🔁 Trend Bias:
🔴 Bearish unless NIFTY reclaims and sustains above ₹25,455
________________________________________
🧠 Trade Logic / Reasoning:
Price remains in a supply-driven setup, with a sharp rejection seen from ₹25,490–₹25,509. Support at ₹25,378 has held so far but looks increasingly fragile. Option chain behaviour reinforces this bearish bias—Call writers dominating higher levels and Put buyers building exposure at lower strikes.
________________________________________
📍 Important Levels to Mark:
🔺 Top Range: ₹25,608 – Look for breakout or reversal candlestick pattern + volume
🔻 Bottom Range: ₹25,378 – Watch for breakdown or bullish reversal pattern + volume
________________________________________
🎯 Trade Plan (Educational Purpose Only):
✅ Best Sell: Long - 25,400 PE – If breakdown below ₹25,378 confirms with volume
✅ Best Buy: Long 25,300 CE if price reclaims ₹25,455 + ₹25,490 zone with a strong bullish candle + volume
🟢 Demand Zone: NA
🔴 Supply Zone: ₹25,490–₹25,509 (Confirmed rejection area)
⚠️ Invalidation Below:
Bullish view becomes invalid if NIFTY breaks and holds below ₹25,378 with strong volume
Bearish view loses strength if NIFTY reclaims ₹25,455 with follow-through
________________________________________
⚠️ Disclaimer:
This post is for educational purposes only.
STWP is not a SEBI-registered advisor.
This is not a buy/sell recommendation.
Please consult your financial advisor before trading.
STWP is not responsible for any trading outcomes.
________________________________________
💬 Found this helpful?
Drop your thoughts in the comments ⬇️
🔁 Share with fellow traders
✅ Follow STWP for zone-based price action & option chain insights
🚀 Let’s boost awareness of smart & patient trading!
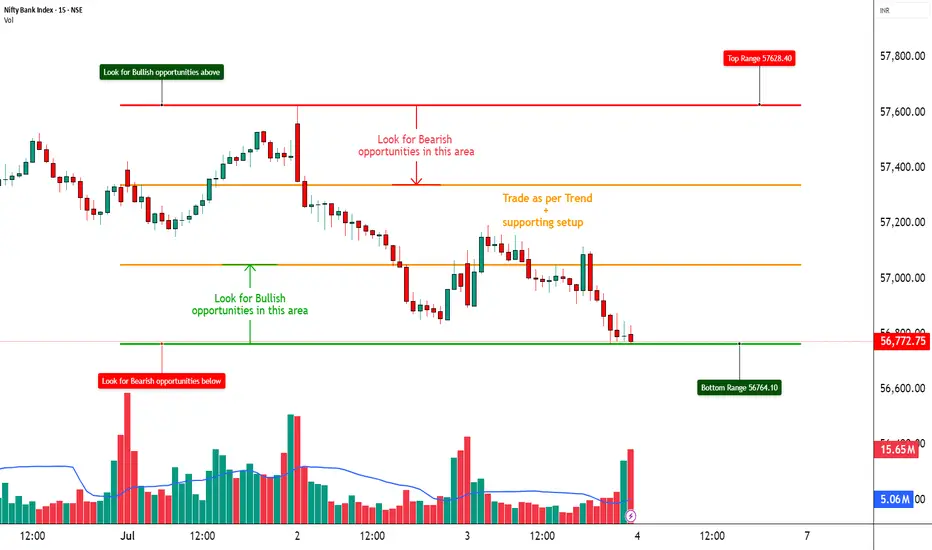
BANKNIFTY – On the Edge of Breakdown📈 BANKNIFTY – On the Edge of Breakdown | Option Chain + Price Action Analysis
🕒 Chart Type: 15-Minute
📆 Date: July 3, 2025
🔍 What’s Catching Our Eye:
BANKNIFTY is sitting dangerously close to the ₹56,770 support zone, which has been tested multiple times. Price action remains weak, and failure to bounce indicates rising pressure on this level.
📌 What We’re Watching For:
We’re closely monitoring the price action near ₹56,770 — a breakdown below this key level could trigger a sharp pick-up in bearish momentum. On the flip side, any meaningful reversal setup will only be considered valid if BANKNIFTY reclaims ₹57,100 with a strong bullish candlestick supported by volume. As of now, the option chain data continues to heavily favor the bears, offering more confirmation than speculation for a potential downside move.
📊 Volume Footprint:
The current volume stands at 149.89M, slightly lower than the previous session’s 162.75M, indicating a mild drop in participation. This suggests that traders are in a wait-and-watch mode. A sharp surge in volume—especially on a move below ₹56,770—could validate a breakdown and trigger momentum on the downside.
📈 Option Chain Highlights:
The 57000 PE is showing a strong long build-up, signaling that traders are positioning for further downside. On the other hand, the 57000 CE has witnessed a heavy short build-up, reinforcing the bearish sentiment. Additionally, lower strike PEs between 56700 and 56900 are also displaying long build-up, further confirming downside pressure. Meanwhile, Call OI is increasing at higher strikes, indicating that resistance is likely forming in the 56900–57200 range.
🔁 Trend Bias:
🔴 Bearish unless we reclaim and sustain above ₹57,100 with confirmation
🧠 Trade Logic / Reasoning:
There is a visible and well-established supply zone between ₹57,400 and ₹57,600, which has consistently capped upside attempts. On the downside, the ₹56,770 support is showing signs of exhaustion due to repeated tests. Derivative data continues to favor the sellers, with strong bearish positioning in the option chain. As there is no visible sign of a reversal yet, it's prudent to remain cautious on taking any premature long positions.
📍 Important Levels to Mark:
🔺 Top Range: 57,600 - Look for breakout or reversal candlestick pattern + volume
🔻 Bottom Range: 56,770 - Watch for breakdown or bullish reversal pattern + volume
🎯 Trade Plan (Educational Purpose Only):
✅ Best Sell: 57000 PE – Long Build-Up present, indicating institutional downside play
✅ Best Buy: 56500 CE – if reversal above 57,100 is confirmed with price action
🟢 Demand Zone: NA
🔴 Supply Zone: NA
⚠️ Invalidation Below:
Any bullish view becomes invalid if BANKNIFTY breaks and holds below 56,750 with high volume
⚠️ Disclaimer:
This post is for educational purposes only.
STWP is not a SEBI-registered advisor.
This is not a buy/sell recommendation.
Please consult your financial advisor before trading.
STWP is not responsible for any trading outcomes.
💬 Found this helpful?
Drop your thoughts in the comments ⬇️
🔁 Share with fellow traders
✅ Follow STWP for zone-based price action & option chain insights
🚀 Let’s boost awareness of smart & patient trading!
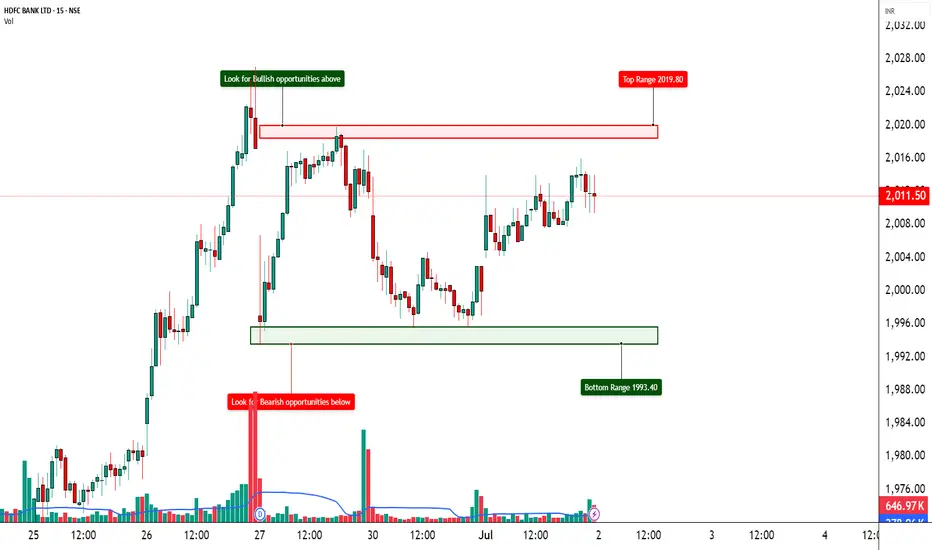
HDFCBANK – Stepping Into Bullish Territory?📈 HDFCBANK – Stepping Into Bullish Territory?
🔍 Strong Long Build-Up | Option Chain + Price Action Alignment
Chart Type: 15-min / 1H / Daily
Indicators: STWP Zones, Demand-Supply, Volume, OI Trends
🔹 What’s Catching Our Eye?
✅ Consistent Long Build-Up seen from 2000 CE to 2100 CE
✅ Massive OI Addition on 2040 CE (+6.33 lakh contracts = +50%)
✅ 2060 CE OI jumped +8.57 lakh = +82% – Serious bullish interest building up
✅ Put Writers exiting 2000 PE = Strong base forming around ₹2000
✅ Spot Price at ₹2012, sitting above psychological level
📊 What We’re Watching for:
📍 Breakout Zone: 2020–2040
📍 Targets: 2060 → 2080 → 2100
📍 Invalidation Below: 1985
📍 Momentum Confirmation: Strong close above 2040 with volume surge
📍 Option Chain Support: Heavy unwinding on 2000 PE confirms strength
📌 Trade Plan (Educational Purpose Only):
🔹 Bullish Idea: Buy above 2025 breakout with SL below 1985
🔹 Options: Look at 2040 or 2060 CE for directional exposure
🔹 BTST/Positional: If price closes above 2040 with rising OI and IV
⚠️ Disclaimer:
This post is for educational and learning purposes only.
It does not constitute buy/sell advice or investment recommendation.
Always consult your financial advisor before taking any positions.
STWP is not liable for any financial decisions based on this content.
📚 “Price is the headline, but data is the real story.”
💬 Will HDFCBANK reclaim its momentum zone, or is this just noise before the next move?