Option Trading Advanced StrategiesA. Option Buyer
The buyer pays a premium to purchase a call or put.
Rights: Has the right, not the obligation, to exercise the option.
Risk: Limited to the premium paid.
Reward: Potentially unlimited (for calls) or large (for puts).
B. Option Seller (Writer)
The seller receives the premium upfront.
Obligation: Must fulfill the contract if the buyer exercises it.
Risk: Very high (sometimes unlimited).
Reward: Limited to premium collected.
Option sellers typically have higher probability strategies but higher margin and high risk.
Optiontrading

Gap-Up Premium Continuation Observation | Intraday OptionsThis idea is based on a simple price behavior observation in option premium. When the option premium opens with a gap-up and continues to trade above the initial range with higher highs, it often shows bullish strength in that premium for the session.
In this setup, after the gap-up opening, the premium respected an upward trend structure and maintained strength throughout the day. This indicates sustained buying interest, which traders can observe for intraday momentum opportunities.
⚠️ This chart is shared only for educational and observational purposes.
It is not a buy/sell recommendation. Options trading involves high risk. Always use proper risk management and confirmation from your own analysis before taking any trade.
✅ Short Caption for Chart (Safe & Professional)
You can use any ONE of these directly on the chart:
“Gap-Up Premium with Intraday Strength – Bullish Continuation Observation”
“When Premium Gaps Up and Maintains Higher Structure, Strength Often Persists”
“Gap-Up + Trend Hold = Intraday Premium Momentum (Observational Setup)”
“Educational View: Gap-Up Premium Showing Sustained Buying Pressure”
✅ Disclaimer
“For educational purposes only”
“No guaranteed outcome”
“Use your own confirmation”

Introduction to Futures HedgingUnderstanding Futures Contracts
A futures contract is a standardized legal agreement to buy or sell an asset at a predetermined price at a specified future date. These contracts are traded on organized exchanges, ensuring liquidity, transparency, and regulatory oversight. The underlying asset in a futures contract could be a physical commodity such as crude oil, wheat, or gold, or a financial instrument like an index, bond, or currency.
Futures contracts have key characteristics:
Standardization: The contract specifies the quantity, quality, and delivery date of the underlying asset.
Margin Requirements: Traders must maintain a margin—a fraction of the contract value—to enter into futures positions.
Mark-to-Market: Gains and losses are settled daily based on the contract’s market value.
Leverage: Futures allow traders to control large positions with relatively small capital, magnifying both potential gains and losses.
These features make futures contracts ideal tools for hedging because they provide predictability and protection against price volatility.
The Concept of Hedging
Hedging is the practice of taking an investment position in one market to offset potential losses in another. In essence, it acts like insurance: while it may limit potential profits, it also minimizes exposure to losses. There are two main types of hedging:
Long Hedge: Used when a business anticipates purchasing an asset in the future and wants to lock in the current price to avoid rising costs.
Example: An airline expects to buy jet fuel in six months. To protect against rising fuel prices, it can buy futures contracts now at the current price. If fuel prices rise, the gain on the futures contract offsets the higher cost of purchasing fuel in the future.
Short Hedge: Used when a business holds an asset and wants to protect against falling prices.
Example: A wheat farmer expects to harvest in three months. To avoid losses if wheat prices fall, the farmer can sell wheat futures contracts now. If the price drops, the profit on the futures contract compensates for the lower market price of the physical wheat.
By employing hedging strategies, both buyers and sellers can stabilize cash flows and plan their operations with more certainty.
Importance of Futures Hedging
Risk Management: The primary objective of futures hedging is to manage price risk. Businesses in agriculture, energy, metals, and finance frequently use futures to minimize the impact of adverse price movements.
Price Discovery: Futures markets facilitate price discovery, reflecting expectations of supply and demand. Hedgers benefit by gaining insight into future price trends.
Financial Stability: Hedging provides stability to earnings and costs. For companies with significant exposure to commodity or currency fluctuations, this stability supports strategic planning, investment, and growth.
Speculation Reduction: By hedging, companies avoid excessive exposure to speculation-driven market movements, focusing instead on their core business operations.
Enhanced Creditworthiness: Companies with effective hedging programs are viewed as financially prudent by lenders and investors, improving access to capital.
Mechanics of Futures Hedging
Hedging with futures involves several steps:
Identify the Exposure: Determine which assets, commodities, or financial instruments are exposed to price risk.
Select the Appropriate Futures Contract: Choose a futures contract that closely matches the underlying asset in terms of quantity, quality, and timing.
Decide the Hedge Ratio: The hedge ratio determines the number of futures contracts needed to offset the risk. Perfect hedges are rare; often, partial hedges are employed to balance risk reduction and cost.
Enter the Futures Position: Buy or sell futures contracts depending on whether a long or short hedge is appropriate.
Monitor and Adjust: As market conditions change, hedgers must monitor their positions and adjust contracts to maintain effective risk coverage.
Close or Offset the Hedge: Futures contracts can be offset before expiration by taking an opposite position or allowed to expire if physical delivery aligns with the hedger’s requirements.
Examples of Futures Hedging
1. Agricultural Hedging:
A corn farmer expects to harvest 10,000 bushels in four months. Concerned about falling prices, the farmer sells corn futures contracts now. When harvest time arrives, even if the market price has dropped, the farmer’s futures gains compensate for the lower sale price, ensuring financial stability.
2. Corporate Hedging:
A multinational company expects to receive €5 million in payments in six months but operates primarily in USD. To protect against EUR/USD exchange rate fluctuations, the company sells euro futures contracts. If the euro depreciates, gains on the futures offset the reduced dollar value of the payment.
3. Commodity Hedging:
An airline hedges against rising fuel costs by buying crude oil futures. If oil prices increase, the gain on the futures contracts compensates for higher fuel costs, helping maintain profitability.
Advantages of Futures Hedging
Predictable Cash Flows: Hedging reduces uncertainty in revenue and costs.
Flexibility: Futures can be tailored to different commodities, currencies, or indices.
Liquidity: Exchange-traded futures offer easy entry and exit.
Leverage: Efficient capital use allows risk management without tying up large amounts of money.
Transparency: Prices are visible and regulated, reducing counterparty risk.
Limitations of Futures Hedging
Basis Risk: The futures price may not move perfectly in line with the underlying asset, resulting in imperfect hedges.
Cost: Margins and transaction fees add to the cost of hedging.
Limited Profit Potential: Hedging locks in prices, reducing the opportunity to benefit from favorable market movements.
Complexity: Understanding contract specifications, hedge ratios, and market dynamics requires expertise.
Over-hedging Risk: Using excessive futures positions can create unintended exposure and losses.
Conclusion
Futures hedging is a vital risk management tool in modern financial and commodity markets. It allows businesses and investors to stabilize cash flows, plan effectively, and mitigate losses arising from adverse price movements. By understanding the mechanics, advantages, and limitations of futures contracts, market participants can use hedging strategies to navigate volatile markets with confidence. While futures hedging does not eliminate risk entirely, it transforms unpredictable market movements into manageable financial outcomes, fostering greater stability and strategic decision-making.
In an increasingly globalized and interconnected economy, the role of futures hedging has expanded beyond traditional commodities to include financial instruments, currencies, and indices. Companies, investors, and financial institutions that employ well-structured hedging strategies are better positioned to withstand market shocks, protect their profitability, and achieve long-term growth.
“Nifty 50 Intraday Key Levels | Buy & Sell Zones 4th Nov 2025”Want to learn more? Like this post and follow me!”
26070🔴 Above 10m closing Shot Cover Level
Strong resistance — short covering likely above this.
25938🟠 Below 10m hold PE By level /
Above 10m hold CE by level
25838🟣 Above 10M hold positive trade view
Below 10M hold negative trade view
Sentiment deciding level — crucial for trend direction.
25722⚫ Above Opening S1 10m Hold CE By level
Bullish entry level — CE hold area.
25633🟠 Below Opening R1 10m Hold PE By level
Below 10m hold PE By Risky Zone Weak zone — PE may strengthen below this.
25530🟢 Above 10M hold CE By Safe Zone level
Safe bullish zone — CE can be held confidently above.
25490🔵 BELOW 10M hold UNWINDING level
Breakdown zone — unwinding or heavy selling possible below.

“Nifty 50 Intraday Key Levels | Buy & Sell Zones 31th Oct 2025”Want to learn more? Like this post and follow me!”
26240🔴 Above 10m closing Shot Cover Level
Strong resistance — short covering likely above this.
26080🟠 Below 10m hold PE By level /
Above 10m hold CE by level
25980🟣 Above 10M hold positive trade view
Below 10M hold negative trade view
Sentiment deciding level — crucial for trend direction.
25818⚫ Above Opening S1 10m Hold CE By level
Bullish entry level — CE hold area.
25690🟠 Below Opening R1 10m Hold PE By level
Below 10m hold PE By Risky Zone Weak zone — PE may strengthen below this.
25490🟢 Above 10M hold CE By Safe Zone level
Safe bullish zone — CE can be held confidently above.
25470🔵 BELOW 10M hold UNWINDING level
Breakdown zone — unwinding or heavy selling possible below.

“Nifty 50 Intraday Key Levels | Buy & Sell Zones 29th Oct 2025”“Want to learn more? Like this post and follow me!”
26233🔴 Above 10m closing Shot Cover Level
Strong resistance — short covering likely above this.
26138🟠 Below 10m hold PE By level /
Above 10m hold CE by level
26028🟣 Above 10M hold positive trade view
Below 10M hold negative trade view
Sentiment deciding level — crucial for trend direction.
25913⚫ Above Opening S1 10m Hold CE By level
Bullish entry level — CE hold area.
25828🟠 Below Opening R1 10m Hold PE By level
Below 10m hold PE By Risky Zone Weak zone — PE may strengthen below this.
25690🟢 Above 10M hold CE By Safe Zone level
Safe bullish zone — CE can be held confidently above.
25670🔵 BELOW 10M hold UNWINDING level
Breakdown zone — unwinding or heavy selling possible below.

“Nifty 50 Intraday Key Levels | Buy & Sell Zones 20th Oct 2025”“Want to learn more? Like this post and follow me!”
26170 🔴 Above 10m closing Shot Cover Level
Strong resistance — short covering likely above this.
26033 🟠 Below 10m hold PE By level /
Above 10m hold CE by level
25923 🟣 Above 10M hold positive trade view
Below 10M hold negative trade view
Sentiment deciding level — crucial for trend direction.
25818 ⚫ Above Opening S1 10m Hold CE By level
Bullish entry level — CE hold area.
25730 🟠 Below Opening R1 10m Hold PE By level
Below 10m hold PE By Risky Zone Weak zone — PE may strengthen below this.
25618 🟢 Above 10M hold CE By Safe Zone level
Safe bullish zone — CE can be held confidently above.
25610 🔵 BELOW 10M hold UNWINDING level
Breakdown zone — unwinding or heavy selling possible below.

“Nifty 50 Intraday Key Levels | Buy & Sell Zones 20th Oct 2025”“ Want to learn more? Like this post and follow me!”
23133 🔴 Above 10m closing Shot Cover Level
Strong resistance — short covering likely above this.
25933 🟠 Below 10m hold PE By level /
Above 10m hold CE by level
25770 🟣 Above 10M hold positive trade view
Below 10M hold negative trade view
Sentiment deciding level — crucial for trend direction.
25620 ⚫ Above Opening S1 10m Hold CE By level
Bullish entry level — CE hold area.
25520 🟠 Below Opening R1 10m Hold PE By level
Below 10m hold PE By Risky Zone Weak zone — PE may strengthen below this.
25138 🟢 Above 10M hold CE By Safe Zone level
Safe bullish zone — CE can be held confidently above.
25120 🔵 BELOW 10M hold UNWINDING level
Breakdown zone — unwinding or heavy selling possible below.

“Nifty 50 Intraday Key Levels | Buy & Sell Zones 17th Oct 2025”“Want to learn more? Like this post and follow me!”
25832 🔴 Above 10m closing Shot Cover Level
Strong resistance — short covering likely above this.
25720 🟠 Below 10m hold PE By level /
Above 10m hold CE by level
25623 🟣 Above 10M hold positive trade view
Below 10M hold negative trade view
Sentiment deciding level — crucial for trend direction.
25523 ⚫ Above Opening S1 10m Hold CE By level
Bullish entry level — CE hold area.
25433 🟠 Below Opening R1 10m Hold PE By level
Below 10m hold PE By Risky Zone Weak zone — PE may strengthen below this.
25327 🟢 Above 10M hold CE By Safe Zone level
Safe bullish zone — CE can be held confidently above.
25318 🔵 BELOW 10M hold UNWINDING level
Breakdown zone — unwinding or heavy selling possible below.

“Nifty 50 Intraday Key Levels | Buy & Sell Zones 16th Oct 2025”“Want to learn more? Like this post and follow me!”
25580 🔴 Above 10m closing Shot Cover Level
Strong resistance — short covering likely above this.
25433 🟠 Below 10m hold PE By level /
Above 10m hold CE by level
25370 🟣 Above 10M hold positive trade view
Below 10M hold negative trade view
Sentiment deciding level — crucial for trend direction.
25280 ⚫ Above Opening S1 10m Hold CE By level
Bullish entry level — CE hold area.
25170 🟠 Below Opening R1 10m Hold PE By level
Below 10m hold PE By Risky Zone Weak zone — PE may strengthen below this.
24990🟢 Above 10M hold CE By Safe Zone level
Safe bullish zone — CE can be held confidently above.
24980🔵 BELOW 10M hold UNWINDING level
Breakdown zone — unwinding or heavy selling possible below.

“Nifty 50 Intraday Key Levels | Buy & Sell Zones 15th Oct 2025”“Want to learn more? Like this post and follow me!”
25433 🔴 Above 10m closing Shot Cover Level
Strong resistance — short covering likely above this.
25280 🟠 Below 10m hold PE By level /
Above 10m hold CE by level
25170 🟣 Above 10M hold positive trade view
Below 10M hold negative trade view
Sentiment deciding level — crucial for trend direction.
25080 ⚫ Above Opening S1 10m Hold CE By level
Bullish entry level — CE hold area.
24980 🟠 Below Opening R1 10m Hold PE By level
Below 10m hold PE By Risky Zone Weak zone — PE may strengthen below this.
24790 🟢 Above 10M hold CE By Safe Zone level
Safe bullish zone — CE can be held confidently above.
24970 🔵 BELOW 10M hold UNWINDING level
Breakdown zone — unwinding or heavy selling possible below.

“Nifty 50 Intraday Key Levels | Buy & Sell Zones 13th Oct 2025”“Want to learn more? Like this post and follow me!”
25473 🔴 Above 10m closing Shot Cover Level
Strong resistance — short covering likely above this.
25370 🟠 Below 10m hold PE By level /
Above 10m hold CE by level
25283 🟣 Above 10M hold positive trade view
Below 10M hold negative trade view
Sentiment deciding level — crucial for trend direction.
25120 ⚫ Above Opening S1 10m Hold CE By level
Bullish entry level — CE hold area.
24990 🟠 Below Opening R1 10m Hold PE By level
Below 10m hold PE By Risky Zone Weak zone — PE may strengthen below this.
24790 🟢 Above 10M hold CE By Safe Zone level
Safe bullish zone — CE can be held confidently above.
24770 🔵 BELOW 10M hold UNWINDING level
Breakdown zone — unwinding or heavy selling possible below.

“Nifty 50 Intraday Key Levels | Buy & Sell Zones 9th Oct 2025”“Want to learn more? Like this post and follow me!”
25278🔴 Above 10m closing Shot Cover Level
Strong resistance — short covering likely above this.
25178🟠 Below 10m hold PE By level /
Above 10m hold CE by level
25078🟣 Above 10M hold positive trade view
Below 10M hold negative trade view
Sentiment deciding level — crucial for trend direction.
24980⚫ Above Opening S1 10m Hold CE By level
Bullish entry level — CE hold area.
24890🟠 Below Opening R1 10m Hold PE By level
Below 10m hold PE By Risky Zone Weak zone — PE may strengthen below this.
24780🟢 Above 10M hold CE By Safe Zone level
Safe bullish zone — CE can be held confidently above.
24,770 🔵 BELOW 10M hold UNWINDING level
Breakdown zone — unwinding or heavy selling possible below.

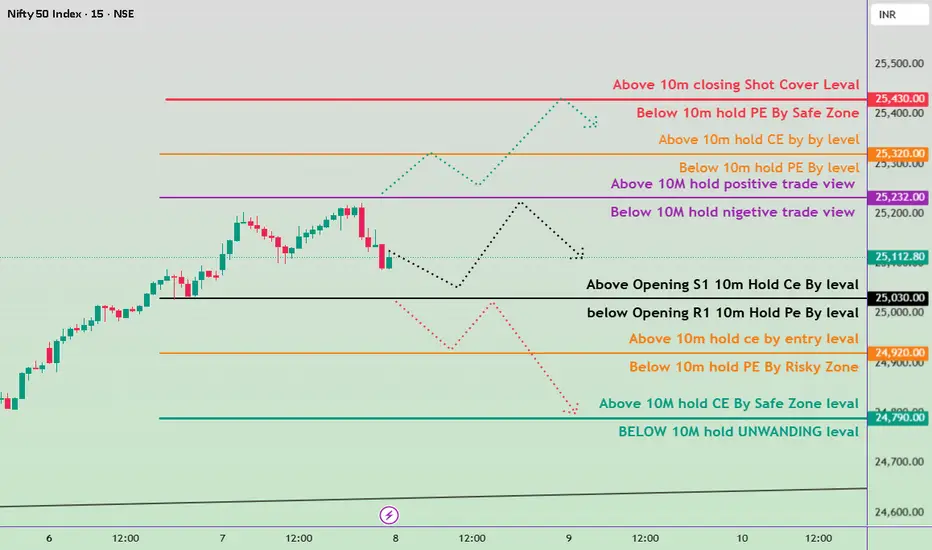
“Nifty 50 Intraday Key Levels | Buy & Sell Zones 8th Oct 2025”“Want to learn more? Like this post and follow me!”
25430 🔴 Above 10m closing Shot Cover Level
Strong resistance — short covering likely above this.
25320 🟠 Below 10m hold PE By level /
Above 10m hold CE by level
25232 🟣 Above 10M hold positive trade view
Below 10M hold negative trade view
Sentiment deciding level — crucial for trend direction.
25030 ⚫ Above Opening S1 10m Hold CE By level
Bullish entry level — CE hold area.
24920🟠 Below Opening R1 10m Hold PE By level
Below 10m hold PE By Risky Zone Weak zone — PE may strengthen below this.
24790🟢 Above 10M hold CE By Safe Zone level
Safe bullish zone — CE can be held confidently above.
24,780 🔵 BELOW 10M hold UNWINDING level
Breakdown zone — unwinding or heavy selling possible below.
“Nifty 50 Intraday Key Levels | Buy & Sell Zones 7th Oct 2025”“Want to learn more? Like this post and follow me!”
25,370 🔴 Above 10m closing Shot Cover Level
Strong resistance — short covering likely above this.
25,233 🟠 Below 10m hold PE By level /
Above 10m hold CE by level
25,128 🟣 Above 10M hold positive trade view
Below 10M hold negative trade view
Sentiment deciding level — crucial for trend direction.
24,990 ⚫ Above Opening S1 10m Hold CE By level
Bullish entry level — CE hold area.
24,890 🟠 Below Opening R1 10m Hold PE By level
Below 10m hold PE By Risky Zone Weak zone — PE may strengthen below this.
24,770 🟢 Above 10M hold CE By Safe Zone level
Safe bullish zone — CE can be held confidently above.
24,700 🔵 BELOW 10M hold UNWINDING level
Breakdown zone — unwinding or heavy selling possible below.

“Nifty 50 Intraday Key Levels | Buy & Sell Zones” 6th Oct 2025Key Levels for Tomorrow:
25,120 → Above 10m closing Short Cover Level (CE Safe Zone)
Below 10m hold PE (Risky Zone)
25,023 → Above 10m hold CE (Entry Level)
Below 10m hold PE (Risky Zone)
24930 → Above 10m hold → Positive Trade View
Below 10m hold → Negative Trade View
24,820 → Above Opening S1 hold CE (Buy Level)
Below Opening R1 hold PE (Sell Level)
24,690 → Above 10m hold CE (Buy Level)
Below 10m hold PE (Sell Level)
24,590 → Above 10m hold CE (Safe Zone)
Below 10m hold UNWINDING Level

“Nifty 50 Intraday Key Levels | Buy & Sell Zones” 3rd Oct 2025“Want to learn more? Like this post and follow me!”
25,073 → Above 10m closing Shot Cover Level
25,070 → Below 10m hold PE By Safe Zone
24,988 → Above 10m hold CE By Entry Level
24,980 → Below 10m hold PE By Risky Zone
24,888 → Above 10m hold Positive Trade View
24,790 → Above Opening S1 hold CE / Below Opening R1 hold PE
24,690 → Above 10m hold CE By Level / Below 10m hold PE By Level
24,590 → Above 10m hold CE By Safe Zone
24,580 → Below 10m hold Unwinding Level

“Nifty 50 Key Levels & Trade Zones 1st Oct 2025”
“Follow me and like this post for more learning tips!”
24890 → Above 10m closing → Short Cover Level (CE Safe Zone)
24790 → Above 10m hold CE (Entry Level)
Below 10m hold PE (Risky Zone)
24718 → Above 10m hold → Positive Trade View
Below 10m hold → Negative Trade View
24570 → Above Opening S1 hold CE (Buy Level)
Below Opening R1 hold PE (Sell Level)
24470 → Above 10m hold CE (Buy Level)
Below 10m hold PE (Sell Level)
24333 → Above 10m hold CE (Safe Zone)
Below 10m hold UNWINDING Level
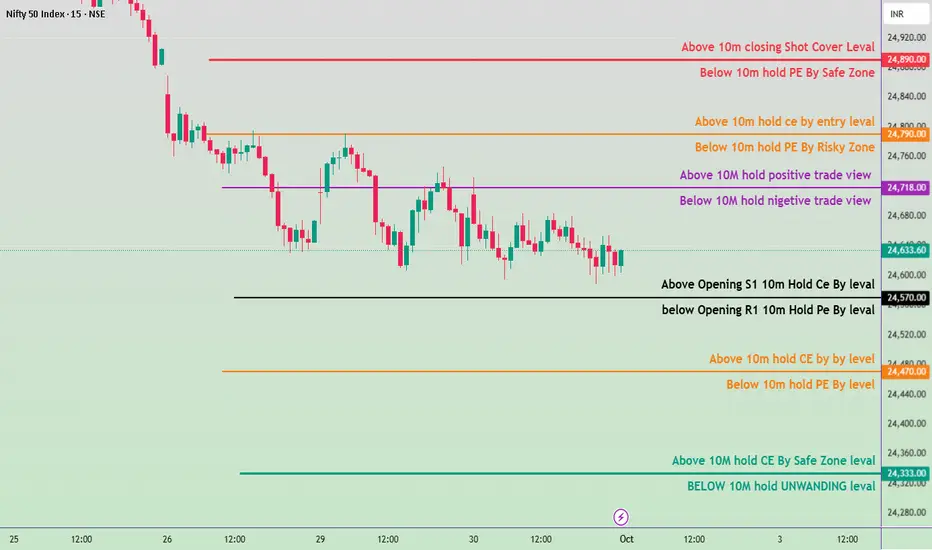
“Nifty 50 Key Levels & Trade Zones – 30th Sept 2025”
“Follow me and like this post for more learning tips!”
Key Levels from the Chart
24,890 – Above 10M Closing Shot Cover Level
24,820 –Above 10M Hold CE by Entry Level
Below 10M Hold PE by Risky Zone
24,722 –Above 10M Hold Positive Trade View
Below 10M Hold Negative Trade View
24,590 –Above Opening S1 10M Hold CE by Level
Below Opening R1 10M Hold PE by Level
24,470 –Above 10M Hold CE by Level
Below 10M Hold PE by Level
24,370 –Above 10M Hold CE by Safe Zone Level
Below 10M Hold Unwinding Level

“Nifty 50 Key Levels & Trade Zones – 29th Sept 2025”“Follow me and like this post for more learning tips!”
24,870 → Above 10m closing Shot Cover Level
24,870 → Below 10m hold PE By Safe Zone
24,778 → Above 10m hold CE By Entry Level
24,770 → Below 10m hold PE By Risky Zone
24,718 → Above 10m hold Positive Trade View
24,718 → Below 10m hold Negative Trade View
24,620 → Above Opening S1 10m hold CE By Level
24,620 → Below Opening R1 10m hold PE By Level
24,520 → Above 10m hold CE By Level
24,520 → Below 10m hold PE By Level
24,418 → Above 10m hold CE By Safe Zone Level
24,418 → Below 10m hold Unwinding Level

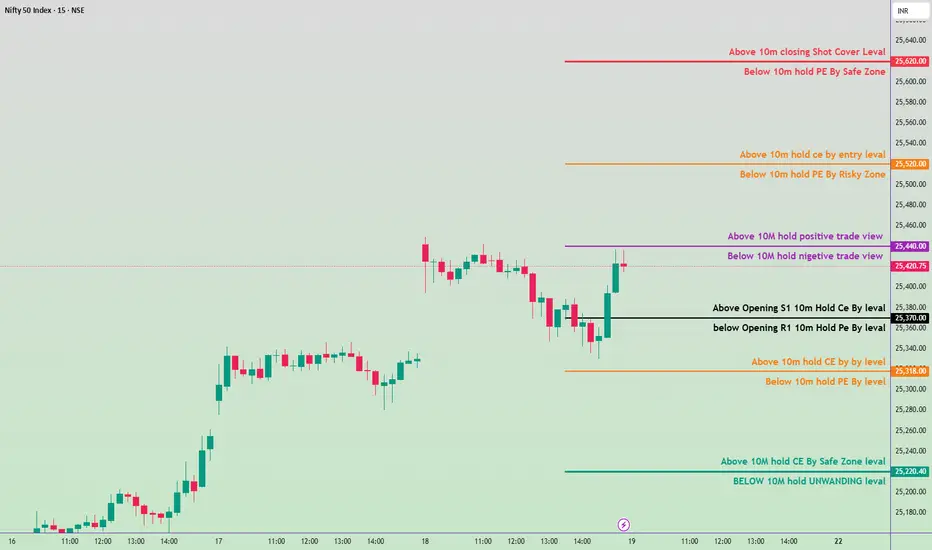
19Sep 2025 Nifty50 trading levelKey Levels
25,623 → Above 10m closing Short Cover Level
25,612 → Below 10m hold PE by Safe Zone
25,530 → Above 10m hold CE by Entry Level
25,520 → Below 10m hold PE by Risky Zone
25,440 → Above 10m hold Positive Trade View
25,430 → Below 10m hold Negative Trade View
25,370 → Below Opening R1 10m Hold PE By Level
25,380 → Above Opening S1 10m Hold CE By Level
25,323 → Above 10m Hold CE By Level
25,316 →Below 10m Hold PE By Level
25,223 → Above 10m hold CE by Safe Zone Level
25,216→ Below 10m hold Unwinding Level
18 sep 2025 support–resistance trading plan Key Levels
25,518 → Above 10m Closing Short Cover Level
(If sustained above, short covering possible)
25,500 Zone → Below 10m Hold PE Safe Zone
25,420 → Above 10m Hold CE Entry Level
Below 10m Hold PE Risky Zone
25,333 → Above 10m Hold Positive Trade View
Below 10m Hold Negative Trade View
25,270 → Above Opening S1 10m Hold CE Buy Level
Below Opening R1 10m Hold PE Buy Level
25,170 → Above 10m Hold CE Buy Level
Below 10m Hold PE Buy Level
25,070 – 25,060 →
25,070 = Above 10m Hold CE Safe Zone
25,060 = Below 10m Hold UNWINDING Level

Nifty 50 Index trading levels Key Levels
25,130 → Above 10m closing Shot Cover Level
Below 10m Hold PE by Safe Zone
24,970 → Above 10m Hold CE by Entry Level
Below 10m Hold PE by Risky Zone
24,821 → Above 10m Hold Positive Trade View
Below 10m Hold Negative Trade View
24,678 → Above Opening S1 10m Hold CE by Level
Below Opening R1 10m Hold PE by Level
24,570 → Above 10m Hold CE by By Level
Below 10m Hold PE by Level
24,380 → Above 10m Hold CE by Safe Zone Level
Below 10m Hold UNWINDING Level
