SBI Price Action & Option Opportunity State Bank of India (SBI) is once again respecting its well-defined range on the daily chart, with price consolidating between the ₹780 and ₹840 support-resistance zone. Today, SBI closed at ₹807.85, down -1.05%, continuing its oscillation within this horizontal channel.
The chart shows potential for a bounce from the lower boundary near ₹800, with a dotted path illustrating a possible move back toward resistance. Traders may look for confirmation of reversal before initiating new long trades as the range continues to hold.
On the options side, the 30 SEP 2025 PUT 810 contract surged 41.67% today, closing at ₹13.60. This strike has given a move of ₹2.75 (over 20%) recently. This sudden spike suggests rising bearish sentiment or hedging activity, but also hints at possible premium profit-taking if SBI holds above support.
Trading Plan
Monitor SBI near ₹800 for signs of reversal or breakdown.
Long positions can target ₹840 if support holds, with stops below ₹780.
PUT options holders should watch for profit booking if a bounce appears.
Optiontrading

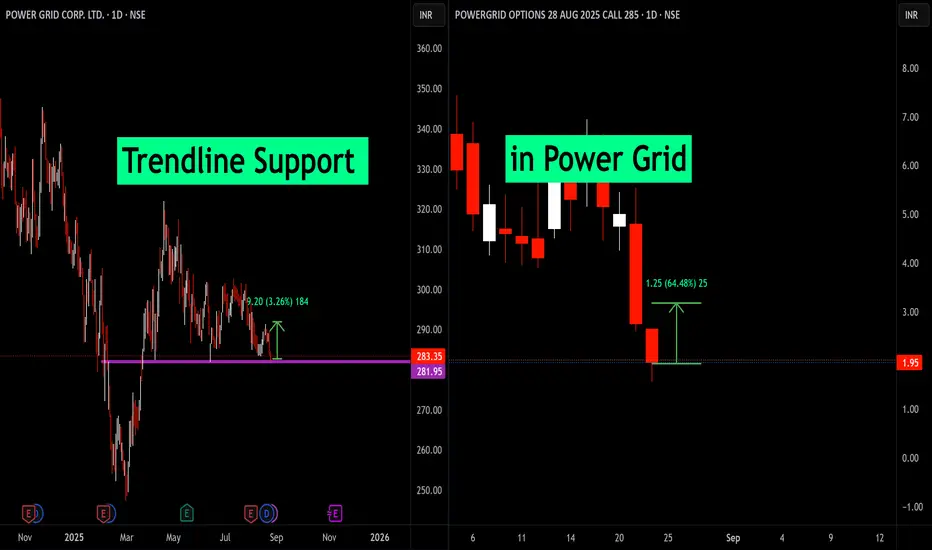
Trendline Support in Power grid On the daily chart, Power Grid has once again tested its long-held trendline support zone near ₹282–284. This level has acted as a reliable demand area in the past, and today’s price action showed another strong reaction.
Price rebounded +3.26% from the support, confirming active buyers at this zone.
In the derivatives segment, the 285 CE (28 Aug 2025 expiry) option also responded sharply, rallying +64% intraday from its recent low.
This confluence between cash price action and option movement highlights the strength of this support zone.
📌 Trading Viewpoint:
As long as the ₹282 level holds, short-term bullish momentum could sustain. A decisive break below, however, would negate this setup and invite further downside.
August 13, 2025 trading plan prediction for tomorrow24,728 –
Above: 10m closing → Short Cover Zone.
Below: 10m hold PE → Safe Zone for Puts.
24,628 –
Above: 10m hold CE → Entry Level for Calls.
Below: 10m hold PE → Risky Zone for Puts.
24,528 –
Above: Positive trade bias.
Below: Negative trade bias.
24,428 –
Above Opening S1: 10m hold CE → Bullish bias.
Below Opening R1: 10m hold PE → Bearish bias.
24,330 –
Above: 10m hold CE → Buy Level for Calls.
Below: 10m hold PE → Sell Level for Puts.
24,210 –
Above: 10m hold CE → Safe Zone for Calls.
Below: 10m hold → Unwinding Level.
24,173 –
Day UP Fibonacci Support 0.382.

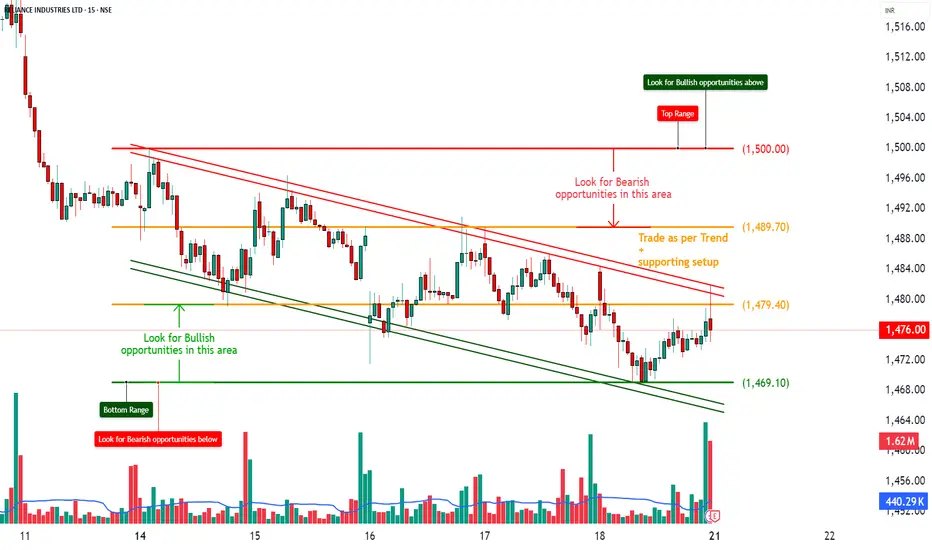
RELIANCE – Positive Outlook Post Q1 Results with Bullish OI________________________________________________________________________________📈 RELIANCE – Positive Outlook Post Q1 Results with Bullish OI Confirmation
📅 Setup Date: 17.07.2025 | ⏱ Timeframe: Daily
📍 Strategy: Post-Earnings Momentum Setup with Defined Risk
________________________________________________________________________________
🔍 Overall View
Spot Price: ₹1476
Q1 Result Update: Profit ↑12% YoY, beat estimates — strong earnings trigger
Trend: Bullish Reversal – Price holding above 1470 with fresh long build-up in CEs
Volatility: IV ~23–27%, stable to slightly rising → good for directional plays
Ideal Strategy Mix: Bullish directional spreads or high delta long CE
________________________________________________________________________________
1️⃣ Bullish Trade
Best CE: Buy 1480 CE @ ₹25.15
Why:
• Long Build-Up (+60.38% OI) with price ↑3.5% — strong institutional buying
• At-the-money with delta 0.50 → responsive to price movement
• High OI (27.5 lakh) with active volumes confirms smart money activity
• Matches post-result momentum — ideal CE for breakout strategy
________________________________________________________________________________
2️⃣ Bearish Trade (Contrarian)
Best PE: Sell 1450 PE @ ₹10.75
Why:
• Short Covering seen (-5.57% OI) → downside hedge positions getting closed
• Price ↑3.3% and IV stable (22.36%) → premium erosion favorable
• Spot is comfortably above ₹1450, providing buffer
• Rests below key support zone post-result → limited downside expectation
________________________________________________________________________________
3️⃣ Strategy Trade (As per trend + OI data)
Strategy: Bull Call Spread → Buy 1480 CE / Sell 1520 CE
→ ₹25.15 / ₹8.85
Net Debit: ₹16.30
Max Profit: ₹40 – ₹16.30 = ₹23.70
Max Loss: ₹16.30
Risk:Reward: ≈ 1 : 1.45 ✅
Lot Size: 500
Total Risk: ₹8,150
Max Profit: ₹11,850
📊 Breakeven Point: ₹1496.30
📉 Exit If: Spot closes below ₹1465 (invalidates CE strength and post-result optimism)
________________________________________________________________________________
Why:
• Strong Q1 numbers + fresh long build-up on 1480 CE and 1470 CE
• 1520 CE also active but minor short covering = good candidate to sell
• IVs are moderate, giving clean pricing for spreads
• Defined risk, R:R > 1:1, and positive delta makes this strategy safer
________________________________________________________________________________
📘 My Trading Setup Rules
Avoid Gap Plays
→ Check pre-open price action to avoid trades influenced by gap-ups/gap-downs.
Breakout Entry Only
→ Enter trades only if price breaks previous day’s High (for bullish trades) or Low (for bearish trades).
Watch Volume for Confirmation
→ Monitor volume closely. No volume = No trade.
Enter on Strong Candle + Volume
→ Execute the trade only if a strong candle appears with increasing volume in the direction of the trade.
Defined Risk:Reward Only
→ Take trades only if R:R is favourable (ideally ≥ 1:2).
Premium Disclaimer
→ Option premiums shown are based on EOD prices — real-time premiums may vary during execution.
Time Frame Preference
→ Trade with your preferred time frame — this strategy works across intraday or positional setups.
________________________________________________________________________________
⚠ Disclaimer (Please Read):
• These Trades are shared for educational purposes only and is not investment advice.
• I am not a SEBI-registered advisor.
• The information provided here is based on personal market observation.
• No buy/sell recommendations are being made.
• Please do your own research or consult a registered financial advisor before making any trading decisions.
• Trading involves risk. Always use proper risk management.
I am not responsible for trading decisions based on this post.
________________________________________________________________________________
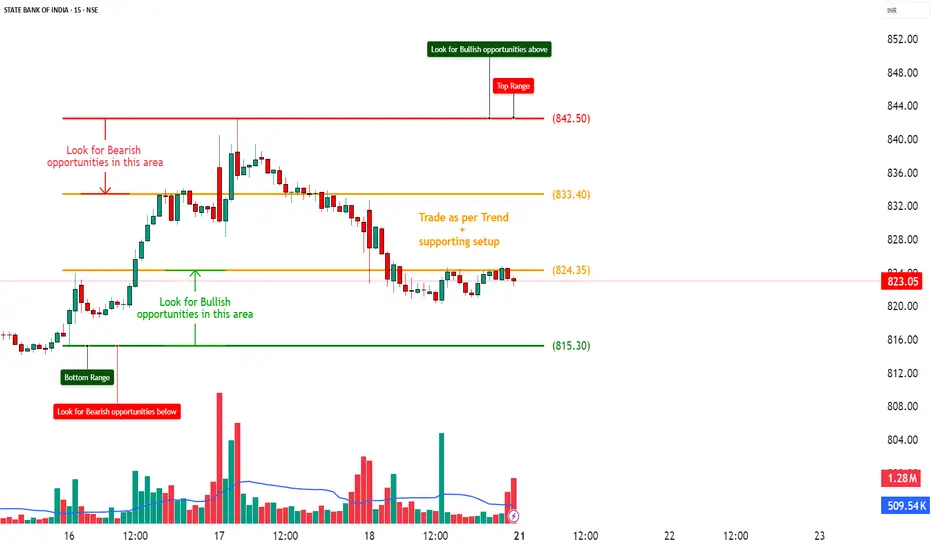
SBIN – Bearish Bias with Heavy CE Shorts and Weak Call Structure________________________________________________________________________________📈 SBIN – Bearish Bias with Heavy CE Shorts and Weak Call Structure
📅 Setup Date: 17.07.2025 | ⏱ Timeframe: Daily
📍 Strategy: Short-Term Bearish Momentum Setup with Defined Risk
________________________________________________________________________________
🔍 Overall View
Spot Price: ₹823.35
Trend: Mildly Bearish – Spot facing resistance at 830–840 with weak CE premiums
Volatility: IV ~18%–22% (stable to slightly elevated)
Ideal Strategy Mix: Bearish directional trades or credit spreads near resistance
________________________________________________________________________________
1️⃣ Bullish Trade (Contrarian Setup)
Best CE: Buy 820 CE @ ₹12.65
Why:
• ATM strike with highest delta (0.56) among CEs
• Smallest short build-up in CE chain (OI ↑0.73%, vs ~+4%–12% on other CEs)
• If spot reclaims 830+, this option will respond fastest
• IV is lowest (17.73%) = cheapest in premium vs other strikes
Contrarian Setup – Not ideal unless spot crosses 830 with strong volume
________________________________________________________________________________
2️⃣ Bearish Trade
Best PE: Buy 820 PE @ ₹8.65
Why:
• Strong Long Build-Up (+29.5% OI), volume-led spike (+46.6%)
• Solid delta (-0.44) with decent Vega → responds well to downside
• IV is relatively low (19.6%), allowing room for expansion
• Ideal strike as spot sits slightly above – quick delta pickup expected
________________________________________________________________________________
3️⃣ Strategy Trade (As per trend + OI data)
Strategy: Bear Put Spread → Buy 820 PE / Sell 800 PE
→ ₹8.65 / ₹3.00
Net Debit: ₹5.65
Max Profit: ₹20 – ₹5.65 = ₹14.35
Max Loss: ₹5.65
Risk:Reward: ≈ 1 : 2.54 ✅
Lot Size: 750
Total Risk: ₹4,237.50
Max Profit: ₹10,762.50
📊 Breakeven Point: ₹814.35
📉 Exit If: Spot closes above ₹832 (invalidates PE strength and bearish structure)
________________________________________________________________________________
Why:
• Heavy CE short build-up across 820–850 strikes (Bearish Call Ladder)
• 820 PE has strong long buildup + clean delta = momentum PE
• 800 PE still holding OI, good strike to sell for defined risk
• IVs are still in mid-range = spread cost low, R:R > 1:2.5
________________________________________________________________________________
📘 My Trading Setup Rules
Avoid Gap Plays
→ Check pre-open price action to avoid trades influenced by gap-ups/gap-downs.
Breakout Entry Only
→ Enter trades only if price breaks previous day’s High (for bullish trades) or Low (for bearish trades).
Watch Volume for Confirmation
→ Monitor volume closely. No volume = No trade.
Enter on Strong Candle + Volume
→ Execute the trade only if a strong candle appears with increasing volume in the direction of the trade.
Defined Risk:Reward Only
→ Take trades only if R:R is favourable (ideally ≥ 1:2).
Premium Disclaimer
→ Option premiums shown are based on EOD prices — real-time premiums may vary during execution.
Time Frame Preference
→ Trade with your preferred time frame — this strategy works across intraday or positional setups.
________________________________________________________________________________
⚠ Disclaimer (Please Read):
• These Trades are shared for educational purposes only and is not investment advice.
• I am not a SEBI-registered advisor.
• The information provided here is based on personal market observation.
• No buy/sell recommendations are being made.
• Please do your own research or consult a registered financial advisor before making any trading decisions.
• Trading involves risk. Always use proper risk management.
I am not responsible for trading decisions based on this post.
________________________________________________________________________________
12 August 2025 Nifty50 brekout and Breakdown leval1. Bullish Trade Plan (Call Side – CE)
Above 24,818 →
Strong upside breakout. Expect short covering rally; positional traders may hold CE.
Above 24,718 →
CE entry zone for swing/positional buying. Targets can be 24,818+ with trailing SL below 24,650.
Above 24,650 →
Market bias turns positive; intraday momentum likely to stay bullish. Can scalp CE with strict SL.
Above 24,432 (Opening S1) →
CE buy zone for intraday. Use for quick trades if supported by volume.
Above 24,350 →
CE buy trigger; minor bullish push possible. Keep SL just below level.
Above 24,220 →
CE safe zone; market sentiment remains positive unless price falls back below.
2. Bearish Trade Plan (Put Side – PE)
Below 24,818 →
First sign of weakness if rejection happens here; safe PE zone starts.
Below 24,718 →
Risky PE zone; may lead to quick downside movement if selling pressure builds.
Below 24,600 →
Intraday negative trade view; bears get control.
Below 24,400 (Opening R1) →
PE buy trigger for intraday shorts.
Below 24,330 →
Clear downside intraday setup; scalpers can enter PE with SL above level.
Below 24,200 →
Safe zone for PE; trend likely to continue down.
Below 24,170 →
Unwinding zone; fall may accelerate quickly to next supports.

5th August 2025 trade plan prediction🔼 Bullish Triggers
✅ Above 24,790 = Hold CE by positive trade view
✅ Above 24,920 = Strong bullish breakout (Entry zone for CE)
✅ Above 25,028 = Shot Cover Level → Upside acceleration likely
CE (Call Option) Strategy:
Buy CE above 24,790 for 24,920 / 25,000 targets
Add CE above 25,028 for quick upside move
🔽 Bearish Triggers
🔻 Below 24,700 = Slightly negative bias starts
🔻 Below 24,670 = Below Opening R1 → PE can be bought cautiously
🔻 Below 24,533 = Risk zone → Hold PE by level
🔻 Below 24,433 = UNWINDING zone → Strong bearish momentum
🔻 Below 25,000 = Safe Zone for PE if reversal happens from higher levels
PE (Put Option) Strategy:
Buy PE if breaks 24,670 for 24,533 / 24,433 targets
Add below 24,423 for deeper downside move

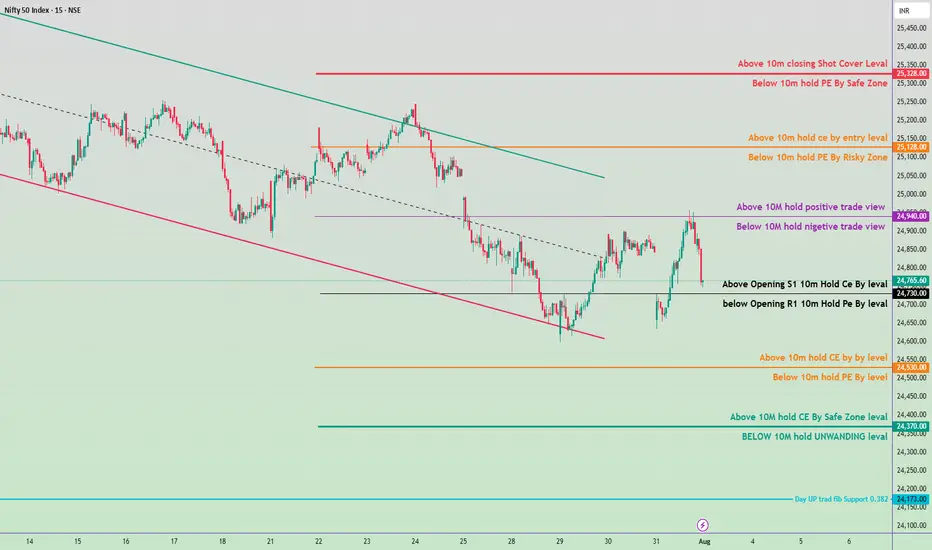
Trade Plan Description for Tomorrow August 1, 2025Bullish Zones & Strategy (Call / CE Levels)
Above 24,765 (Opening S1):
If price sustains above this, bias may shift positive.
🔹 Buy CE (Call) above this level with stop below S1.
Key Upside Resistance Levels:
24,940 – Above this, positive trade view builds (Strong CE Hold).
25,100 - 25,150 – CE entry & momentum zone.
25,350 - 25,382 – Shot Cover Zone (Strong resistance, book profit or expect reversal).
🔻 Bearish Zones & Strategy (Put / PE Levels)
Below 24,765:
Stay cautious – move toward bearish bias if price sustains below.
🔸 Buy PE (Put) below this level with stop above.
Key Downside Support Levels:
24,708 – R1 level; below this, PE strength increases.
24,550 - 24,500 – PE by-level zone.
24,370 – Safe Zone for PE traders.
24,173 - 24,130 – Unwinding + Fib Support.
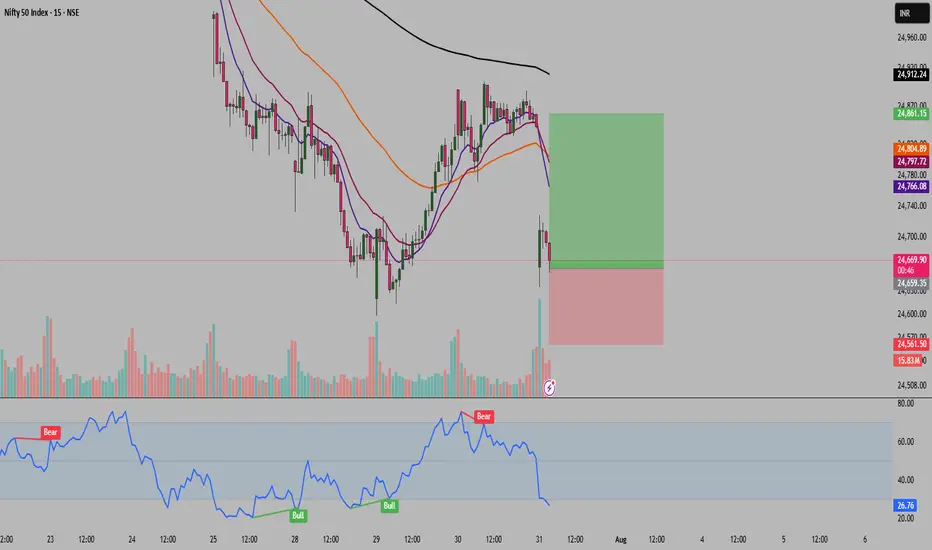
Trading the Dip: My Nifty Options Setup for This Gap Down MarketHello Traders!
Hope you all are doing good.
Today Nifty opened with a significant gap down. The reason? Fresh news about the US under Donald Trump’s policy imposing a 25% tariff on Indian goods. This triggered panic among investors, and we saw aggressive selling at the open.
But I believe this reaction could be short-lived. Local DIIs have been showing strong buying interest every single day, and I expect them to support the market again today. That’s why I’m looking for a potential intraday recovery from lower levels.
So instead of joining the panic, I’m planning a contra trade on Nifty.
Trade Setup: Buying naked Ce with stop loss
Buy Nifty 7th August 24650 CE, now at 180
Add 1 More lot around 155-160 levels if price dropss
Keep stop loss around 120
Targets will be 210/246/290++
Another Trade Setup: Options writing(selling) with hedging strategy
Bullish Iron Condor Setup (Neutral-to-Bullish View):
For traders who prefer risk-defined strategies, I’ve also deployed a bullish iron condor with a limited risk, targeting consolidation or moderate recovery by expiry.
Sell: 2x 25050 CE @ 44.45
Buy: 2x 25300 CE @ 17.30
Buy: 2x 24550 PE @ 103.60
Sell: 2x 24800 PE @ 217.95
Note:- All Strike from 7th Aug expiry
Key Metrics:
Max Profit: 21,225
Max Loss: 16,275
Breakeven Range: 24659 to 25191
Max RR Ratio: 1:1.3
Margin Required: ~2 lakhs Rs.
The idea here is to stay profitable if Nifty consolidates or mildly recovers over the next few sessions. If there’s no deep fall or sharp rally, this setup will benefit from theta decay and defined movement.
Risk Management Notes:
Strict stop loss is a must. Do not hold beyond SL under any condition
This is a contra trade, so avoid heavy positions
Recommended quantity: 1 or 3 lots only
Rahul Tip:
Market reacts fast to global headlines, but strong hands don’t panic. If your view is backed by logic and risk is managed, sometimes going against the crowd gives the best opportunities.
Conclusion:
The dip was sharp, but the reaction might be overdone. Let’s watch for signs of intraday strength. If buyers step in, this call option trade can work out well. Trade light, and trade with discipline.
Disclaimer: This idea is for educational purposes only. Do your own research before taking any trade.
Nifty 50 Intraday Trade Plan for tomorrow 28 july 2025📉 Resistance & PE Zones (For Short / PE Trades):
🔴 25,180 – Below 10M Hold PE by Safe Zone
Safe shorting zone if Nifty trades below this after a 10-minute hold.
🔴 25,030 – Below 10M Hold PE by Risky Zone
Entry for PE trades but more risky. Be cautious with volumes and market sentiment.
🟣 24,920 – Below 10M Hold = Negative Trade View
If Nifty holds below this, bias turns negative.
⚫ 24,780 – Below Opening R1 = 10M Hold PE by Level
Below this level, PE trades can be initiated with confirmation.
🟠 24,638 – Below 10M Hold PE by Level
Additional downside continuation level for PE holding.
🟢 24,480 – BELOW 10M Hold = UNWINDING Level
If price sustains below this, expect long unwinding and further decline.
🔵 24,173 – Day UP Trade Fib Support (0.382)
Major Fibonacci support; possible bounce zone or reversal area.
📈 Support & CE Zones (For Long / CE Trades):
🔴 25,200 – Above 10M Closing Shot Cover Level
Short covering possible if Nifty closes above this level.
🟠 25,030 – Above 10M Hold CE by Entry Level
Entry for long trades if 10M hold is confirmed.
🟣 24,920 – Above 10M Hold = Positive Trade View
Holding above this confirms bullish bias.
⚫ 24,800 – Above Opening S1 = 10M Hold CE by Level
Early confirmation level for long trades post opening.
🟠 24,638 – Above 10M Hold CE by Level
Intermediate support if market bounces from lower levels.
🟢 24,500 – Above 10M Hold CE by Safe Zone Level
Safer zone for holding long positions above this point.
✅ Key Levels Summary:
Bullish Above: 24,920 / 25,030 / 25,180
Bearish Below: 24,920 / 24,780 / 24,638 / 24,480
Major Support: 24,173 (Fib level)
Neutral Zone: Between 24,780–24,920 → Wait for breakout

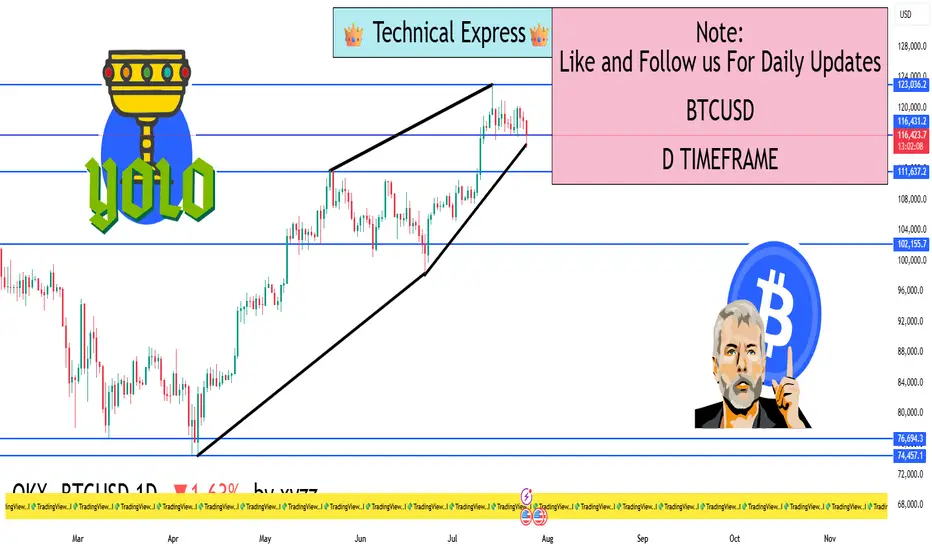
BTCUSD 1D Timeframe📈 BTC/USD 1D Timeframe Overview (as of Today)
Current Price: Around $116,100
Price Change: Down by approximately 2.1% from the previous close
Day’s High: Around $119,436
Day’s Low: Around $115,002
📊 Chart Analysis (1-Day Candle)
Each candle on the 1D chart represents one full day. Today’s candle shows:
Bearish Momentum: The candle is red, indicating sellers dominated.
Wick at Bottom: Suggests some buying pressure or support near the day's low.
Rejection from Highs: Price tried to go higher but failed, showing resistance near $119,400.
🔍 Key Support and Resistance Levels
Resistance Zone: $119,000 – $120,000 (recent highs)
Support Zone: $115,000 – $113,500 (demand area and previous consolidation)
If BTC breaks below the $115,000 support, it may test lower levels like $112,000 or $110,000. If it bounces, it could reattempt $120,000.
🧠 Technical Perspective (Daily View)
Trend: BTC is currently in a short-term pullback phase after a recent rally.
Structure: Higher lows are intact if it stays above $112,000, which suggests uptrend continuation.
Volume: Decreasing volume on red candles could mean weak selling — possible sign of reversal soon.
🔄 Daily Timeframe Strategy Insight
Swing Traders: Wait for bullish reversal candle or break above resistance to go long.
Breakout Traders: Watch if price breaks and closes above $120,000 for trend continuation.
Risk-averse Traders: Wait for confirmation of direction before entering (like bullish engulfing or hammer candle).
📉 Summary
BTC is showing short-term weakness but remains in a larger range.
$115,000 is the key short-term support, and $120,000 is the key resistance.
Watch for candle patterns, volume, and reaction at support/resistance zones.
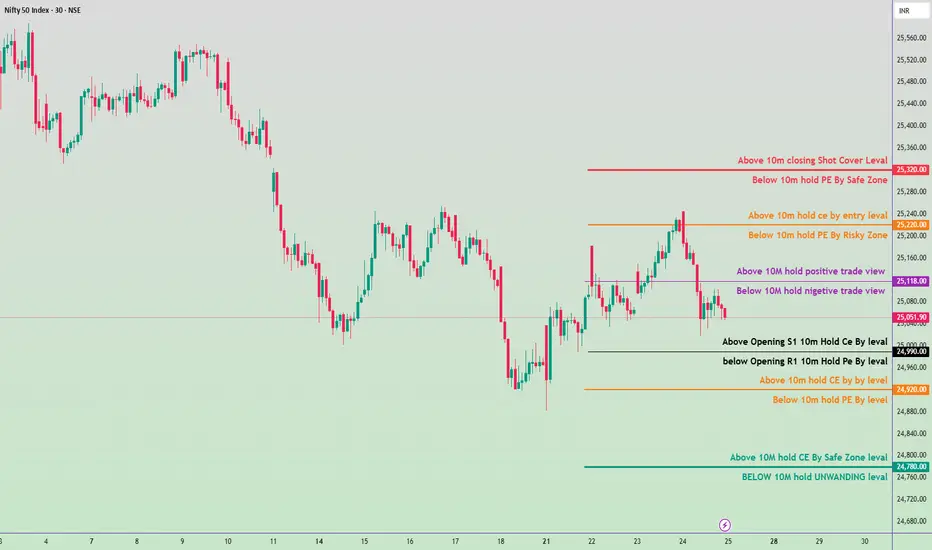
Nifty 50 Intraday Trade Plan for 25th July 2025🔍 Trade Zones & Strategy Breakdown:
🔴 Strong Resistance Zone:
25,320 – Above 10M Closing Short Cover Level
⚠️ If price moves above this level, expect short covering.
CE (Call Option) can be held with strict SL (stop loss) below 25,280.
🟠 Safe-to-Risky PE Holding Zone:
25,280 – Below 10M Hold PE by Safe Zone
25,220 – Below 10M Hold PE by Risky Zone
🟡 Between these levels is the PE (Put Option) hold zone with decreasing safety.
🟧 Entry CE Level (Low Risk Long Entry):
25,240 – Above 10M Hold CE by Entry Level
🟣 Neutral Zone / Trend View Levels :
25,118 – Above 10M → Positive Trade View
25,118 – Below 10M → Negative Trade View
👀 This is a sentiment-shifting level. Break above or below can set the trend for the day.
⚫ Opening Range Based Action:
24,990 – Above Opening S1 → Hold CE (Call Option)
24,990 – Below Opening R1 → Hold PE (Put Option)
🟨 R eversal/Entry Confirmation Area:
24,920 – Above 10M Hold CE by Level
24,880 – Below 10M Hold PE by Level
🟩 Support & Final Defense Zone:
24,800 – Above 10M Hold CE by Safe Zone
24,760 – BELOW 10M = Unwinding Level
⛔ If price falls below 24,760, aggressive unwinding or fresh PE (Put Option) entry possible.
Institutional Objectives in Options Trading🎯 1. Hedging Large Portfolios
One of the primary institutional goals is to protect investments from unfavorable market movements. Since institutions hold large quantities of stocks, they face massive risk if the market turns against them.
✅ Example:
A mutual fund holding ₹100 crore worth of Nifty 50 stocks might buy Put Options on Nifty to protect against a market crash.
This acts like insurance — a small premium is paid to avoid a huge loss.
🔹 This is called a protective put strategy.
📈 2. Generating Additional Income
Institutions also use options to generate consistent income. Since they often hold large amounts of shares, they can write (sell) options against these positions.
✅ Example:
Selling Covered Calls against stock holdings generates premium income, especially when expecting the market to remain sideways.
Writing Cash-Secured Puts allows them to earn premium while preparing to buy a stock at a lower price.
🔹 This enhances portfolio returns without needing to sell the core holdings.
📉 3. Managing Volatility Exposure
Volatility is a double-edged sword. Institutions analyze and trade implied volatility (IV) rather than just direction. They adjust their portfolios using options to profit from volatility changes or to reduce risk when volatility spikes.
✅ Common practices:
Use straddles and strangles before major events like earnings or elections.
Buy options when IV is low (expecting a spike) and sell options when IV is high (expecting it to drop).
🔹 This is called volatility arbitrage or vega trading.
🔁 4. Portfolio Adjustment and Rebalancing
Institutions use options to rebalance exposure without triggering capital gains taxes or disturbing existing stock positions.
✅ Example:
Instead of selling shares, an institution might:
Buy puts to reduce downside risk.
Sell calls to lock in profits.
Use spreads or collars to control price bands of risk/reward.
🔹 This helps in making tactical moves without liquidating long-term holdings.
💡 5. Directional Bets With Limited Risk
Though not their primary objective, institutions sometimes make directional bets using options for leveraged exposure, with defined risk.
✅ Example:
If a fund expects a strong upside in a stock, it might buy call options instead of the stock itself.
This reduces capital requirement and limits downside to the premium paid.
🔹 This is common in event-driven trading, such as earnings, mergers, or regulatory announcements.
🔄 6. Capital Efficiency
Institutions are under constant pressure to manage capital efficiently. Buying or selling options allows them to control larger positions with less money, keeping more capital available for other trades.
✅ Example:
Instead of buying 1,00,000 shares of a company, they might buy deep ITM call options to replicate stock movement with lower capital.
🔹 This is known as synthetic long exposure.
⚖️ 7. Risk Transfer and Insurance
Options allow institutions to transfer market risk to willing counterparties. They use customized derivatives or listed options to insure specific risks, such as:
Currency risk
Interest rate risk
Commodity price risk
Equity drawdowns
🔹 Large institutions like banks and insurance firms use over-the-counter (OTC) options for complex hedging.
🛠️ 8. Complex Strategy Execution
Institutions often use multi-leg strategies for market-neutral setups or for fine-tuned payoff structures. These include:
Iron Condors
Butterfly Spreads
Calendar/Diagonal Spreads
Box Spreads
Delta-neutral gamma scalping
🔹 These allow fine control over expected profits and losses, based on volatility, time decay, and price movement.

Nifty 50 Intraday Plan for July 23, 2025📌 For more insights & live explanations,
👉 Visit my YouTube channel – Click the icon above ☝️
🔺 Bullish Zones (Call Side - CE):
25,138 – Positive Trade View Start
If the market sustains above this level for 10 minutes, the sentiment turns positive.
Possible intraday up-move.
Look for CE entries.
25,260 – CE Entry Level
Strong confirmation of bullish breakout.
Entry point for aggressive CE buyers.
25,380 – Short Covering Zone
If price closes above this, short-sellers may exit in panic.
Expect a sharp up-move / breakout.
24,960 & 25,040 – CE Hold Zones
If holding CE positions, monitor these levels.
Supportive price areas where bulls may defend.
24,760 – Safe CE Zone
A very strong support zone.
If price bounces from here, good for fresh CE trades.
🔻 Bearish Zones (Put Side - PE):
25,120 – Negative Trade View
If price breaks this level and stays below 10 mins, bias turns bearish.
25,018 – Opening R1 PE Hold
Below this, market may gain bearish strength.
Short trades may get active.
24,938 – PE Hold Level
Important support zone.
Break here can give aggressive PE momentum.
24,700 – Unwinding Level
If price sustains below this, it can trigger long unwinding.
Strong bearish continuation expected.

Nifty 50 Intraday Plan for July 22, 2025🔼 Bullish Levels (Call Side - CE):
Above 25,038 : If the market opens and sustains above this level for 10 minutes, you can consider buying CE. This is the first breakout point, indicating possible upward movement.
Above 25,128: Holding above this level indicates a positive trade view. Momentum is expected to increase, and buyers may become more aggressive. Good zone to initiate or add to CE positions.
Above 25,260 : This is the CE entry level where breakout confirmation happens. If price reaches and sustains this zone, it signals strong bullish strength.
Above 25,380 : This is marked as the short-covering zone. If the price reaches here, it means many short traders may exit, creating a spike. Ideal for booking profits on CE trades.
🔽 Bearish Levels (Put Side - PE):
Below 25,038 : If the price fails to sustain above this level and breaks down with 10-minute candle confirmation, it indicates weakness. PE trades can be considered from here.
Below 24,938 : This level is a clear PE entry level. Sustained trading below this suggests downward continuation.
Below 24,920 : This is the risky PE zone. If the market trades here, PE positions should be handled with caution unless strong selling pressure is seen.
Below 24,800 : This is a safe PE zone. Breakdown below this signals confirmed bearish sentiment, and you can aggressively hold PE options.
Below 24,780 : This is the unwinding level, meaning big players may start exiting their positions, possibly triggering sharp declines. Ideal for booking PE profits or trailing stop-loss tightly.

HDFCBANK – Bullish Potential Post Results, But OI Shows Bearish________________________________________________________________________________📈 HDFCBANK – Bullish Potential Post Results, But OI Shows Bearish Overhang
📅 Setup Date: 17.07.2025 | ⏱ Timeframe: Daily
📍 Strategy: Post-Earnings Reaction Play with Mixed Sentiment in Options
________________________________________________________________________________
🔍 Overall View
Spot Price: ₹1957.4
Trend: Mixed – Strong Q1 results (profit ↑12%, bonus/dividend declared), but price action weak
Volatility: High IVs — Calls ~23–25%, Puts ~29–32% → post-result event premium still elevated
Ideal Strategy Mix: Neutral-to-bullish spreads with defined risk or post-IV crush contrarian longs
________________________________________________________________________________
1️⃣ Bullish Trade (Contrarian Setup with Fundamental Trigger)
Best CE: Buy 1980 CE @ ₹24.2
Why:
• Strong earnings + corporate action (bonus/dividend) → triggers potential sentiment reversal
• CE 1980 saw Short Build-Up (+144% OI), premium ↓25% → ideal for short-covering setup
• Delta ~0.41 with high IV (~24.3%) → moderate leverage & gamma in case of price breakout
• Use only if price breaks and sustains above ₹1975 with strong candle + volume
________________________________________________________________________________
2️⃣ Bearish Trade (Trend Following)
Best PE: Sell 1900 PE @ ₹16.65
Why:
• PE 1900 saw massive Long Build-Up (+70%) but IV surged → may now face decay pressure
• Selling this deep OTM PE gives ~₹57 buffer from spot (≈3% downside cushion)
• Post-results, downside may be limited → good candidate to play post-IV crush
• Spot stability around 1950–1960 invalidates aggressive downside
________________________________________________________________________________
3️⃣ Strategy Trade (Defined Risk Based on Mixed Setup)
Strategy: Bull Call Spread → Buy 1980 CE / Sell 2020 CE
→ ₹24.2 / ₹10.7
Net Debit: ₹13.50
Max Profit: ₹40 (spread width) – ₹13.5 = ₹26.5
Max Loss: ₹13.50
Risk:Reward: ≈ 1 : 1.96 ✅
Lot Size: 550
Total Risk: ₹7,425
Max Profit: ₹14,575
📊 Breakeven Point: ₹1993.5
📉 Reversal Exit Level: Exit if Spot < ₹1940 (invalidates breakout + earnings move fade)
________________________________________________________________________________
Why:
• Bullish news (Q1 beat, bonus/dividend) could trigger CE short covering if price moves above 1980
• Limited risk strategy — works well if post-result rally is moderate
• High IVs favour spread over naked options (caps loss from premium crush)
• CE OI from 1960–2060 mostly short → if momentum picks up, rally could be fast
________________________________________________________________________________
📘 My Trading Setup Rules
Avoid Gap Plays
→ Check pre-open price action to avoid trades influenced by gap-ups/gap-downs.
Breakout Entry Only
→ Enter trades only if price breaks previous day’s High (for bullish trades) or Low (for bearish trades).
Watch Volume for Confirmation
→ Monitor volume closely. No volume = No trade.
Enter on Strong Candle + Volume
→ Execute the trade only if a strong candle appears with increasing volume in the direction of the trade.
Defined Risk:Reward Only
→ Take trades only if R:R is favourable (ideally ≥ 1:2).
Premium Disclaimer
→ Option premiums shown are based on EOD prices — real-time premiums may vary during execution.
Time Frame Preference
→ Trade with your preferred time frame — this strategy works across intraday or positional setups.
________________________________________________________________________________
⚠ Disclaimer (Please Read):
• These Trades are shared for educational purposes only and is not investment advice.
• I am not a SEBI-registered advisor.
• The information provided here is based on personal market observation.
• No buy/sell recommendations are being made.
• Please do your own research or consult a registered financial advisor before making any trading decisions.
• Trading involves risk. Always use proper risk management.
I am not responsible for trading decisions based on this post.
________________________________________________________________________________

Monday Trade Plan (Nifty 50) 🔼 Bullish Levels (Call Side Entry):
Above 25,008
🔹 Hold CE (Call) — Positive trade view.
Above 25,118
🔹 Hold CE by Entry Level
🚨 Below this: Risky Zone for PE (Put)
Above 25,218
🔹 10 min Closing Short Cover Level
✅ Strong momentum expected above this zone
🔽 Bearish Levels (Put Side Entry):
Below 25,000
🔻 Hold PE — Negative trade view.
Below 24,888
🔻 Opening R1 10m — Hold PE by level
Below 24,788
🔻 Hold PE by level
Below 24,688
🔻 Hold PE by Safe Zone level
Below 24,600 (Approx)
🧯 UNWINDING ZONE
🔻 Strong downward momentum expected
⚠️ Mid-Zone / Risk Areas:
Between 25,000 – 25,008: No clear direction
Between 25,088 – 25,118: Risky Zone for PE
Between 24,788 – 24,888: Rangebound area, watch for breakout

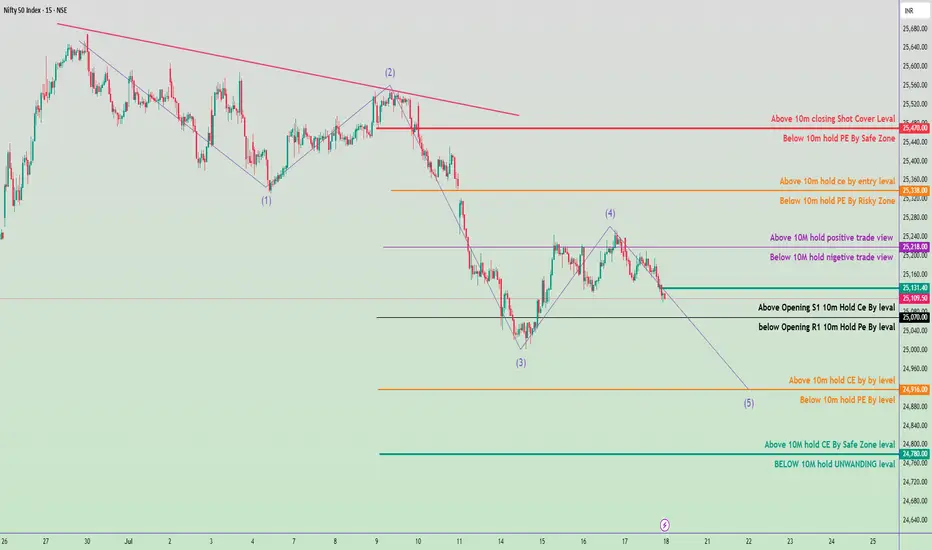
Trade plan for tomorrow (July 18, 2025)📈 Bullish Trade Plan (Alternative Scenario)
✅ S etup 3: Call Option Trade (CE)
Trigger: Price moves above 25,218 with volume
Action: Buy 25,200 CE or 25,300 CE
Target 1: 25,338
Target 2: 25,470
Bearish Trade Plan (Primary Bias)
✅ Setup 1: Directional Put Option Trade (PE)
Trigger: Break below 25,070
Action: Buy 25,000 PE or 24,900 PE
Target 1: 25,000
Target 2: 24,916
Target 3: 24,780
Current Context:
Nifty is forming a classic Elliott Wave pattern, currently likely in Wave (5) down.
Trend: Bearish bias unless 25,218 is reclaimed.
Key Support Zone: 25,070 – 25,000
High Probability Target for Wave (5): Around 24,780–24,760
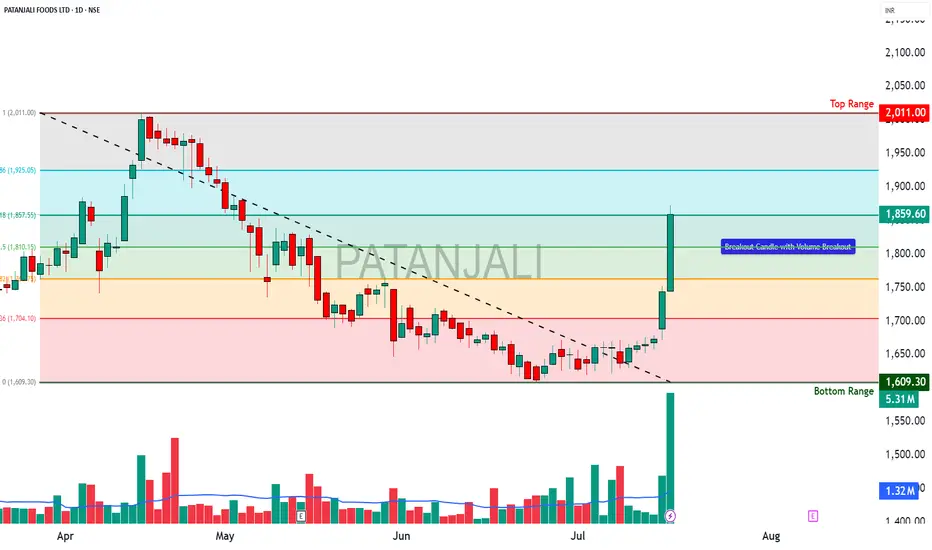
PATANJALI - OPTIONS TRADE SETUPPATANJALI OPTIONS TRADE SETUP – 17 JULY
Spot: ₹1859.6
Trend: Bullish
Volatility: Moderate IV rise (38–41%)
Lot Size: 300
________________________________________
1. Bullish Trade (Naked options as per trend)
Best CE: Buy 1860 CE @ ₹59.45
Why: Strong continuation signal with rising OI and price, heavy volume, and ideal gamma/vega mix for price moves.
________________________________________
2. Contrarian Trade (Naked options against trend)
Best PE: Buy 1800 PE @ ₹31.3
Why: Defensive Put play with unusually high activity and rising IV → could work as hedge if breakdown begins below ₹1840.
________________________________________
3. Strategy Trade (As per trend + OI data)
Strategy: Bull Call Spread → Buy 1860 CE / Sell 1920 CE
Net Debit: ₹59.45 - ₹35.5 = ₹23.95
Max Profit: ₹60 - ₹23.95 = ₹36.05
Max Loss: ₹23.95
Risk:Reward ≈ 1:1.5
Lot Size: 300
Total Risk: ₹7,185
Max Profit: ₹10,815
Why:
• Massive Long Buildup in CE chain (1820 to 1960), with 1860 CE leading in volume and OI surge
• 1860–1920 spread captures ideal move zone before resistance at 1960
• IVs rising moderately → favors debit spread entry
• PE chain showing Short Buildup, especially at 1800/1840/1880 → downside bets getting squeezed
• Balanced risk with great R:R (1:1.5) near breakout zone — clean bullish continuation setup
________________________________________
📘 My Trading Setup Rules
Avoid Gap Plays
→ Check pre-open price action to avoid trades influenced by gap-ups/gap-downs.
Breakout Entry Only
→ Enter trades only if price breaks previous day’s High (for bullish trades) or Low (for bearish trades).
Watch Volume for Confirmation
→ Monitor volume closely. No volume = No trade.
Enter on Strong Candle + Volume
→ Execute the trade only if a strong candle appears with increasing volume in the direction of the trade.
Defined Risk:Reward Only
→ Take trades only if R:R is favorable (ideally ≥ 1:2).
Premium Disclaimer
→ Option premiums shown are based on EOD prices — real-time premiums may vary during execution.
Time Frame Preference
→ Trade with your preferred time frame — this strategy works across intraday or positional setups.
________________________________________
⚠ Disclaimer (Please Read):
• These Trades are shared for educational purposes only and is not investment advice.
• I am not a SEBI-registered advisor.
• The information provided here is based on personal market observation.
• No buy/sell recommendations are being made.
• Please do your own research or consult a registered financial advisor before making any trading decisions.
• Trading involves risk. Always use proper risk management.
I am not responsible for trading decisions based on this post.
________________________________________
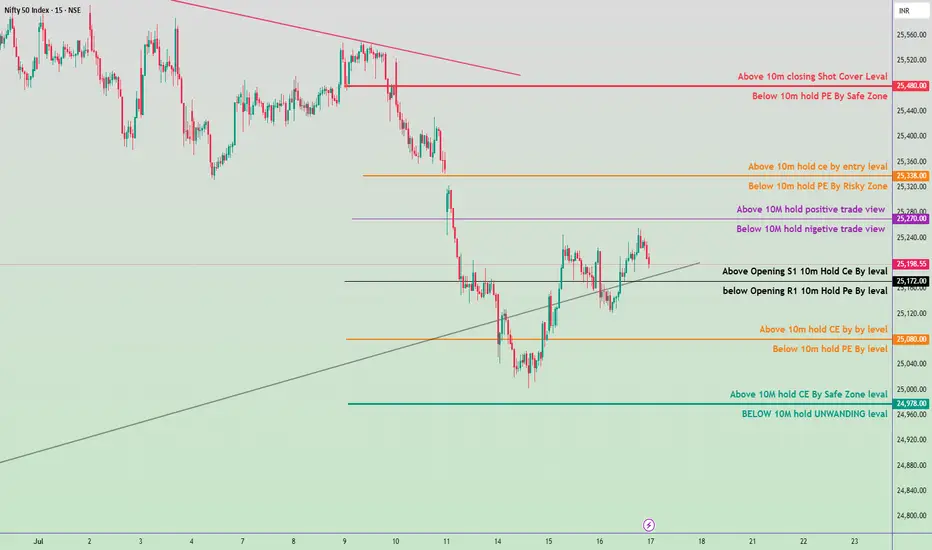
Nifty 50 Intraday Trade Plan - 17 July 2025🔴 Bullish Scenario (CE Buy Zones):
Above 25,480 → Shot Cover Level
→ CE BUY with strong momentum.
Above 25,338 → Entry Level for CE
→ CE BUY possible; moderate conviction.
Above 25,270 → Positive Trade View Starts
→ Start building CE positions cautiously.
Above 25,198.55 (Opening S1 Level)
→ Intraday CE HOLD if already bought.
Above 25,080 → CE by Buy Level
→ Entry-level for CE if market recovers.
Above 24,978 → CE Buy Safe Zone
→ Safer entry for CE, if bounce observed.
🔵 Bearish Scenario (PE Buy Zones):
Below 25,480 → PE by Safe Zone
→ PE can be added gradually.
Below 25,338 → Risky Zone for PE
→ PE buy with risk, SL tight.
Below 25,270 → Negative View Begins
→ Confidence increases in PE position.
Below 25,172 (Opening R1 Level)
→ If breaks this, PE HOLD.
Below 25,080 → PE by Buy Level
Below 24,978 → UNWINDING Level
→ Expect strong selling; PE aggressive buy zone.
🎯 Key Zones to Watch:
Range Bound Zone: Between 25,172 – 25,270
Trend Decider Zone:
Break above 25,270: Bullish Bias
Break below 25,172: Bearish Bias
Nifty 50 – Intraday Plan for July 16, 2025📊 Intraday Key Levels & Strategy:
🔺 Upside Zones (CE Bias):
25,270 – Above 10M hold = Positive Trade View
25,390 – Above 10m hold CE by entry level
25,478 – Above 10m closing = Shot Cover Level
⚠️ Neutral to Mixed Zones:
25,120 – Above Opening S1: 10m Hold CE Buy Level
25,100 – Below Opening R1: 10m Hold PE Buy Level
25,070 – Below 10M = Negative Trade View
🔻 Downside Zones (PE Bias):
24,990 – Below 10m hold PE by level
24,920 – Below 10m hold PE = Risky Zone
24,880 – Above 10M = CE Safe Zone
24,860 – BELOW 10M = UNWINDING zone.
✅ Suggested Intraday Plan:
Bullish Scenario (CE Trades):
Buy CE above 25,120 (Only if 10 min candle holds).
Add on breakout & hold above 25,270.
Target zone: 25,390–25,478.
SL: Below 25,070.
Bearish Scenario (PE Trades):
Sell/Buy PE below 25,100 (Only if 10 min candle sustains).
Confirm further weakness if below 24,990 or 24,920.
Target zone: 24,880–24,860.
SL: Above 25,120.

Nifty 50 Intraday Trade Plan July 15, 2025🔴 Upper Resistance Levels:
25,430.00
🔺 Above 10m closing: Short Cover Level
🔻 Below 10m: Hold PE (Safe Zone)
25,280.00
🔺 Above 10m: Hold CE (Entry Level)
25,240.00
🔻 Below 10m: Hold PE (Risky Zone)
25,160.00
🔺 Above 10M: Hold Positive Trade View
🔻 Below 10M: Hold Negative Trade View
🟢 Current Zone:
Market is trading near 25,087.10
Watch levels:
25,030.00 – Above Opening S1: Hold CE by level
25,000.00 – Below Opening R1: Hold PE by level
🟠 Lower Support Levels:
24,960.00
🔺 Above 10m: Hold CE by level
24,920.00
🔻 Below 10m: Hold PE by level
24,800.00
🔺 Above 10M: Hold CE by Safe Zone
24,760.00
🔻 Below 10M: UNWINDING Level
🔍 Strategy Suggestions:
✅ Bullish Bias:
If price sustains above 25,160, consider Call Option Buy (CE) or bullish trades.
❌ Bearish Bias:
If price fails below 25,030 or 24,920, consider Put Option Buy (PE) or short positions.

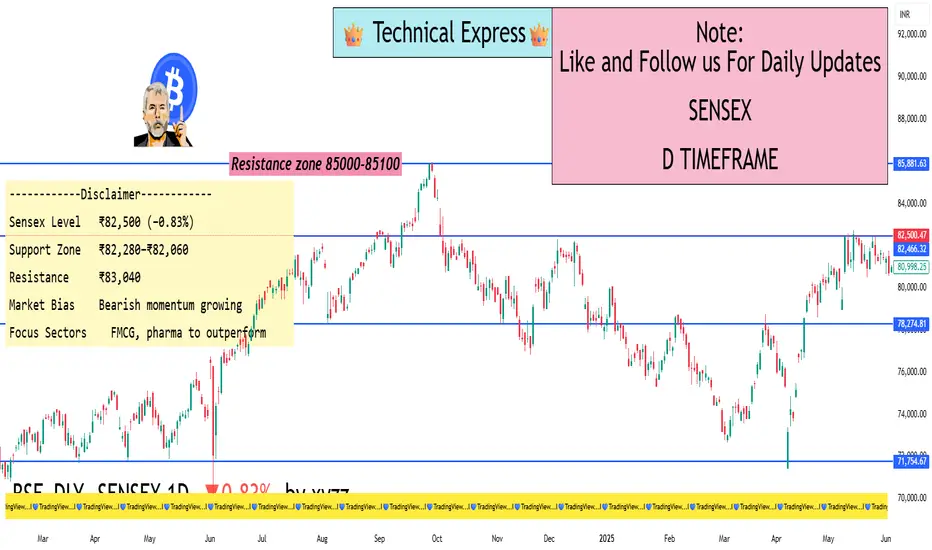
Sensex Dives Below ₹82,600 — IT Stocks Drag Index DownFrom a technical standpoint, Sensex breaking below ₹82,600 is important. This was seen as a short-term support level. Now that it's broken, ₹82,280 and ₹82,060 are the next zones to watch for.
Moving Averages:
Sensex has slipped below its 20-day moving average, which is often used as a trend indicator.
This shows short-term weakness and signals caution for traders.
RSI (Relative Strength Index):
RSI is heading lower but not yet in oversold territory.
This means there could be more downside before a potential bounce.
MACD:
The MACD indicator is also showing bearish crossover – another sign that the market could stay weak in the near term.
What Should Traders & Investors Do Now?
For Traders:
This is a time to stay cautious.
Avoid taking aggressive long positions unless Sensex reclaims ₹83,000+ with strong volume.
Focus on stock-specific opportunities in sectors like FMCG, pharma, or even PSU banks.
For Long-Term Investors:
Don’t panic. Corrections like these are common.
Instead of trying to time the market, look for quality stocks at attractive valuations.
IT stocks are fundamentally strong, so long-term investors can accumulate slowly on dips, especially if they fall further.
Global Factors at Play
What happens in the global economy directly affects Indian markets. Here are some international cues that are influencing Sensex:
US Interest Rates:
The US Federal Reserve may raise interest rates again to fight inflation.
Higher rates make borrowing expensive, slow down spending, and can trigger a global slowdown.
China's Economic Data:
Slower growth in China has worried global investors.
A slowdown in Asia’s biggest economy has ripple effects on global demand.
Geopolitical Tensions:
Trade issues, especially between the US and China, are creating uncertainties.
Wars or unrest in regions like Ukraine or the Middle East also cause global instability.
What to Watch in Coming Days
Key Events:
More Q1 results from major companies
Global inflation data releases
FII (Foreign Institutional Investors) activity – whether they continue selling or start buying
Crude oil price movement – as it affects inflation and currency
RBI commentary on interest rates
📢 Final Thoughts
The fall in Sensex below ₹82,600 is a signal for caution, not panic. The IT sector’s weakness has triggered the fall, but the overall market is still stable when compared to global peers.
For serious investors, this is a good time to review portfolios, build a watchlist, and focus on quality stocks and sectors that show relative strength. Defensive sectors like FMCG and pharma are showing signs of leadership.
Market cycles are natural – after every fall, there's a recovery. The key is to stay updated, stay disciplined, and not let emotions drive your decisions.