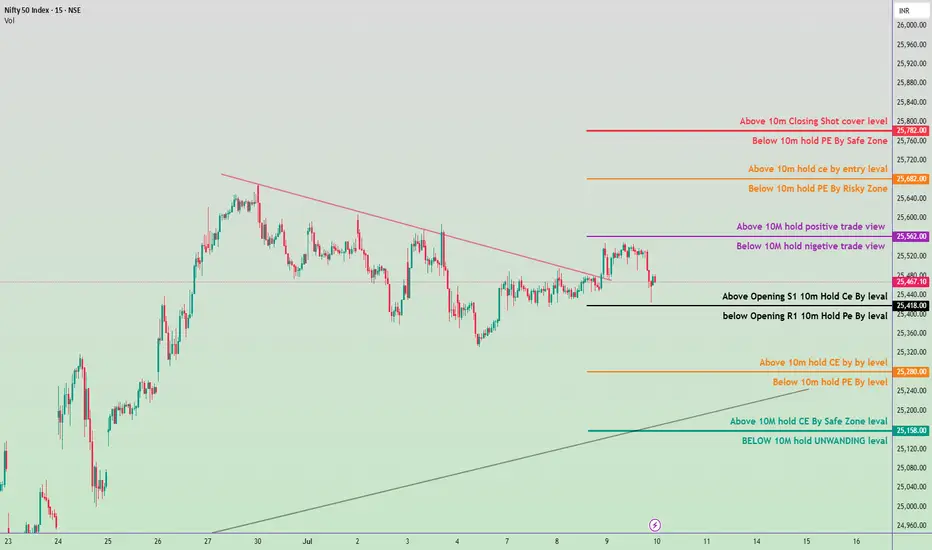
Nifty 50 Intraday Trade Plan 10 july 2025🟣 1. Trend Confirmation Zone (Level: 25,562.00)
Above 25,562.00 → Positive View Active
If Nifty sustains above this level for more than 10 minutes, it indicates bullish momentum. Call Option (CE) traders can stay in the trade or consider new entries.
Below 25,562.00 → Negative View Active
If Nifty stays below this level, bearish momentum is likely. Put Option (PE) trades are favorable.
⚫ 2. Opening Range Levels
Above 25,467.10 (Opening S1) → Hold CE (Call Option)
If the market holds above this after the opening 10-minute candle, you can go long (buy CE).
Below 25,418.00 (Opening R1) → Hold PE (Put Option)
If Nifty breaks this level on the downside, and sustains for 10 mins, it suggests weakness – PE trade is favorable.
🟠 3. Entry-Level Zone
Above 25,682.00 → Entry for CE (Call Option)
Bullish breakout level – good for fresh buying positions if sustained above.
Below 25,682.00 → Risky PE (Put Option) Zone
Aggressive traders may consider short trades, but this is a risky area.
🔴 4. Safe Zone for Positional Traders
Above 25,782.00 → Closing Shot / Cover Level
Indicates overbought or strong bullish continuation – exit PE positions if short.
Below 25,760.00 → Safe Zone for PE
A good place to hold PE (put) positions, as the market is weak below this.
🟠 5. Support Resistance Flip Zone
Above 25,280.00 → CE Hold Level
Support for intraday buyers. A bounce from here can give a CE opportunity.
Below 25,280.00 → PE Hold Level
Breaking this means more downside is likely – favorable for PE.
🟢 6. Strong Support / Breakdown Level
Above 25,158.00 → CE Safe Zone Level
Indicates strong buying support. If held, expect intraday recovery.
Below 25,158.00 → Unwinding Level
Panic selling or unwinding of long positions may start. Avoid CE, prefer PE.
Optiontrading
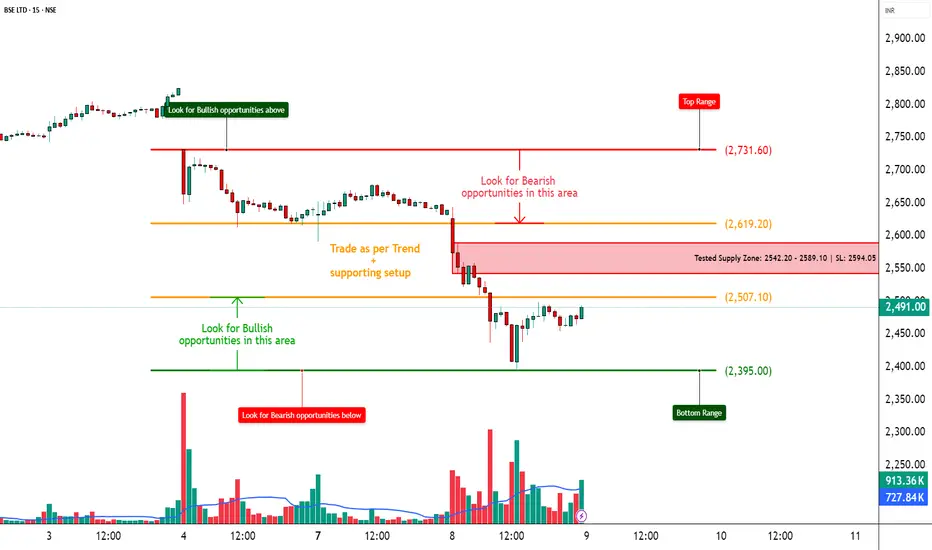
BSE – Strong Call Writing | Tested Supply Zone in Play________________________________________________________________________________
📈 BSE – Strong Call Writing Below 2600 | Tested Supply Zone in Play
🕒 Chart: 15-Min
📆 July 8, 2025
________________________________________________________________________________
🔍 What’s Catching Our Eye:
Massive Call writing seen from ₹2400 to ₹2900, clearly indicating resistance at higher levels.
________________________________________________________________________________📌 What We’re Watching For:
Price is facing selling near the ₹2542–₹2589 supply zone; a rejection here can drag it toward ₹2395 or below.
________________________________________________________________________________📌 OI Inference:
CEs are heavily sold across all levels – especially 2600, 2500, 2700, and 2400 CE.
Strong Put buying from 2400 down to 2000 PE → Market participants are expecting downside.
________________________________________________________________________________🔁 Trend Bias:
🔴 Bearish to Range-Bound – unless price breaks above ₹2594.05 with volume and CE unwinding.
________________________________________________________________________________🧠 Trade Logic / Reasoning:
• 12+ Call Strikes under Short Build-Up = strong ceiling
• Long Build-Up in deep Puts (2500, 2400, 2300, even 2000)
• Tested supply zone between ₹2542–₹2589 = rejection likely
• PE IVs rising = fear building up, especially below 2500
________________________________________________________________________________📍 Important Levels to Mark:
🔺 Top Range (Resistance): ₹2731.6
🔻 Bottom Range (Support): ₹2395
🟢 Demand Zone: NA
🔴 Supply Zone: ₹2542.20 – ₹2589.10 | SL: ₹2594.05(Tested Zone)
________________________________________________________________________________🎯 Trade Plan (Educational Purpose Only):
✅ Sell (Equity): Near ₹2542–₹2589 if price rejects the supply zone
✅ Buy (Equity): Only above ₹2594.05 with strong volume
✅ Best Put to Buy: ₹2500 PE or ₹2400 PE on breakdown
❌ Avoid Call Buying: All Calls are under heavy selling
📌 Strategy Idea (Low Risk):
Bear Put Spread – Buy 2500 PE, Sell 2400 PE
→ Profitable if stock drops, risk stays limited
________________________________________________________________________________⚠️ Invalidation Levels:
🔺 Above ₹2594.05 = bearish setup may fail
🔻 Below ₹2395 = confirms breakdown and trend continuation
________________________________________________________________________________
⚠️ Disclaimer:
This post is for educational purposes only.
STWP is not a SEBI-registered advisor.
No buy/sell recommendations are made.
Please consult your financial advisor before trading.
STWP is not responsible for any trading decisions based on this content.
________________________________________________________________________________
💬 Will BSE break supply and fly, or get rejected again?
⬇️ Share your view in the comments!
🔁 Repost this if you're watching BSE
✅ Follow STWP for clean Options + Price Action insights
🚀 Let’s trade with clarity and confidence!
________________________________________________________________________________
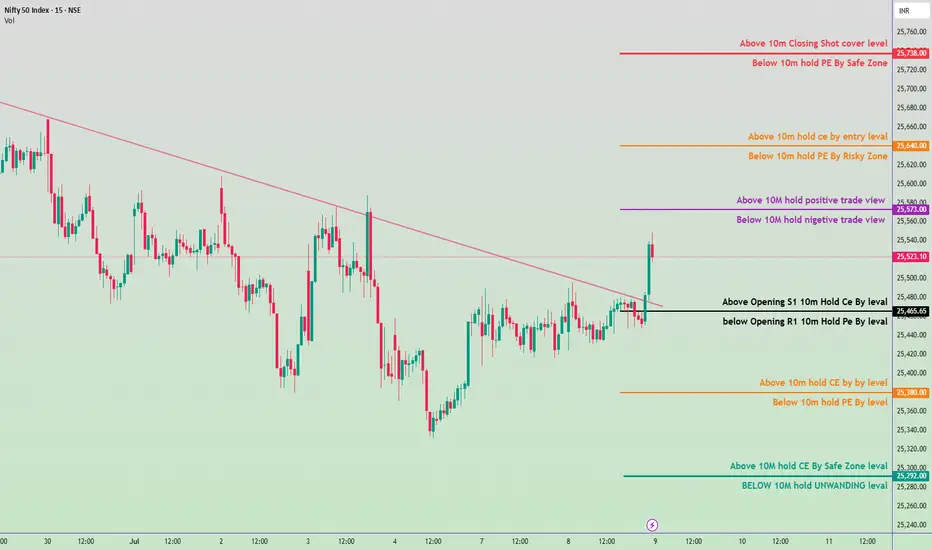
Nifty 50 Intraday Trade Plan for July 9, 2025🔴 Upper Resistance Zones (Short Covering Area)
🔺 25,738.00 – Shot Cover Level
If a 10-minute candle closes above this level, expect short covering – bullish breakout.
If price comes below this after testing, it's a safe zone to hold PE (puts).
🟧 25,640.00 – CE Entry Zone
Above this: Call options (CE) can be held.
Below this: Risky zone for holding PE, volatility may increase.
🟪 25,573.00 – Sentiment Zone
Above this: Positive trade bias.
Below this: Negative trade bias, indicating weakness.
⚫ Midpoint Zone (Opening & Pivot-Based Decision Area)
⚫ 25,465.65 – Opening + S1/R1 Zone
Above this level: Hold CE positions (bullish intraday setup).
Below this level: Hold PE positions (bearish setup).
🟠 Lower Mid-Level (Support/Breakdown Test)
🟠 25,380.00
Above: Intraday buy CE zone.
Below: PE can be held for more downside.
🟢 Bottom Support Zone (Safe Zone / Unwinding Zone)
🟢 25,292.00 – Safe CE Hold Zone
If the price holds above this level after 10 min: safe to hold CE.
🟢 25,282.00 – Unwinding Zone
Below this level: Risk of unwinding and larger sell-off increases.
📌 How to Use This Plan (Summary)
Wait for 10-minute candle confirmations near these levels.
Follow directional bias: CE (calls) if price sustains above levels, PE (puts) if price remains below.
Trade only after confirmation, not just touch.
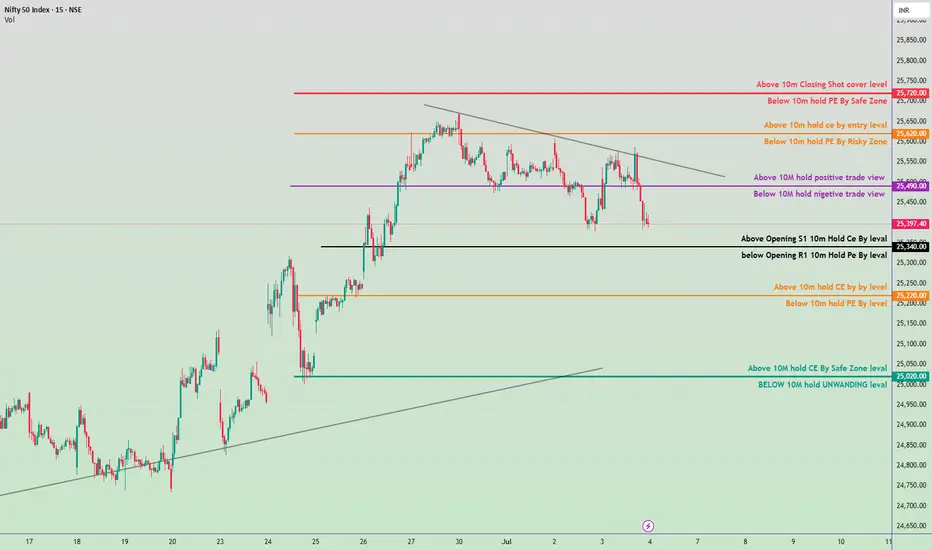
NIFTY 50 INTRADAY PLAN – 08 July 2025✅ Bullish Scenario (Call Option / CE Buy Plan):
Above 25,390:
Above Opening S1 – 10m Hold CE By Level
Initiate CE buy with caution.
Above 25,528:
Above 10M Hold – Positive Trade View
Strong bullish sentiment, hold CE confidently.
Above 25,670:
Above 10m Hold CE – Entry Level
CE enters Safe Zone, trend continuation expected.
Above 25,783:
Above 10m Closing – Short Cover Level
Big breakout possible, short covering rally.
🔻 Bearish Scenario (Put Option / PE Buy Plan):
Below 25,390:
Below Opening R1 – 10m Hold PE By Level
Start looking for PE (Put) trades.
Below 25,290:
Below 10m Hold PE By Level
Further downside expected, weakness builds.
Below 25,133:
Below 10M Hold – Unwinding Level
Strong selling / unwinding zone, big downside move likely.
🧠 Important Levels to Watch:
Trend Resistance Zone: 25,528 – 25,670
Support Zone: 25,290 – 25,133
Breakout Zone: Above 25,783
Breakdown Zone: Below 25,133
⚠️ Quick Notes for Traders:
📈 Above 25,528 = Positive view, hold CE
📉 Below 25,390 = Negative view, hold PE
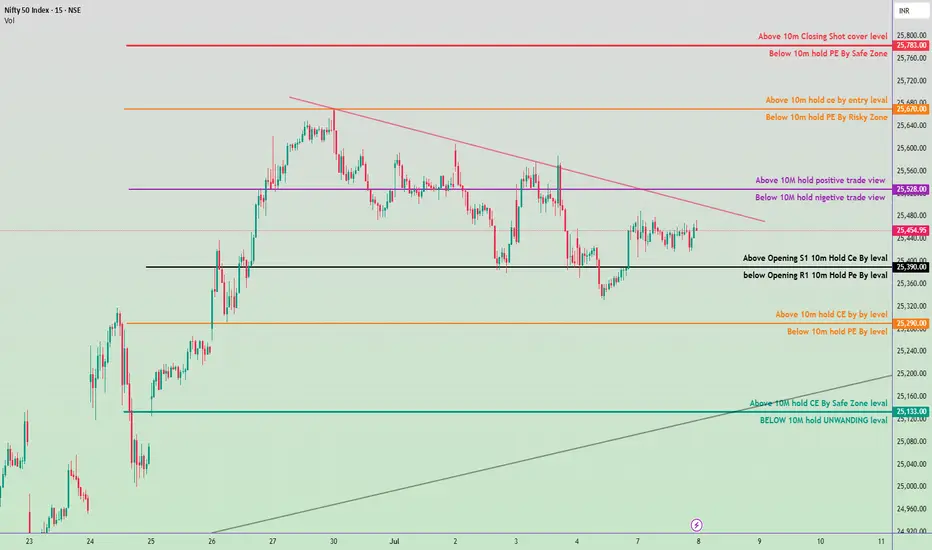
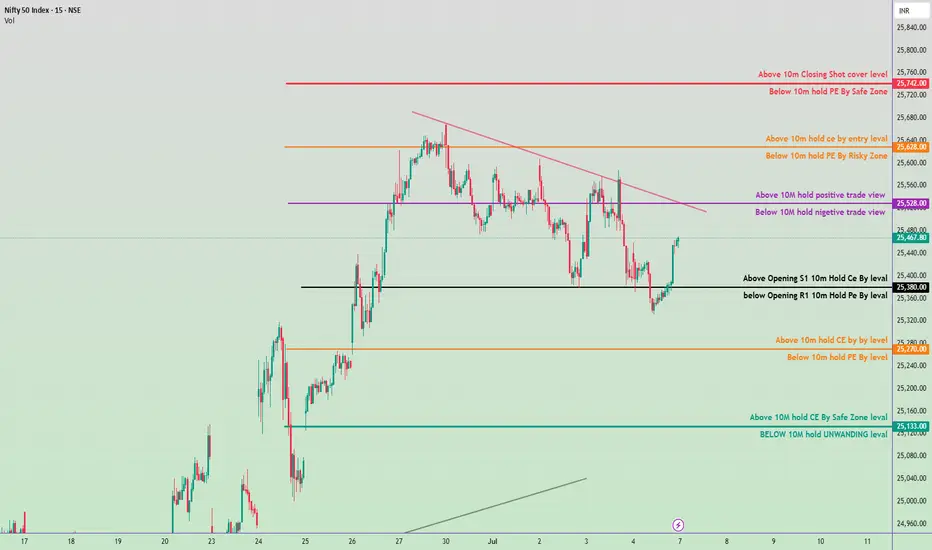
Nifty 50 Intraday Trade Plan - 7 July 2025✅ Bullish Zones (Call Option - CE Buy Levels):
Above 25,133 ➤ Hold CE by Safe Zone level
Above 25,270 ➤ Hold CE by key level
Above 25,380 ➤ Opening S1 Breakout – Hold CE
Above 25,528 ➤ Positive Trade View (10M volume base)
Above 25,628 ➤ Entry level for CE holding
Above 25,742 ➤ Closing Shot – Cover Short Positions
🔻 Bearish Zones (Put Option - PE Buy Levels):
Below 25,133 ➤ Unwinding Level – Hold PE
Below 25,270 ➤ Key level – Hold PE
Below 25,380 ➤ Opening R1 Breakdown – Hold PE
Below 25,528 ➤ Negative Trade View
Below 25,628 ➤ Risky Zone for holding PE
Below 25,742 ➤ Safe Zone for holding PE
🔁 Trendline & Structure Notes:
Downtrend resistance visible around 25,528–25,628 zone.
If price breaks above trendline and sustains, expect bullish momentum.
Support near 25,133 and strong base seen around 25,000 zone.
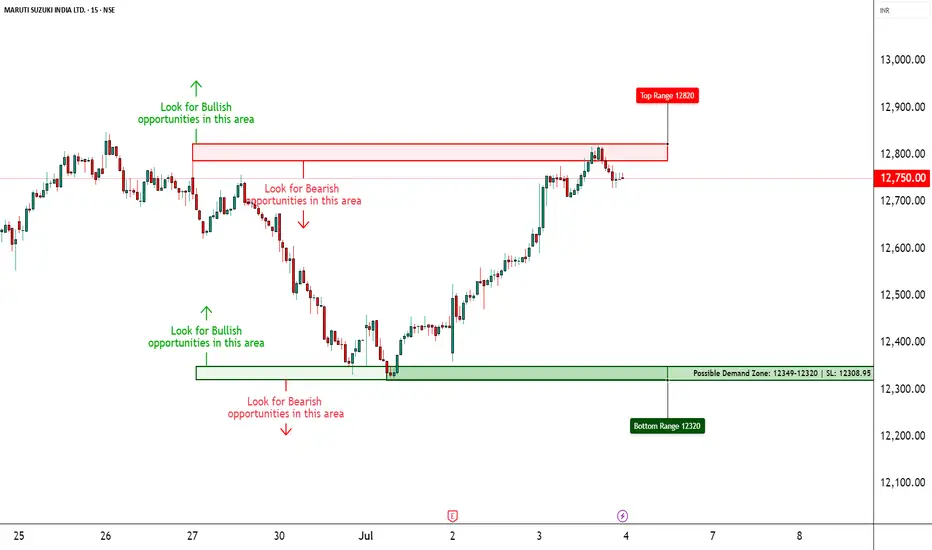
MARUTI – Strong Call Long Build-Up Dominance________________________________________
📈 MARUTI – Strong Call Long Build-Up Dominance | OI + Price Action Analysis
🕒 Chart Type: 15-Minute
📆 Date: July 3, 2025
________________________________________
🔍 What’s Catching Our Eye:
MARUTI closed around ₹12,752, and the entire Call side up to 13,500 is showing strong Long Build-Up, indicating aggressive bullish sentiment from option buyers. Meanwhile, the Put side is displaying Short Build-Up, further confirming bullish undertones. The price is steadily climbing, supported by strong institutional participation.
________________________________________
📌 What We’re Watching For:
If MARUTI sustains above ₹12,800, bullish continuation looks likely. Watch for follow-through toward ₹13,000 and 13,200+ if momentum persists. However, a drop below ₹12,500 could temporarily halt this upward bias.
________________________________________
📊 Volume Footprint:
Options activity is backed by strong volume — over 17k+ contracts at ₹13,000 CE and 15k+ at ₹12,800 CE — showing traders are betting big on further upside.
________________________________________
📈 Option Chain Highlights:
The OI data is highly supportive of the bulls:
• Calls (Long Build-Up):
o ₹13,000 CE: +104,450 OI | Price ↑ 8.6%
o ₹12,800 CE: +101,800 OI | Price ↑ 12.04%
o ₹12,900 CE: +95,650 OI | Price ↑ 10.07%
o Even OTM CE like ₹13,500 is active → trend belief is strong
• Puts:
o ₹12,800 PE & ₹12,700 PE both showing Short Build-Up, i.e., buyers believe downside is limited
Inference: Bulls are clearly in control, with both Call buyers active and Put sellers stepping in. This aligns with the broader bullish trend seen in the stock.
________________________________________
🔁 Trend Bias:
🟢 Bullish – Confirmed via price action and derivative sentiment
________________________________________
🧠 Trade Logic / Reasoning:
Strong accumulation is seen at every major Call level, from ATM to slightly OTM strikes. Short covering at ₹12,500 CE and long build-up in higher CE strikes confirms that the bulls are expecting a continuation rally. PE writers are unwinding or adding shorts – classic sign of strength.
________________________________________
📍 Important Levels to Mark:
🔺 Top Range (Resistance): ₹13,200 – ₹13,500
🔻 Bottom Range (Support): ₹12,500
________________________________________
🎯 Trade Plan (Educational Purpose Only):
✅ Best Buy (Equity): Above ₹12,800 with strong bullish candle
✅ Best Sell (Equity): Avoid unless ₹12,500 is broken
✅ Best CE to Long: ₹13,000 CE – Strongest long build-up with momentum
✅ Best PE to Long: Avoid PE long – sentiment doesn’t support bearish bets
🟢 Demand Zone: NA
🔴 Supply Zone: NA
⚠️ Invalidation Below:
Bullish bias is invalidated below ₹12,500 with high volume selling
________________________________________
⚠️ Disclaimer:
This analysis is for educational purposes only.
STWP is not a SEBI-registered advisor.
No buy/sell recommendations are made.
Please consult your financial advisor before trading.
STWP is not responsible for trading decisions based on this post.
________________________________________
💬 Did this help you spot the momentum early?
Drop your views in the comments ⬇️
🔁 Share this with traders watching MARUTI
✅ Follow STWP for clean price + option chain trades
🚀 Let’s educate more traders with patience and clarity!
________________________________________
RELIANCE – Trapped Between Strikes📈 RELIANCE – Trapped Between Strikes | Option Chain + Price Action Insights
🕒 Chart Type: 15-Minute
📆 Date: July 3, 2025
________________________________________
🔍 What’s Catching Our Eye:
RELIANCE is hovering just above ₹1,517.8 and facing resistance from rising short positions on Calls across 1540–1580 levels. Despite minor short covering at the 1500 and 1520 CEs, fresh Short Build-Up is visible across most strikes, suggesting upward moves are being capped. On the flip side, Puts between 1500–1530 are also witnessing Short Build-Up, indicating traders aren't expecting a major breakdown either.
________________________________________
📌 What We’re Watching For:
RELIANCE appears range-bound, and clear directional strength is missing. Price needs to decisively break above ₹1,540 for bullish strength to materialize. On the downside, support exists around ₹1,500, but if that breaks, expect pressure to mount quickly.
________________________________________
📊 Volume Footprint:
Heavy volume on both sides:
• 13k+ contracts at 1520 CE
• 11k+ contracts at 1600 CE
• Over 9k contracts traded at 1500–1530 PE
→ Traders are actively betting on both sides, suggesting volatility ahead.
________________________________________
📈 Option Chain Highlights:
• Call Side:
o 1530 CE → Long Build-Up (+2.45% OI)
o 1540 CE → Long Build-Up (+2.45%)
o 1550–1580 CE → Short Build-Up, signaling resistance buildup
o 1520 CE → Short Covering
• Put Side:
o 1500–1530 PE → Short Build-Up, hinting at base support around 1500
Inference: The tug-of-war is real. Calls are being written at higher strikes while Puts are being sold at lower strikes. That creates a tight range of ₹1,500–1,540, with traders unsure of breakout direction.
________________________________________
🔁 Trend Bias:
🟡 Neutral to Slightly Bullish – Only if ₹1,540 is reclaimed with volume
________________________________________
🧠 Trade Logic / Reasoning:
Price is squeezed between the ₹1,500 Put writers and ₹1,540+ Call writers. This is a textbook “compression zone” where a breakout or breakdown may soon follow. If bulls want control, they must push above ₹1,540 with volume and follow-through. Else, expect the sideways to weak bias to continue.
________________________________________
📍 Important Levels to Mark:
🔺 Top Range (Resistance): ₹1,540 – Break & sustain needed for upside
🔻 Bottom Range (Support): ₹1,500 – Breakdown will shift sentiment bearish
________________________________________
🎯 Trade Plan (Educational Purpose Only):
✅ Best Buy (Equity): Only above ₹1,540 with confirmation
✅ Best Sell (Equity): If price breaks below ₹1,500
✅ Best CE to Long: 1530 CE – Strong long build-up with good delta
✅ Best PE to Long: Avoid – PE sellers still active; no breakdown confirmed
🟢 Demand Zone: NA
🔴 Supply Zone: NA
⚠️ Invalidation Below:
Bullish view invalid if price fails at ₹1,540 or slips below ₹1,500 with volume
________________________________________
⚠️ Disclaimer:
This analysis is for educational purposes only.
STWP is not a SEBI-registered advisor.
No buy/sell recommendations are made.
Please consult your financial advisor before trading.
STWP is not responsible for any trading decisions based on this content.
________________________________________
💬 Found this helpful?
Drop your feedback in the comments ⬇️
🔁 Share with traders who track RELIANCE
✅ Follow STWP for consistent zone + option chain insights
🚀 Let’s trade smart, with patience and clarity!

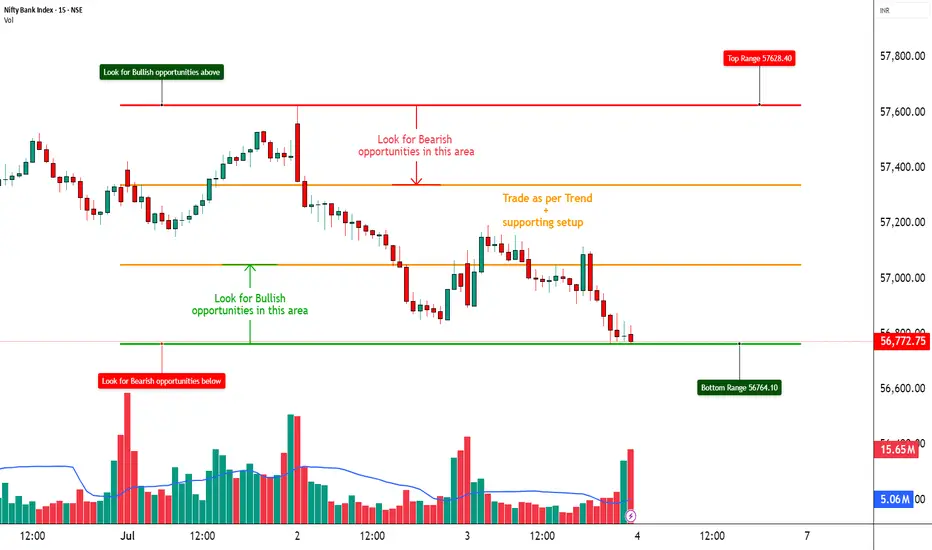
BANKNIFTY – On the Edge of Breakdown📈 BANKNIFTY – On the Edge of Breakdown | Option Chain + Price Action Analysis
🕒 Chart Type: 15-Minute
📆 Date: July 3, 2025
🔍 What’s Catching Our Eye:
BANKNIFTY is sitting dangerously close to the ₹56,770 support zone, which has been tested multiple times. Price action remains weak, and failure to bounce indicates rising pressure on this level.
📌 What We’re Watching For:
We’re closely monitoring the price action near ₹56,770 — a breakdown below this key level could trigger a sharp pick-up in bearish momentum. On the flip side, any meaningful reversal setup will only be considered valid if BANKNIFTY reclaims ₹57,100 with a strong bullish candlestick supported by volume. As of now, the option chain data continues to heavily favor the bears, offering more confirmation than speculation for a potential downside move.
📊 Volume Footprint:
The current volume stands at 149.89M, slightly lower than the previous session’s 162.75M, indicating a mild drop in participation. This suggests that traders are in a wait-and-watch mode. A sharp surge in volume—especially on a move below ₹56,770—could validate a breakdown and trigger momentum on the downside.
📈 Option Chain Highlights:
The 57000 PE is showing a strong long build-up, signaling that traders are positioning for further downside. On the other hand, the 57000 CE has witnessed a heavy short build-up, reinforcing the bearish sentiment. Additionally, lower strike PEs between 56700 and 56900 are also displaying long build-up, further confirming downside pressure. Meanwhile, Call OI is increasing at higher strikes, indicating that resistance is likely forming in the 56900–57200 range.
🔁 Trend Bias:
🔴 Bearish unless we reclaim and sustain above ₹57,100 with confirmation
🧠 Trade Logic / Reasoning:
There is a visible and well-established supply zone between ₹57,400 and ₹57,600, which has consistently capped upside attempts. On the downside, the ₹56,770 support is showing signs of exhaustion due to repeated tests. Derivative data continues to favor the sellers, with strong bearish positioning in the option chain. As there is no visible sign of a reversal yet, it's prudent to remain cautious on taking any premature long positions.
📍 Important Levels to Mark:
🔺 Top Range: 57,600 - Look for breakout or reversal candlestick pattern + volume
🔻 Bottom Range: 56,770 - Watch for breakdown or bullish reversal pattern + volume
🎯 Trade Plan (Educational Purpose Only):
✅ Best Sell: 57000 PE – Long Build-Up present, indicating institutional downside play
✅ Best Buy: 56500 CE – if reversal above 57,100 is confirmed with price action
🟢 Demand Zone: NA
🔴 Supply Zone: NA
⚠️ Invalidation Below:
Any bullish view becomes invalid if BANKNIFTY breaks and holds below 56,750 with high volume
⚠️ Disclaimer:
This post is for educational purposes only.
STWP is not a SEBI-registered advisor.
This is not a buy/sell recommendation.
Please consult your financial advisor before trading.
STWP is not responsible for any trading outcomes.
💬 Found this helpful?
Drop your thoughts in the comments ⬇️
🔁 Share with fellow traders
✅ Follow STWP for zone-based price action & option chain insights
🚀 Let’s boost awareness of smart & patient trading!
Nifty 50 Intraday Trade Plan for July 4, 2025🔼 Bullish (Call Option / CE Buy Strategy)
✅ Zone 1: Above 25,490
If Nifty holds above 25,490 for 10 minutes, sentiment turns positive.
This is the first sign of bullishness. You can initiate CE positions with caution.
✅ Zone 2: Above 25,620
Holding above 25,620 for 10 minutes = entry confirmation for CE buy.
This is a riskier zone but indicates bullish breakout strength.
✅ Zone 3: Above 25,700
If Nifty sustains or closes above 25,700, short covering may start.
This is a safe zone for CE buyers with strong momentum.
🔽 Bearish (Put Option / PE Buy Strategy)
🚫 Zone 1: Below 25,490
Holding below 25,490 for 10 minutes turns view negative.
Suitable to initiate PE trades cautiously.
🚫 Zone 2: Below 25,340
This is the Opening R1 level. Holding below it confirms bearishness.
Good level to enter PE with confirmation.
🚫 Zone 3: Below 25,220
Holding below this level confirms continuation of bearish move.
Another chance to buy PE if missed above.
🚫 Zone 4: Below 25,000
If Nifty breaks 25,000 and sustains below for 10 minutes:
It enters a strong unwinding zone.
Strong selling may follow.
🔁 Neutral / Flip Zones (Critical for Trend Decision)
➖ 25,340 Zone:
If Nifty stays above 25,340 for 10m, you can try CE.
If it breaks down, look for PE below 25,340.
3rd july 2025 Nifty 50 trade plan levels
🔴 Upper Resistance Zones
25,830 – Above 10m Closing: Shot cover level
🔺 Strong resistance zone; if broken, short-sellers may start covering.
25,770 – Below 10m hold PE by Safe Zone
🔻 Safe zone for PE holders if price remains below this level.
🟠 Mid Resistance Zones
25,670 – Above 10m hold CE by entry level
🟢 If price sustains above this level, CE buying (bullish view) is favored.
25,600 – Below 10m hold PE by Risky Zone
⚠️ Below this, PE holders are at risk.
🟣 Key Intraday Sentiment Zone
25,520 – Above 10m hold positive trade view
📈 Market sentiment positive above this level.
25,500 – Below 10m hold negative trade view
📉 Market sentiment turns negative below this level.
⚫ Opening Support/Resistance
25,328 – Above Opening S1: 10m Hold CE by level
🟢 Support zone for CE holders.
25,300 – Below Opening R1: 10m Hold PE by level
🔻 Resistance zone for PE holders.
🟠 Lower Risk Zone
25,228 – Above 10m hold CE by Buy level
🟢 Strong buy level for CE if held.
25,200 – Below 10m hold PE by level
🔻 Risky level to hold PE below.
🟢 S upport/Unwinding Zone
25,092 – Above 10m hold CE by Safe Zone level
🛡️ Safe zone for bullish positions.
25,050 – Below 10m hold UNWINDING level
📉 If price drops below, expect unwinding pressure.

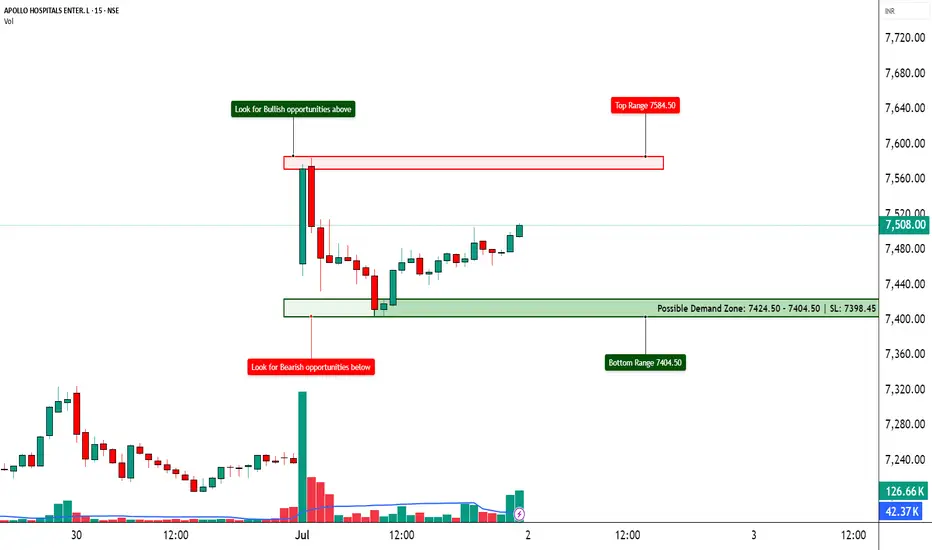
APOLLOHOSP – Preparing for the Next Breakout ?📈 APOLLOHOSP – Preparing for the Next Breakout?
🔍 Bullish Setup Unfolding | Option Chain + Price Action Analysis
Chart Type: 15-min / 1H / Daily
Indicators: STWP Zones, Volume, Demand-Supply, Price Action
🔹 What’s Catching Our Eye?
✅ Strong Long Build-Up across 7500–8000 Calls
✅ Heavy Put Writing at 7500, 7400, and even 7000
✅ Volatility Expansion + Rising OI = Possible Range Expansion Move
✅ Clean Demand Zone at 7400–7450 with a Morning Star Bounce (if visible)
✅ ATM Call (7500 CE) up 124% with +38% OI – Institutions possibly preparing for an up move!
📊 What We’re Watching for:
📍 Trigger Level: 7520–7550 Breakout
📍 Targets: 7600 → 7700 → 7800
📍 Invalidation Below: 7420
📍 Momentum Confirmation: Price closing above 7550 with volume spike
📍 Option Chain Support: 7000–7400 (Heavy PE writing)
📌 Trade Plan (Educational Purpose Only):
🔹 Bullish: Buy on breakout above 7550 with SL below 7440
🔹 Options: Consider 7600 or 7700 CE based on risk profile
🔹 BTST Type: If price holds 7500–7520 till close
⚠️ Disclaimer:
This post is for educational and learning purposes only.
It does not constitute buy/sell advice or investment recommendation.
Always consult your financial advisor before taking any positions.
STWP is not liable for any financial decisions based on this content.
📚 "Let Data Drive the Trade – Not Emotion!"
💬 What's your take on ApolloHosp? Bullish ride or trap zone?
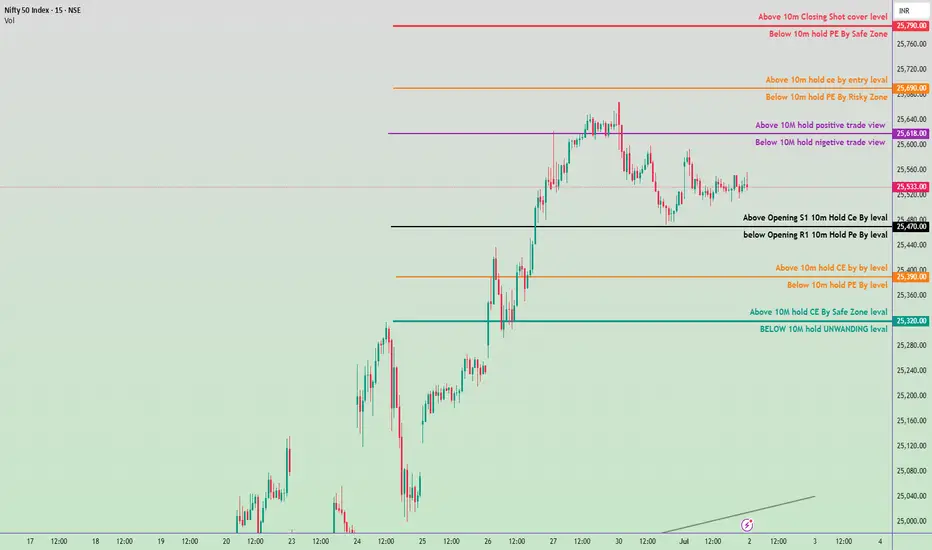
Nifty 50 Intraday Trade Plan 2nd july 2025🔼 Bullish Zones (Calls/CE preferable)
Above ₹25,790 → Closing Shot cover level
Above ₹25,760 → Hold PE by Safe Zone ends
Above ₹25,690 → Entry level for CE (Calls)
Above ₹25,618 → 10M hold positive trade view
Above ₹25,470 → Opening S1 | 10M Hold CE by level
Above ₹25,390 → 10M hold CE by Buy level
Above ₹25,320 → 10M hold CE by Safe Zone level
🔽 Bearish Zones (Puts/PE preferable)
Below ₹25,760 → Hold PE by Safe Zone starts
Below ₹25,690 → Risky Zone for PE
Below ₹25,618 → 10M hold negative trade view
Below ₹25,470 → Opening R1 | 10M Hold PE by level
Below ₹25,390 → 10M hold PE by level
Below ₹25,320 → UNWINDING level (Strong support loss)
📌 Trade Plan Guidelines
🔹 Above ₹25,618 with volume: Favor CE (calls), look for targets up to ₹25,690–₹25,790.
🔹 Below ₹25,470 with confirmation: Favor PE (puts) toward ₹25,390–₹25,320.
🔹 Avoid trading between ₹25,470–₹25,618 if price is consolidating — this is a neutral “no trade zone”.
📉 Below ₹25,320, expect strong unwinding.
Nifty 50 – Tomorrow’s Intraday Trade Plan (1st July 2025)
🔴 Bullish Zones (Call Option Focus)
₹25,790.00 – Above 10M Closing Shot Cover Level
₹25,770.00 – Above 10M Hold CE by Entry Level
₹25,700.00 – Above 10M Hold CE by Entry Level
₹25,590.00 – Above 10M Hold Positive Trade View
₹25,413.00 – Above Opening S1 10M Hold CE by Level
₹25,290.00 – Above 10M Hold CE by Level
₹25,113.00 – Above 10M Hold CE by Safe Zone Level
🔵 Bearish Zones (Put Option Focus)
₹25,790.00 – Below 10M Hold PE by Safe Zone
₹25,690.00 – Below 10M Hold PE by Risky Zone
₹25,590.00 – Below 10M Hold Negative Trade View
₹25,363.00 – Below Opening R1 10M Hold PE by Level
₹25,250.00 – Below 10M Hold PE by Level
< ₹25,113.00 – Below 10M Hold = UNWINDING Zone

Nifty 50 Intraday Trade Plan for June 27, 2025✅ Bullish Trade Plan (Call Option / CE)
Above 25478 hold
🔹 Level: Above Opening S1 10m Hold CE By level
🔸 Action: Buy CE if price sustains above this level
🔸 Target 1: 25,638 – Above 10M hold positive trade view
🔸 Target 2: 25,770 – Above 10m hold CE by entry level
🔸 Target 3: 25,880 – Below 10m hold PE by Safe Zone
🔸 Target 4: 25,900 – Above 10m Closing Shot cover level
❌ Bearish Trade Plan (Put Option / PE)
Below 25,638
🔹 Level: Below Opening R1 10m Hold PE By level
🔸 Action: Buy PE if price falls below this level
🔸 Target 1: 25,378 – Below 10m hold PE By level
🔸 Target 2: 25,178 – Above 10M hold CE By Safe Zone level

June 26, 2025 Nifty 50 breakout & breakdawon Levals✅ Bullish View Zones:
(Call Option CE Focus)
Above 25,630 – 10m Closing Shot cover level
Above 25,432 – 10m hold CE by Entry level
Above 25,322 – 10M hold: Positive trade view
Above 25,180 – Opening S1 + 10m hold CE by level
Above 25,060 – 10m hold CE by level
Above 24,912 – 10M hold CE by Safe Zone level
❌ Bearish View Zones:
(Put Option PE Focus)
Below 25,630 – 10m hold PE by Safe Zone
Below 25,432 – 10m hold PE by Risky Zone
Below 25,322 – 10M hold: Negative trade view
Below 25,180 – Opening R1 + 10m hold PE by level
Below 25,060 – 10m hold PE by level
Below 24,912 – 10M hold UNWINDING level
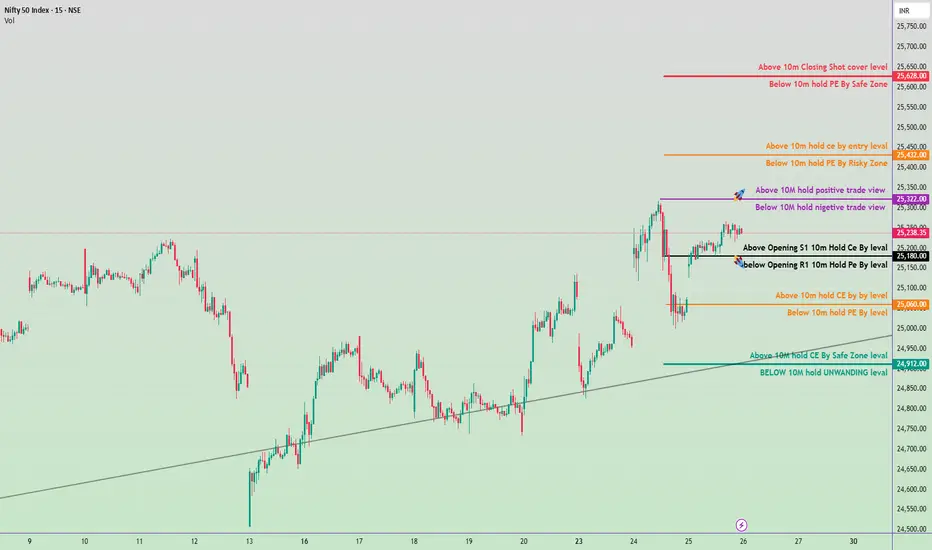
June 25, Nifty 50 intraday trade plan for tomorrow✅ Bullish Zones (Call Buyer Favorable):
🔺 Above 25,518
→ Closing short-covering level
Strong breakout / upside momentum
🟧 Above 25,318
→ 10M hold CE by entry level
Safe CE entry zone
🟪 Above 25,183
→ Positive trade view zone
⚫ Above 24,982
→ Opening S1 CE hold level
🟩 Above 24,622
→ Safe zone for CE buying
❌ Bearish Zones (Put Buyer Favorable):
🔻 Below 25,518
→ Safe zone for PE buyers
🟧 Below 25,318
→ Risk zone for PE buyers
🟪 Below 25,183
→ Negative trade view zone
⚫ Below 24,982
→ Opening R1 PE hold level
🟧 Below 24,780
→ 10M PE hold level
🟦 Below 24,622
→ Unwinding zone – Weak market signal
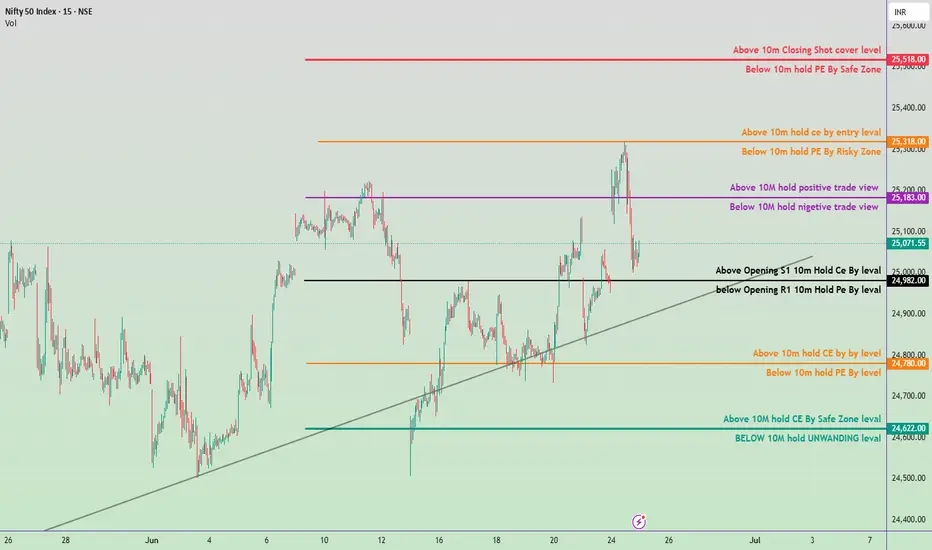
📊 Tomorrow’s Trading Strategy
Opening Above 25,183
Look for CE Buying Opportunities.
Target 25,318 → 25,518.
Opening Between 25,071–24,982
Neutral to cautious zone.
Wait for price action confirmation near key levels.
Opening Below 24,780
Look for PE Buying or CE Selling.
Possible test of 24,622 → 24,500 zone.
Trendline Support Near 24,850
If broken, expect downside acceleration.
Monday,June 24 Nifty 50 Intraday Trade Plan & kye leves
🔴 Resistance Zones:
25,138 – Crucial Resistance (Above 10M hold = Positive Trade View)
Break & sustain above = bullish continuation
25,330 – Above 10M hold CE by entry level
25,390+ – Closing short-cover zone
🟡 Neutral Zone:
25,100 to 24,970
Sideways/volatility zone between positive and negative trade views
🔵 Support Zones:
24,970 – Opening S1 Hold CE By Level (Important support)
24,740 – 10M hold CE By Level (Demand zone)
24,538 – Safe Zone for CE holding
📌 Trade Plan:
🔼 Bullish Scenario:
If sustains above 25,138 → expect rally towards 25,330 and 25,390+
Entry near 25,110–25,138 zone (on retest) with SL below 25,070
🔽 Bearish Scenario:
If price breaks below 24,970 → watch for decline towards 24,740 and then 24,538
Entry on breakdown with SL above 25,000
🧠 Sentiment Strategy:
Above 25,138 = bullish bias (Buy on dips)
Below 25,100 = neutral
Below 24,970 = bearish sentiment builds up

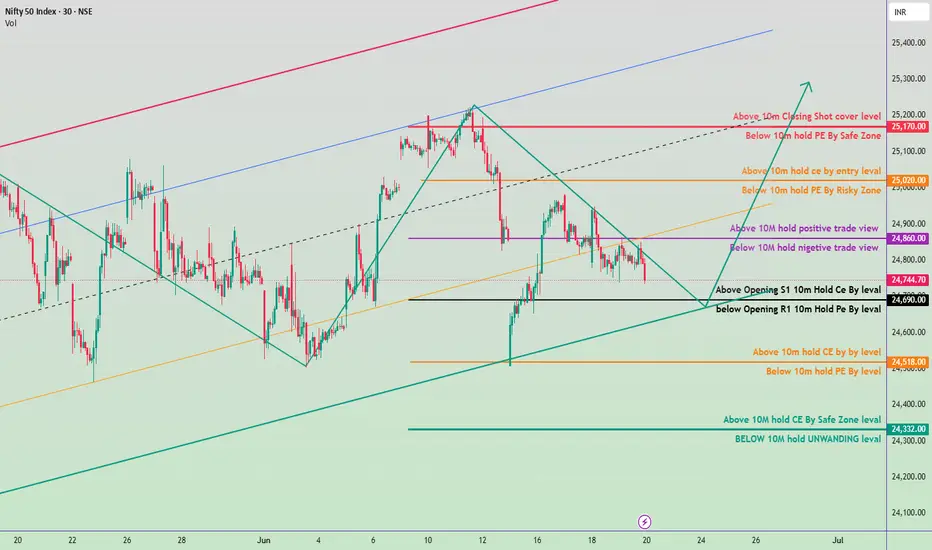
20June Nifty 50 breakdown and brekout levals🟢 Bullish Zones (CE - Call Buyers Support):
Above 25,000 – Entry level for CE
If Nifty sustains above this level, expect aggressive buying.
Target: 25,170 (Safe Zone), then 25,200 (Closing Shot Cover)
24,860 – Positive trade view
Holding above this gives bullish bias; CE can be held with confidence.
Indicates momentum shift toward buyers.
24,744 – Intraday CE Holding Level
Sustaining above this from open = potential move toward 24,860+
24,690 – Opening Support
Above this level for 10 mins = safe for CE traders.
24,518 – Minor CE Holding Zone
CE can be re-entered with small SL.
24,332 – Strong CE Safe Zone
Major support for positional bulls.
🔴 Bearish Zones (PE - Put Buyers Support):
Below 25,000 – Risky Zone for PE
PE entry starts once price fails to sustain above 25k.
Below 24,860 – Negative view
Falling below this adds bearish pressure.
Below 24,690 – Weakness
PE holding possible if sustained below 10 mins.
Below 24,518 – Confirmed PE zone
Can see acceleration downwards.
Below 24,332 – Strong PE momentum
Major breakdown area.
Below 10m Candle UNWINDING Zone – Around 24,200
Heavy PE buyers may dominate below this.
✅ Summary Trade Plan:
Bullish Above: 24,518 →24,720 → 24,860 → 25,000 → 25,170+
Bearish Below: 25,000 →24,860 →24,690 → 24,518 → 24,332
(june 2, 2025) trade plan for tomorrow🔥 99% Working Trading Plan 🔥
(For educational purposes only — trade at your own risk)
📈 Gap-Up Opening Strategy
➡️ If market opens above 24822 and holds for 15 min,
✅ Go LONG — Targets:
• 24940
• 25070
➡️ If market opens below 24822 but fails to break above in 15 min,
❌ Go SHORT — Targets:
• 24688
• 24610
📉 Gap-Down Opening Strategy
➡️ If market opens above 24688 and holds for 15 min,
✅ Go LONG — Targets:
• 24822
• 24940
• 25070
➡️ If market opens below 24688 and fails to break above in 15 min,
❌ Go SHORT — Targets:
• 24618
• 24520
🔒 Trading Rules (Must Follow):
📌 Never enter a trade without a 20-point stop loss
📌 Activate a trade only after 5M 2 candle closes above/below the level
📌 Don’t jump into trades immediately at level — wait for confirmation
📌 Full risk is your own, not me

(May 30, 2025) trade plan for tomorrow 🔼 Bullish Scenarios (Buy above levels)
Above 24,938 (Purple Line)
View: Positive trade view
Target Levels: 25,170 25,370
Above 25,170
Zone: High call writing, if broken, signals strong bullishness.
Target: 25,370
🔽 Bearish Scenarios (Sell below levels)
Below 24,783 (Black Line)
View: Below opening resistance area
Target Levels 24,670 24568
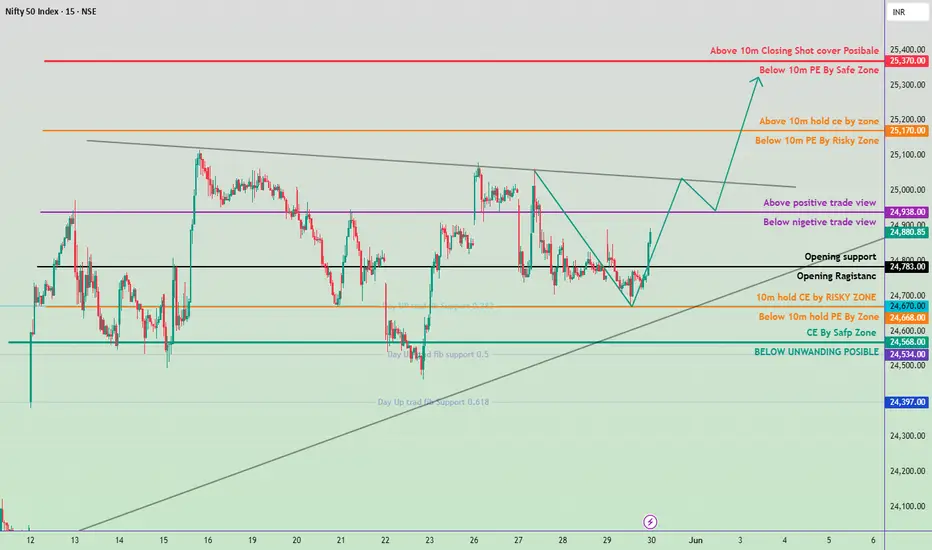
May 29, 2025 Nifty 50 Trading Zone 🔺 Bullish Bias If:
Price sustains above 24,870:
Expect move towards 24,983 (Above 10M CE zone).
Target: 25,170 (Short covering may trigger).
Strategy: Buy on dips above 24,870 with SL below 24,840.
🔻 Bearish Bias If:
Price falls below 24,670:
Likely to test 24,580 and 24,534 ( PE zones).
Break below 24,440 opens downside to 24,397 (unwinding zone).
Strategy: Sell on rise below 24,670 with SL above 24,720.
⚖️ Neutral/Bounce Zone:
Between 24,710 – 24,870:
Choppy moves expected; avoid fresh positions unless breakout confirms.
📌 Key Levels to Watch:
Breakout Level (Upside): 24,870
Breakdown Level (Downside): 24,670
Major Support: 24,397
Major Resistance: 25,170
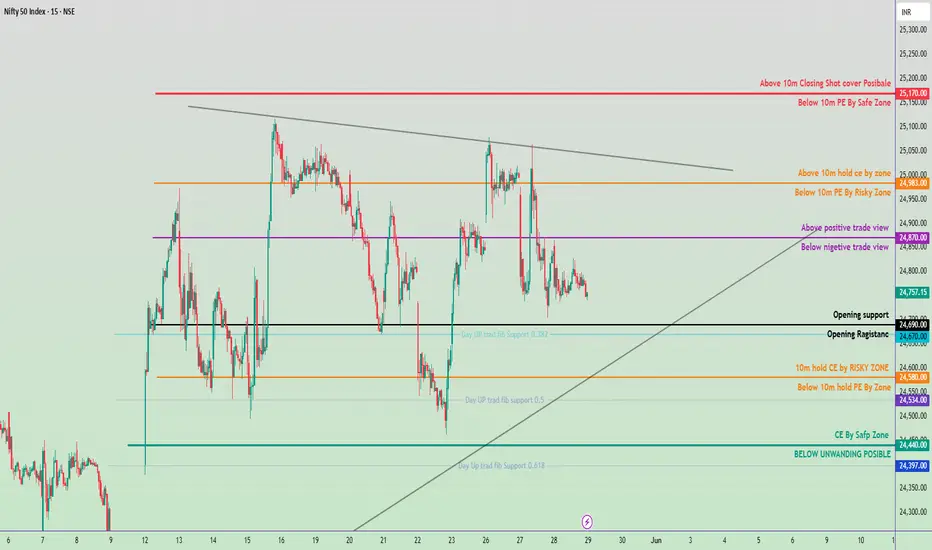
May 27, 2025 Nifty 50 tomorrow prediction Bullish Trade Setup
Entry: Above ₹25,080
Targets:
🎯 Target 1: ₹25,218
🎯 Target 2: ₹25,338
Stop Loss: ₹25060
Reason to Buy:
Above key resistance
Positive trend continuation
Potential short-covering rally
Bearish Trade Setup
Entry: Below ₹24,910
Targets:
🎯 Target 1: ₹24,783
🎯 Target 2: ₹24,610
🎯 Target 3: ₹24,534
Stop Loss: ₹24939
Reason to Sell:
Breakdown from support zone
Risk-off for PE writers
Momentum shift to downside
Pro Tips
Wait for 15-minute candle close above/below trigger levels.
Avoid trading in tight range between ₹24,910–₹25,080 (no clear trend).
Use small position size near expiry or event days.
Track open interest and FIIs/DII data for confirmation.

22 may Nifty50 important levels trading zone#Nifty50 #option trading
🚀 If you like my trading plan and levels, don't forget to boost the post
99% working trading plan
👉Gap up open 24878 above & 15m hold after positive trade target 25078, 25273
👉Gap up open 24878 below 15m not break upside after nigetive trade target 24590, 24390
👉Gap down open 24718 above 15m hold after positive trade target 24878 , 25078
👉Gap down open 24718 below 15m not break upside after nigetive trade target 24618, 24418
📌 Trade plan for education purpose I'm not responsible your trade
More education follow social media and boost my idea
📌 koi bhi trade leval se 20 point ke sl ke bhina karan nahi hi
📌 koi trade app activate tabhi karana hota hi level pe 2 candle uper ya niche closing aati hai to
📌 leval par Ane pe turant trade plan na kare ...
📌 Full risk apaki hi hi meri nahi
