CHoCH + FVG = Institutional Entry Point for Option Traders!Hello Traders!
Today, we’re diving into one of the most powerful Smart Money Concepts — combining CHoCH (Change of Character) with FVG (Fair Value Gap) to identify high-probability institutional entry zones. This setup works brilliantly for both equity and option traders , especially when you want to catch the move before the breakout.
What is CHoCH (Change of Character)?
CHoCH occurs when the market shifts from a bearish to bullish structure or vice versa. It marks the first sign that market structure is shifting , and smart money is potentially stepping in.
What is a Fair Value Gap (FVG)?
An FVG is an imbalance between buyers and sellers. When price moves sharply in one direction, it leaves behind an area (usually 1-2 candles) with no trading activity — that’s the gap smart money fills later to enter or add positions.
Why This Combo Works Like Magic
CHoCH gives confirmation that market direction is changing.
FVG gives the entry zone where big players are likely to buy or sell again.
High Risk-Reward : You’re entering close to where institutions enter — not chasing breakouts.
Ideal for Option Traders looking for momentum entries at discounted zones.
How to Trade This Setup
Wait for a CHoCH on the 5min/15min chart.
Mark the FVG zone created after CHoCH.
Enter near the FVG zone with confirmation (rejection candle, volume spike, or VWAP bounce).
Place stop loss below the FVG and target swing high or based on option premium chart.
Rahul’s Tip
Don’t just chase the breakout. Learn to identify where smart money accumulates before the rally. CHoCH + FVG = sniper-level precision for option scalpers.
Conclusion
This setup is becoming a go-to for institutional-style intraday traders. It’s clean, logical, and extremely efficient when executed with discipline. Start spotting these patterns and backtest your entries — you’ll be amazed by the results!
Have you tried CHoCH + FVG before? Let me know your experience in the comments!
Optiontrading

16th May 2025 Nifty 50 Prediction & Trading Zone#Nifty50 #option trading
🚀 If you like my trading plan and levels, don't forget to boost the post
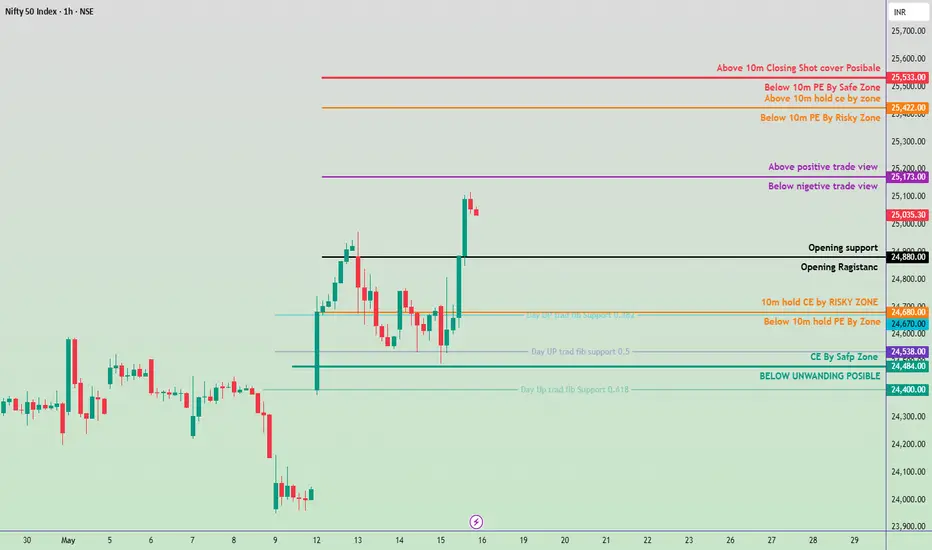
99% working trading plan ( Opning Possibility FLAT to down )
👉Gap up open 25173 above & 15m hold after positive trade target 25422, 25533
👉Gap up open 25173 below 15m not break upside after nigetive trade target 24880 , 24680
👉Gap down open 24880 above 15m hold after positive trade target 25173,25422
👉Gap down open 24880 below 15m not break upside after nigetive trade target 24680, 24500
📌 Trade plan for education purpose I'm not responsible your trade
More education follow social media and boost my idea
📌 koi bhi trade leval se 20 point ke sl ke bhina karan nahi hi
📌 koi trade app activate tabhi karana hota hi level pe 2 candle uper ya niche closing aati hai to
📌 leval par Ane pe turant trade plan na kare ...
📌 Full risk apaki hi hi meri nahi
15th May 2025 Nifty 50 Prediction & Trading Zone#Nifty50 #option trading
🚀 If you like my trading plan and levels, don't forget to boost the post
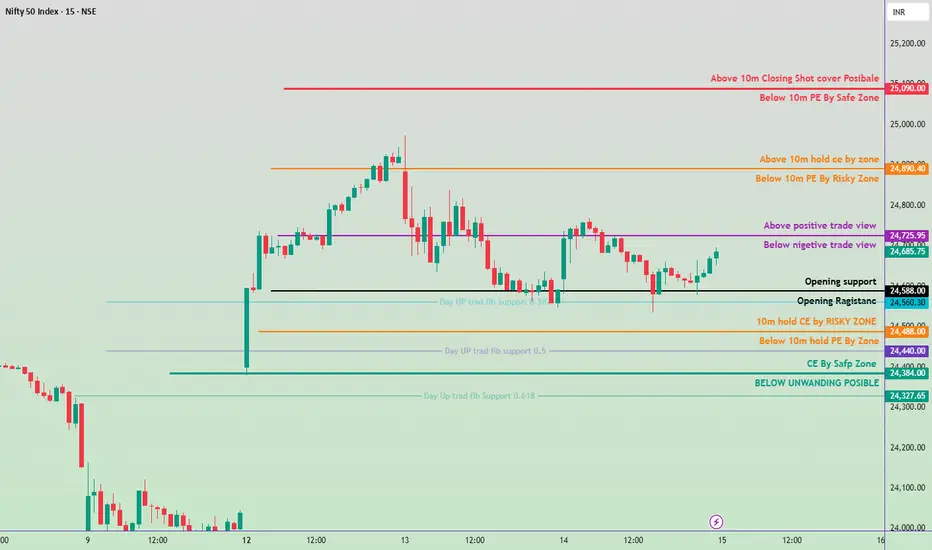
99% working trading plan ( Opning Possibility FLAT TO up )
👉Gap up open 24725 above & 15m hold after positive trade target 24890, 25090
👉Gap up open 24725 below 15m not break upside after nigetive trade target 24588 , 24340
👉Gap down open 24588 above 15m hold after positive trade target 24725 ,24890
👉Gap down open 24588 below 15m not break upside after nigetive trade target 24490, 24384
📌 Trade plan for education purpose I'm not responsible your trade
More education follow social media and boost my idea
📌 koi bhi trade leval se 20 point ke sl ke bhina karan nahi hi
📌 koi trade app activate tabhi karana hota hi level pe 2 candle uper ya niche closing aati hai to
📌 leval par Ane pe turant trade plan na kare ...
📌 Full risk apaki hi hi meri nahi
13th May 2025 Nifty 50 Prediction & Trading Zone#Nifty50 #option trading
🚀 If you like my trading plan and levels, don't forget to boost the post
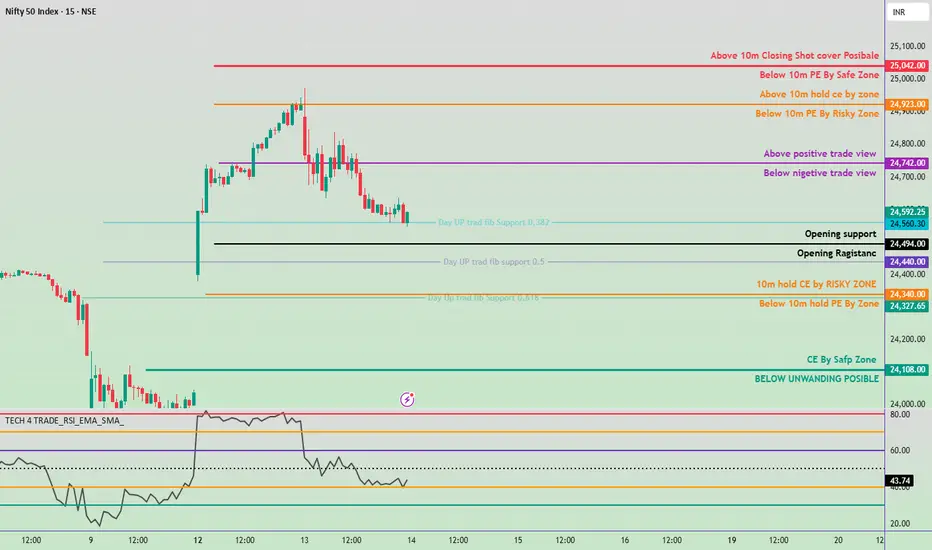
99% working trading plan ( Opning Possibility FLAT TO DOWN )
👉Gap up open 24742 above & 15m hold after positive trade target 24923, 25040
👉Gap up open 24742 below 15m not break upside after nigetive trade target 24490, 24340
👉Gap down open 24490 above 15m hold after positive trade target 24742 ,24923, 25040
👉Gap down open 24490 below 15m not break upside after nigetive trade target 24340, 24108
📌 Trade plan for education purpose I'm not responsible your trade
More education follow social media and boost my idea
📌 koi bhi trade leval se 20 point ke sl ke bhina karan nahi hi
📌 koi trade app activate tabhi karana hota hi level pe 2 candle uper ya niche closing aati hai to
📌 leval par Ane pe turant trade plan na kare ...
📌 Full risk apaki hi hi meri nahi
13th May 2025 Nifty 50 Prediction & Trading Zone#Nifty50 #option trading
🚀 If you like my trading plan and levels, don't forget to boost the post
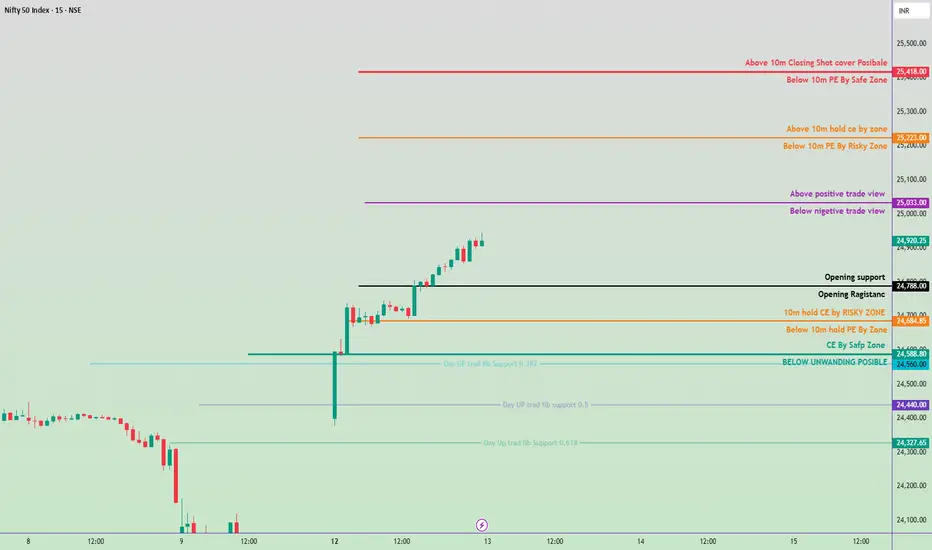
99% working trading plan ( Opning Possibility gap Up)
👉Gap up open 25033 above & 15m hold after positive trade target 25223, 25420
👉Gap up open 25033 below 15m not break upside after nigetive trade target 24788, 24684
👉Gap down open 24788 above 15m hold after positive trade target 25033 ,25223, 25420
👉Gap down open 24788 below 15m not break upside after nigetive trade target 24684, 24588
📌 Trade plan for education purpose I'm not responsible your trade
More education follow social media and boost my idea
📌 koi bhi trade leval se 20 point ke sl ke bhina karan nahi hi
📌 koi trade app activate tabhi karana hota hi level pe 2 candle uper ya niche closing aati hai to
📌 leval par Ane pe turant trade plan na kare ...
📌 Full risk apaki hi hi meri n
7th May Nifty 50 Prediction#Nifty50 #option trading
🚀 If you like my trading plan and levels, don't forget to boost the post
99% working trading plan (Opning Possibility Flat )
👉Gap up open 24414 above & 15m hold after positive trade target 24512,
👉Gap up open 24414 below 15m not break upside after nigetive trade target 24360,
👉Gap down open 24270 above 15m hold after positive trade target 24414 , 24512
👉Gap down open 24270 below 15m not break upside after nigetive trade target 24132, 24030
💫big gapdown open 24132 above 1st positive trade view
💫big Gapup opening 24512 below 1st nigetive trade view
📌 Trade plan for education purpose I'm not responsible your trade
More education follow social media and boost my idea
📌 koi bhi trade leval se 20 point ke sl ke bhina karan nahi hi
📌 koi trade app activate tabhi karana hota hi level pe 2 candle uper ya niche closing aati hai to
📌 leval par Ane pe turant trade plan na kare ...
📌 Full risk apaki hi hi meri na

6th May 2025 Nifty 50 Prediction #Nifty50 #option trading
🚀 If you like my trading plan and levels, don't forget to boost the post
99% working trading plan (Opning Possibility Flat )
👉Gap up open 24518 above & 15m hold after positive trade target 24628, 24880+
👉Gap up open 24518 below 15 m not break upside after nigetive trade target 24360,
👉Gap down open 24360 above 15m hold after positive trade target 24518, 24880
👉Gap down open 24360 below 15 m not break upside after nigetive trade target 24238,
👉 Gap down open Trade NIFTY NIFTY 08 MAY 24400 CALL 82 @
👉 Gap up open Trade NIFTY 08 MAY 24500 PUT 78@
💫big gapdown open 24238 above 1st positive trade view
💫big Gapup opening 24628 below 1st nigetive trade view
📌 Trade plan for education purpose I'm not responsible your trade
More education follow social media and boost my idea
📌 koi bhi trade leval se 20 point ke sl ke bhina karan nahi hi
📌 koi trade app activate tabhi karana hota hi level pe 2 candle uper ya niche closing aati hai to
📌 leval par Ane pe turant trade plan na kare ...
📌 Full risk apaki hi hi meri na

5th may Nifty50 Predictions & trade zone#Nifty50 #option trading
🚀 If you like my trading plan and levels, don't forget to boost the post
99% working trading plan (Opning Possibility Gapup 110point +)
👉Gap up open 24412 above & 15m hold after positive trade target 24512, 24680+
👉Gap up open 24412 below 15 m not break upside after nigetive trade target 24220, 24120
👉Gap down open 24212 above 15m hold after positive trade target 24412 , 24512
👉Gap down open 24212 below 15 m not break upside after nigetive trade target 24120, 23790,
👉 Trade NIFTY 08 May 24550 PE @216 to 390+
💫big gapdown open 24212 above 1st positive trade view
💫big Gapup opening 24512 below 1st nigetive trade view
📌 Trade plan for education purpose I'm not responsible your trade
More education follow social media and boost my idea
📌 koi bhi trade leval se 20 point ke sl ke bhina karan nahi hi
📌 koi trade app activate tabhi karana hota hi level pe 2 candle uper ya niche closing aati hai to
📌 leval par Ane pe turant trade plan na kare ...
📌 Full risk apaki hi hi meri na

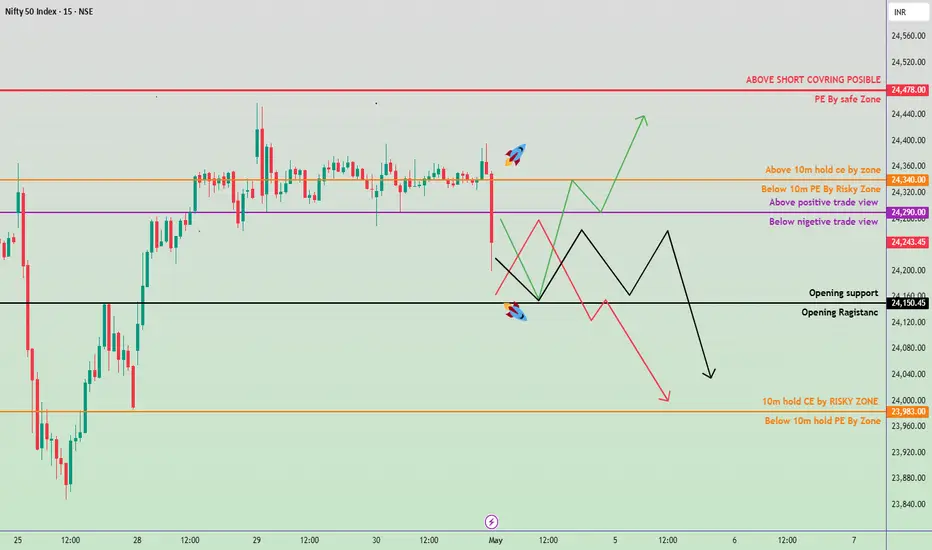
2nd May nifty50 Trading Zone #Nifty50 #option trading
🚀 If you like my trading plan and levels, don't forget to boost the post
99% working trading plan
👉Gap up open 24290 above & 15m hold after positive trade target 24340, 24470+
👉Gap up open 24290 below 15 m not break upside after nigetive trade target 24160, 23990
👉Gap down open 24150 above 15m hold after positive trade target 24340, 24470+
👉Gap down open 24150 below 15 m not break upside after nigetive trade target 23990, 23730,
💫big gapdown open 23987 above 1st positive trade view
💫big Gapup opening 24348 below 1st nigetive trade view
📌 Trade plan for education purpose I'm not responsible your trade
More education follow social media and boost my idea
📌 koi bhi trade leval se 20 point ke sl ke bhina karan nahi hi
📌 koi trade app activate tabhi karana hota hi level pe 2 candle uper ya niche closing aati hai to
📌 leval par Ane pe turant trade plan na kare ...
📌 Full risk apaki hi hi meri nah
30 April Nifty Trade Zone#Nifty50 #option trading
99% working trading plan
👉Gap up open 24470 above & 15m hold after positive trade target 24570,
👉Gap up open 24470 below 15 m not break upside after nigetive trade target 24270 , 24160
👉Gap down open 24270 above 15m hold after positive trade target 24470 , 24570
👉Gap down open 24270 below 15 m not break upside after nigetive trade target 24160, 23873,
💫big gapdown open 24160 above 1st positive trade view
💫big Gapup opening 24570 below 1st nigetive trade view
📌 Trade plan for education purpose I'm not responsible your trade
More education follow social media and boost my idea
📌 koi bhi trade leval se 20 point ke sl ke bhina karan nahi hi
📌 koi trade app activate tabhi karana hota hi level pe 2 candle uper ya niche closing aati hai to
📌 leval par Ane pe turant trade plan na kare ...
📌 Full risk apaki hi hi meri nah

29 April Nifty50 trading Zone#Nifty50 #option trading
99% working trading plan
👉Gap up open 24388 above & 15m hold after positive trade target 24563,
👉Gap up open 24388 below 15 m not break upside after nigetive trade target 24217, 24033
👉Gap down open 24217 above 15m hold after positive trade target 24388 , 24563
👉Gap down open 24217 below 15 m not break upside after nigetive trade target 24033, 23738,
💫big gapdown open 24033 above 1st positive trade view
💫big Gapup opening 24563 below 1st nigetive trade view
📌 Trade plan for education purpose I'm not responsible your trade
More education follow social media and boost my idea
📌 koi bhi trade leval se 20 point ke sl ke bhina karan nahi hi
📌 koi trade app activate tabhi karana hota hi level pe 2 candle uper ya niche closing aati hai to
📌 leval par Ane pe turant trade plan na kare ...
📌 Full risk apaki hi hi meri nah

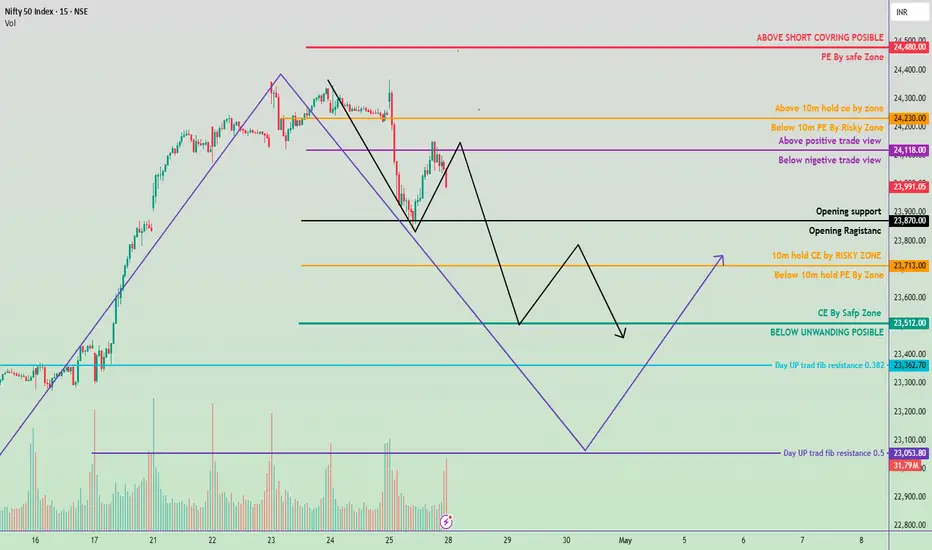
28 april nifty trading zone#Nifty50 #option trading
99% working trading plan
👉Gap up open 24118 above & 15m hold after positive trade target 24230,
👉Gap up open 24118 below 15 m not break upside after nigetive trade target 23870, 23713, 23512
👉Gap down open 24112 above 15m hold after positive trade target 24118 , 24230
👉Gap down open 24112 below 15 m not break upside after nigetive trade target 23870, 23713, 23512
💫big gapdown open 23713 above 1st positive trade view
💫big Gapup opening 24230 below 1st nigetive trade view
📌 Trade plan for education purpose I'm not responsible your trade
More education follow social media and boost my idea
📌 koi bhi trade leval se 20 point ke sl ke bhina karan nahi hi
📌 koi trade app activate tabhi karana hota hi level pe 2 candle uper ya niche closing aati hai to
📌 leval par Ane pe turant trade plan na kare ...
📌 Full risk apaki hi hi meri nah
25 April Nifty Trade zone#Nifty50 #option trading
99% working trading plan
👉Gap up open 24282 above & 15m hold after positive trade target 24362, 24520
👉Gap up open 24282 below 15 m not break upside after nigetive trade target 24188 , 24070
👉Gap down open 24188 above 15m hold after positive trade target 24282 , 24362
👉Gap down open 24188 below 15 m not break upside after nigetive trade target 24072, 24948
💫big gapdown open 24072 above hold 1st positive trade view
💫big Gapup opening 24362 below nigetive trade view
Trade plan for education purpose I'm not responsible your trade
More education follow & support me
📌 koi bhi trade leval se 20 point ke sl ke bhina karan nahi hi
📌 koi trade app activate tabhi karana hota hi level pe 2 candle uper ya niche closing aati hai to
📌 leval par Ane pe turant trade plan na kare ...
📌 Full risk apaki hi hi meri nah

Straddle Selling in Sideways Market – Full Risk-Reward Strategy!Hello Traders!
Sideways market eating your premiums? Don’t worry — this is where option sellers shine the brightest. One of the most reliable setups in a consolidating market is the Short Straddle Strategy . Today, I’ll break down exactly how to deploy a straddle in a range-bound market , along with proper risk-reward planning, adjustments, and exit rules .
What is a Short Straddle?
You sell both a Call (CE) and a Put (PE) at the same strike price (ATM) .
Ideal for low volatility , range-bound days where you expect limited movement in either direction.
The maximum profit is earned when the index or stock stays near the strike price till expiry or exit.
When to Use This Strategy
CPR Narrow + Inside Previous Day Range → Indicates consolidation
VIX Falling or Low (Below 13–14): → Lower volatility supports premium decay
No Major Events or News Expected: → Avoid directional shocks
OI Buildup at ATM Strike: → Signals strong range expectation
Risk-Reward Setup & Management
Entry Time: Ideal between 9:45–10:15 AM after range is confirmed.
Stop Loss: Set a combined premium SL of 25–30% or exit on sharp one-sided breakout.
Adjustments: If breakout starts, shift legs (convert into strangle) or buy hedge OTM options.
Exit Time: Usually 1:1.5 RR is achievable by 12:30–2:30 PM on calm days.
Rahul’s Tip
“Straddle selling is not about predicting direction — it’s about predicting no direction.” Respect the structure. If price stays inside the trap, you win by default.
Conclusion
The Short Straddle Setup is perfect for range-bound conditions, especially in Bank Nifty or Nifty. With clear entry, SL, and adjustment rules , you can earn steady returns from time decay — but only if you stay disciplined.
Do you use straddles? What’s your favorite expiry day setup? Drop it in the comments below!

23 April nifty50 trade zone #Nifty50 #option trading
99% working trading plan
👉Gap up open 24170 above & 15m hold after positive trade target 24220,
👉Gap up open 24170 below 15 m not break upside after nigetive trade target 24112, 24030, 23970
👉Gap down open 24112 above 15m hold after positive trade target 24170, 24220
👉Gap down open 24112 below 15 m not break upside after nigetive trade target 24030, 24970
💫big gapdown open 24036 above 1st positive trade view
💫big Gapup opening 24220 below 1st nigetive trade view
📌 Trade plan for education purpose I'm not responsible your trade
More education follow & support me
📌 koi bhi trade leval se 20 point ke sl ke bhina karan nahi hi
📌 koi trade app activate tabhi karana hota hi level pe 2 candle uper ya niche closing aati hai to
📌 leval par Ane pe turant trade plan na kare ...
📌 Full risk apaki hi hi meri nah

22 April nifty trading zone#Nifty50 #option trading
99% working trading plan
👉Gap up open 24238 above & 15m hold after positive trade target 24508,
👉Gap up open 24008 below 15 m not break upside after nigetive trade target 24008, 23853
👉Gap down open 24008 above 15m hold after positive trade target 24238 , 24508
👉Gap down open 24008 below 15 m not break upside after nigetive trade target 23853, 23653
💫big gapdown open 23853 above hold 1st positive trade view
💫big Gapup opening 24508 below nigetive trade view
📌 Trade plan for education purpose I'm not responsible your trade
More education follow & support me

Bank Nifty 1st 15 Minutes Setup–The Secret Timing of Big PlayersHello Traders!
Ever wondered why big moves in Bank Nifty often start right after 9:30 AM? That’s because the first 15 minutes set the stage for the day. Smart money watches how price reacts during this period and then makes their move. Today, let’s decode the First 15-Minute Setup for Bank Nifty — a strategy I personally use to ride momentum and avoid traps.
Why the First 15-Min Candle is So Powerful
Price Discovery Zone: It’s where volatility is highest and range gets defined.
Volume Spike Clue: Big players enter here — high volume = potential direction clue.
It Defines Day Bias: A breakout of this candle often tells if the day is going to trend or chop.
How to Trade the First 15-Min Setup in Bank Nifty
Step 1 – Mark the High & Low of the First 15-Min Candle
→ This becomes your decision zone.
Step 2 – Wait for Breakout with Confirmation
→ Only enter when a 5-min candle breaks the range and closes above or below with strong volume.
Step 3 – Entry & Stop Loss
→ Entry: After breakout with volume confirmation
→ Stop Loss: Other side of the 15-min candle
→ Target: 1:2 RR or previous day’s high/low
Step 4 – Bonus Confirmation:
Check Option Chain — OI shift or unwinding adds more strength to the breakout.
When This Setup Works Best
On Expiry Days: Quick premium moves make this strategy powerful.
During News-Free Sessions: Clean moves with fewer fakeouts.
On Trending Days: Works great with gap-up/gap-down open followed by consolidation.
Rahul’s Tip
“Don’t rush into the market at 9:15. Let the big boys act first — then ride their wave.” Patience in the first 15 minutes gives you clarity for the entire day.
Conclusion
The First 15-Min Candle Setup in Bank Nifty is a simple yet powerful intraday strategy. When combined with volume, price action, and OI shift , it helps you catch clean breakouts and avoid choppy fakeouts.
Have you used this setup before? Or do you wait even longer? Share your approach in the comments below!

Survive & Succeed as an Option Buyer – Use This 2-Step Filter!Option Buyer’s Survival Setup – Only Trade When These 2 Conditions Match!
Hello Traders!
Option buying can be highly rewarding — but only if done with timing and logic. Most option buyers lose money not because of direction, but because they enter trades when volatility and structure don’t support the move . Today, let’s uncover a simple but powerful setup I use that helps option buyers survive and thrive by trading only when two key conditions align.
The 2 Conditions for Option Buyers’ Survival
1. Price Action Confirmation:
Always enter trades when the price breaks key levels with a strong candle and volume confirmation .
→ Look for breakout/rejection candles, bullish/bearish engulfing, or range breakout retest setups .
2. IV/VIX Support for Momentum:
Check India VIX or option premiums.
→ Trade only when VIX is supportive (e.g., rising or above 13–14) to allow enough premium expansion.
→ Avoid buying in low VIX chop zones unless supported by strong news or breakout.
Why This Setup Works So Well
Avoids Time Decay Traps: You enter only when a move is expected — not during sideways chop.
Improves RR Ratio: Strong confirmation = better entry + reduced SL hits.
Filters Out Noise: Stops you from overtrading every price move and focuses only on high-conviction trades.
Bonus Tips for Buyers
Prefer ATM Options in Momentum Trades for better delta and faster movement.
Exit Partial at 30–40% Move and trail remaining to maximize runners.
Don’t Trade Every Move — Wait for these 2 rules to align, or skip.
Rahul’s Tip
Being an option buyer is tough – unless you're selective. Don’t buy hope. Buy confirmation. Let structure and volatility guide your trade.
Conclusion
Option buying is a game of survival and sharp entries. If you follow these 2 key rules — structure + volatility confirmation — you’ll avoid unnecessary SL hits and capture the real moves. Discipline is your edge.
What’s your personal filter before buying options? Share below and let’s learn together!

The Psychology Behind Holding Option Trades to the Targets!Hello Traders!
Entering a trade is easy, but holding it with conviction till the target hits — that’s where 90% of traders fail. Most of the time, we exit early out of fear, impatience, or seeing quick profits vanish. Today, let’s understand the psychology behind holding option trades and how to set yourself up for patience and discipline .
Why We Exit Too Early?
Fear of Losing Unrealized Profits: The moment your trade shows green, the mind screams “book now!” even when the setup is still valid.
Overtrading Mentality: You want to book fast and re-enter again, leading to emotional and scattered trades.
Lack of a Clear Plan: If you don’t have a defined target, SL, and reason to hold , you’ll exit at the first sign of volatility.
How to Develop the Patience to Hold Trades
Visualize Your Trade Before Entering: Ask yourself — “What will I do if price pulls back after entry?” Plan your SL, target, and trailing logic beforehand.
Use Alert Zones, Not Constant Monitoring: Watching every tick increases anxiety. Instead, set alerts at key levels and focus on the logic, not emotions.
Risk What You’re Comfortable With: If your position size is too big, you’ll panic during small reversals. Right sizing = calm holding.
Follow Structure Over Emotion: Hold as long as price is above VWAP/Trendline/Support (for longs). Only exit if structure breaks.
Rahul’s Tip
“The market rewards patience more than perfection.” If your analysis was right, trust it. Let the trade breathe. Stop treating every green candle as your exit point.
Conclusion
The biggest wins in options trading come when you hold with discipline . Build a setup where your entry has logic, your exit has structure, and your mind stays calm in between. That’s how you train yourself for consistency — not by chasing, but by mastering patience .
How long do you usually hold your option trades? Let’s talk about it in the comments below!

what is option chain pcr ?The Put-Call Ratio (PCR) is a popular technical indicator used by investors to assess market sentiment. It is calculated by dividing the volume or open interest of put options by call options over a specific time period. A higher PCR suggests bearish sentiment, while a lower PCR indicates bullish sentiment.
bearish
The Put-Call Ratio (PCR) is a useful indicator to understand the market sentiment at any given time. A high PCR suggests a bearish market, while a low PCR signals bullish tendencies. It helps investors assess whether the market is leaning towards optimism or pessimism, which can shape investment strategies.
A good PCR ratio depends on the market context, but generally, a PCR below 0.7 indicates bullish sentiment (potential market rise), while a PCR above 1.2 suggests bearish sentiment (potential market decline)

Use of RSI in tradingThe Relative Strength Index (RSI) is a technical indicator that helps traders assess the momentum of an asset's price. It's used to identify overbought and oversold market conditions, and to provide buy and sell signals
How to use RSI
Identify overbought and oversold conditions
RSI values above 70 indicate overbought conditions, while values below 30 indicate oversold conditions.
Confirm trends
Use the RSI to validate trends and trend reversals. For example, a downward trend is confirmed when the RSI crosses from above 50 to below 50.
Provide buy and sell signals
Use the RSI to determine when to enter and exit positions. For example, low RSI levels indicate oversold conditions, which may generate a potential buy signal.
Combine with other indicators
Use the RSI with other technical indicators to identify market trends and confirm signals. For example, you can combine RSI with moving averages to identify strong assets in uptrends

Niftybank moments for option trading 19/nov/2024Niftybank moments for option trading 19/nov/2024
follow us for more updates information.
WELCOME TO ARROWINDEX
We're dedicated to providing you the best of Finance stock market , with a focus on dependability and Investment. We're working to turn our passion for Finance stock market into a booming online.We analyze Live Market and try to Provide learning information Content. All the Live Market views and charts .We hope you enjoy our Finance stock market as much as we enjoy offering them to you.Support and offering
Effective online education modules for all segments of traders
Customized portfolio tracker Online research & trading guidance
Entry and Exit support for:-
Intraday trading,Swing trading,Scalping,Position trading
Future & Delivery trading
Technical analysis
Fundamentals analysis
Fii & Dii data and reports

Nifty level for option trading 15/11/2024 Arrowindex :- Nifty level for option trading 15/11/2024
follow for more updates and information.
