OFSS (ORACLE FIN SERVICE) By KRS Charts5th June 2025 / 12:35 PM
Why OFSS?
1. Fundamentally Good Company.
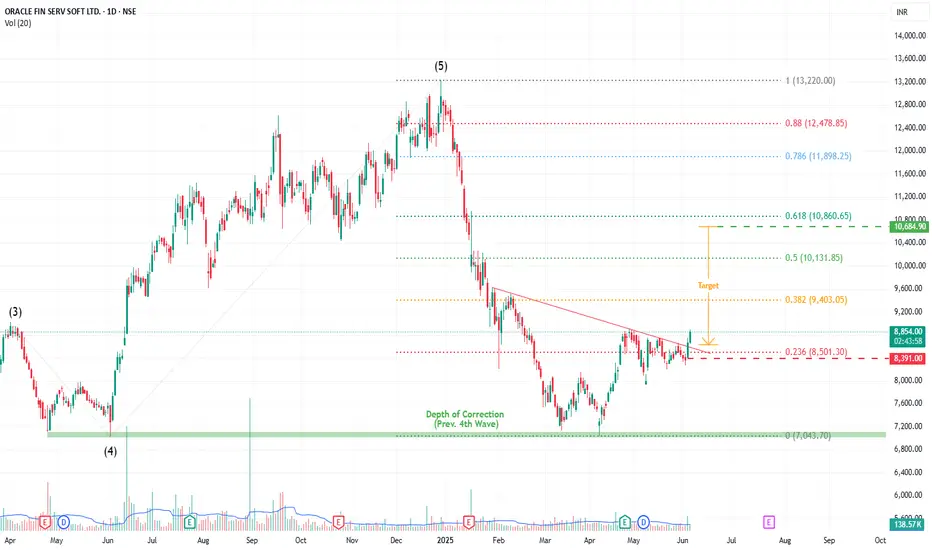
2. Technically, Bullish Stock for a long time and here again made higher low on bigger time frame.
3. Wave Theory vice it bounces back from 4th impulsive wave (Depth of Correction).
4. After that it has formed few bullish charts pattern like Invt. Head & Shoulder and Flag and Pole is also visible within.
5. Yesterday it Broke Neckline with good volume green candle.
Targets & SL (1D Closing Basis) is mentioned in Chart
Oraclefinanicalservies
OFSS: Setting Up for a Relief Rally?🔍 Introduction
This analysis starts from the 1-hour timeframe, where price action shows signs of exhaustion at the tail end of a 5-wave decline. A classic ending diagonal in wave c, along with bullish RSI divergence, points toward a potential short-term reversal — possibly the start of Wave B in a larger A-B-C corrective structure. We then zoom out to place this setup within a broader W-X-Y correction that began from the 13,220 high.
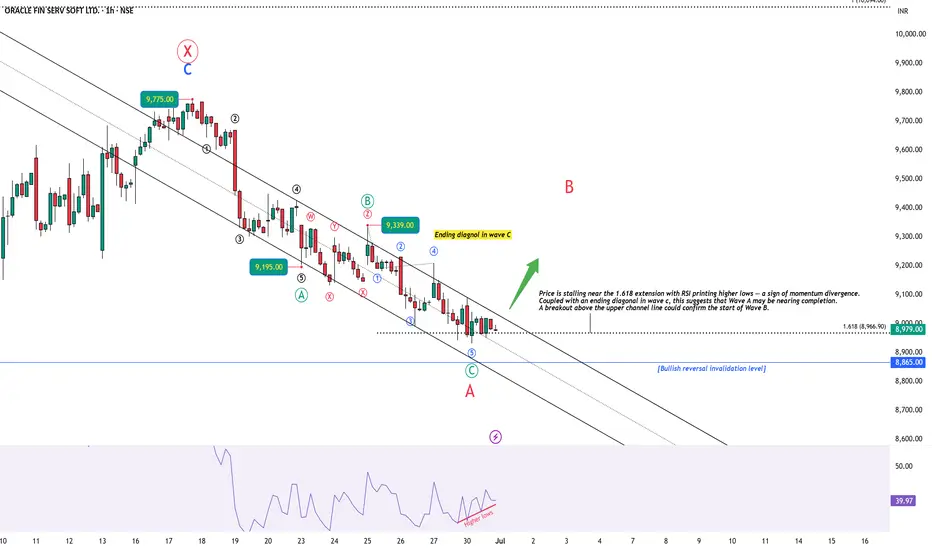
🕐 1H Chart: Ending Diagonal + RSI Divergence into Key Zone
Following the peak at 9775, price has been declining in what appears to be a ABC zigzag correction. Subwave 5 (within wave c) exhibits ending diagonal behavior, with overlapping internals and weakening thrust. Importantly, RSI has been printing higher lows, diverging strongly against lower price lows — a signal of potential bottoming.
Price is also testing the 1.618 Fibonacci extension level. A decisive breakout above the upper trendline would confirm a likely transition into Wave B.
🟢 Watching closely for a decisive breakout / close above the channel.
📆 Daily Chart: W-X-Y Structure from 13,220 High
Zooming out, ORACLE FIN SERV is unfolding a W-X-Y correction from its 13,220 high:
Wave W completed as a zigzag down to 7038.
Wave X unfolded as a zigzag rally, peaking at 9775. Notably, Wave C of X did not reach 100% of Wave A — signaling internal weakness.
Wave Y is now developing as a red A-B-C structure, with Wave A possibly ending near the 8930 level.
🧠 Conclusion & Key Levels to Watch
Wave A of Y appears to be nearing completion, supported by:
Ending diagonal structure in wave C (1H)
RSI bullish divergence
Price stalling at 1.618 extension
A breakout above the channel could mark the start of Wave B — potentially retracing 38–61.8% of the drop from 9775
📌 This setup offers both short-term and structural clues. I’ll post follow-ups as this unfolds.
⚠️ Disclaimer
This post is for educational purposes only and does not constitute financial advice. Please do your own research and manage risk appropriately.
OFSS chart 150% move in a year💥OFSS chart 150% move in a year💥
Fibonacci levels played so well in this chart pattern and great move after the 50% Fibonacci levels.
Lines drawn an year back aged well and now it shows how chart resists on those levels of 8200 levels.
No recommendations, just my view on the chart that fetched great result.

Oracle Financial Services Software Ltd - 02.09.2022Oracle Financial Services Software Ltd - 02.09.2022
The stock is trading @ 3147 levels
The PRICES ARE BELOW EMA
There is a BULLISH HARAMI in Daily Chart
There is a SPINNING TOP in Daily Chart
STOCHASTIC is Oversold in Daily Chart
The Fibonacci Retracement 61.8% is 3172
Let the prices go above 3175
Watch out for the price action

Intraday trade in OFSS !!!!OFSS has formed a double bottom structure in hourly charts with MACD crossover , which shows it can once again test the levels of 3700-3750.
Long OFSS near 3600-3625.

OFSS LOOKING GOOD TO BUY @ CMP 3936OFSS is looking good to Buy at the current level and is expected to reach marked levels on the chart in upcoming sessions.
To motivate us, Please like the idea If you agree with the analysis.
Happy Trading!
InvestPro India Team

ORACLE FINANCIAL SEVICESNSE:OFSS is a very good fundamental company.
right now stock is making rounding patterns in a daily frame.
and taking strong support at 4399.
one can buy this stock for a short-term target of 4930.

Trend line support - short term2.7% upside expected, if closes above 3750 then potential for 4000 levels.
Explained on the chart with text.
Please refer to it.

Oracle Financial Services Software Ltd. - Trendline formationOracle Financial Services Software Ltd. - Trendline formation


OFSS - LONG TERM SIP+ Dividend playPeople Invest in ITC and other PSU for dividend and whatever dream of growth they see in those stocks !!
Here is OFSS.. U cant get better fundamentals than this Stock..
According to me , this is the cheapest IT stock available in the market and a safe bet !!!
DIVIDEND YEILD - 5.5% at CMP !!! what else do u want ? rather than making a mutual fund SIP or doing FD , buy this stock..
SL and Upper levels visible in charts !!
one can SIP too

OFSS - Break out with decent volumes - @mayurdharodNSE:OFSS breaks out with decent volumes. Buy above todays high and trail.

oracle financial services ltd If it breaks the resistance zone then you can enter
Targets are mentioned on the chart
Note: This is my view, you should do your analysis before taking any action.
