MIRZAINT – Cup & Handle Breakout | Daily Chart📊 MIRZAINT – Cup & Handle Breakout from Order Block | RVol 349% | RSI Near Overbought | Daily Chart
📅 Chart Date: July 8, 2025
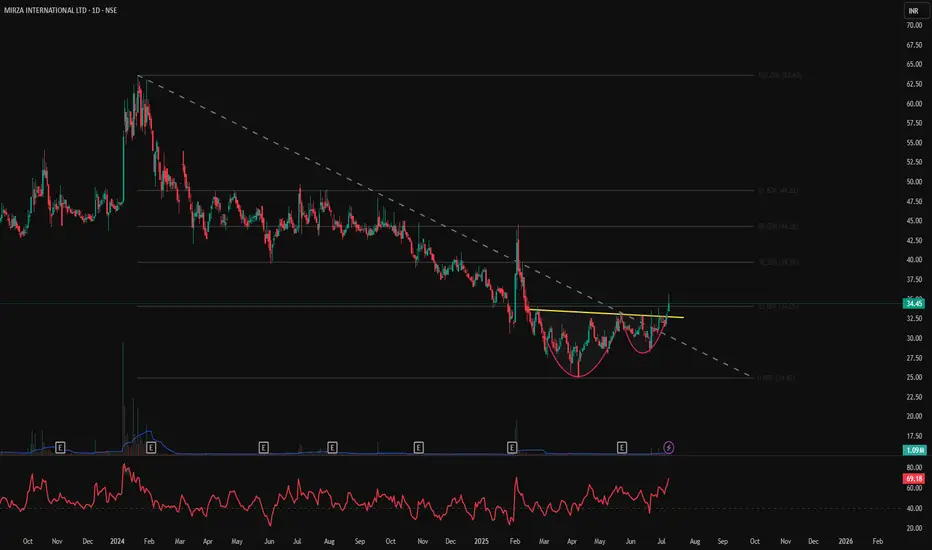
📍 CMP: ₹34.45 (+4.71%)
📈 Symbol: NSE:MIRZAINT
🔍 Technical Analysis Breakdown
☕ Cup & Handle Breakout
Classic Cup & Handle pattern breakout above neckline resistance at ~₹33.
Smooth rounding bottom base followed by tight consolidation and bullish breakout.
🟥 Volumized Order Block (OB) Analysis
Previous Supply Zone: Between ₹41–₹49.5.
Demand Zone: ~₹24–₹26, previously respected.
Breakout occurred from a fresh bullish 1D OB .
📈 Relative Volume (RVol%): 349%
Significant volume spike confirms strong buying interest behind the breakout.
📐 Measured OB Data
1.542M (44%) red OB supply previously pushed price down.
Bullish OB of 795.893K (18%) supported accumulation phase pre-breakout.
📊 RSI (14, close): 69.18
Approaching overbought zone (>70), confirming strong trend but may see minor consolidation.
🏁 Key Technical Levels
Breakout Level (Neckline): ₹33.00
CMP: ₹34.45
Resistance Ahead: ₹41.00 → ₹49.50 (previous OB supply zone)
Support: ₹30.00 / ₹26.00 (OB base)
💡 Trade Setup Insight
Entry: CMP on breakout or retest near ₹33
Target 1: ₹41
Target 2: ₹49+
Stoploss: Below ₹30 or ₹26 (OB base zone)
Risk Profile: Moderate to Aggressive
⚠️ Disclaimer: This is an educational chart setup and not trading advice. Please conduct your own research and risk management.
📣 Follow @PriceAction_Pulse for more such clean breakouts and chart pattern analysis!
🔁 Drop a comment if TFCILTD is on your radar for the next breakout rally 📈
Orderblockanalysis
Avanti Feeds NSE (Mid to Long Term)Date- 15 March 2024
Time - 10 Am
Points to be Noted-
1. As we can see, Avanti Feeds breakout from its long-term triangle formation with Inverted Head & Shoulder Chart Pattern with strong Volume Green Candle.
2. As supporting indicator MACD is showing Seller Exhaustion with decent bullish movement so far.
3. I know we are little late but one more concept call, Poisitve Order Block with FVG (Fair Value Gap) is also applied now for more bullish confirmation.
Approx Targets we can see in Chart as per previous resistances and +order block.
Close this trade if Price move down and close below 420 on a weekly candle.
Thank You!

AUDUSD - SHORT ANALYSIS - We are looking at AUD/USD which clearly respects SMC and moves in a proper orderflow.
- We are also looking at a higher time frame and i will start looking for shorts in LTF, such as 15M, 5M when market bumps into our POI.
- Target is going to be 1:20 with the most tighest stoploss.
