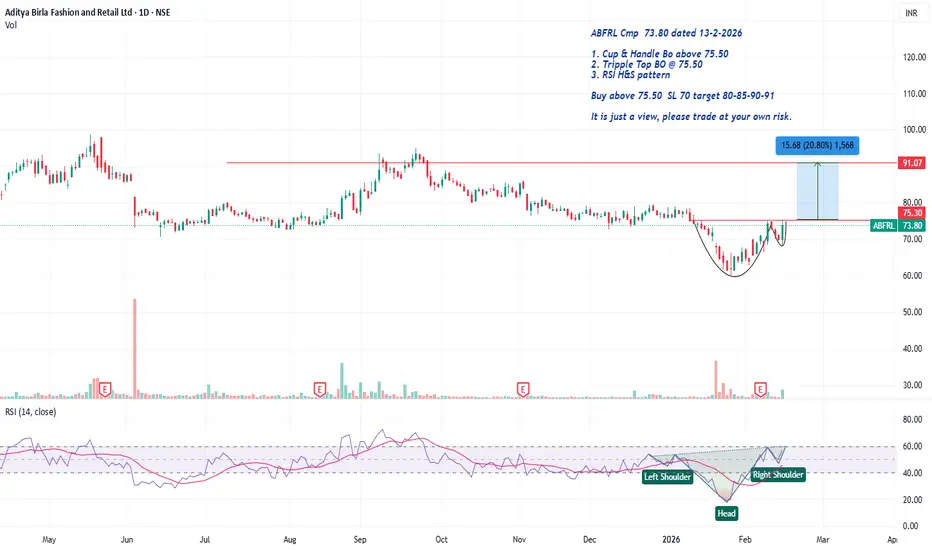
ABFRL Cmp 73.80 Cup & Handle BoABFRL Cmp 73.80 dated 13-2-2026
1. Cup & Handle Bo above 75.50
2. Tripple Top BO @ 75.50
3. RSI H&S pattern
Buy above 75.50 SL 70 target 80-85-90-91
It is just a view, please trade at your own risk.
Oscillators
ZEEL RSI DIVERGENCEZEE Enterprises Limited is showing a strong Bullish RSI Divergence on the monthly chart.
Neither am I SEBI registered nor it's a trade recommendation. For educational purpose only.

Sterlite Tech (W): Aggressive Bullish (Decadal Breakout)(Timeframe: Weekly | Scale: Logarithmic)
The stock has confirmed a breakout from a 10-Year Symmetrical Triangle (2014–2025). Unlike previous attempts (which left long upper wicks), this week shows a strong closing candle above the resistance, supported by "Climax Volume."
🚀 1. The Fundamental Catalyst (The "Why")
The technical explosion is fueled by a structural shift in business prospects:
> US Market Opening: The reduction in US tariffs removes a major overhang, making STL competitive in its largest market again.
> Promoter Buying: The warrant issue at ₹110 sets a psychological floor. The market knows promoters are "all-in."
> Brokerage Upgrades: Recent reports (e.g., Nuvama) have raised targets to ₹200+, adding institutional credibility to the rally.
📈 2. The Chart Structure (The Decade Squeeze)
> The Pattern: The Symmetrical Triangle active since 2014.
> Resistance: The downward sloping trendline connecting peaks of 2018 (₹300+) and 2021 (₹200+) was passing through ₹145–₹150 .
> The Breakout: The stock closed the week at ~₹155 , confirming the jailbreak.
> Golden Crossover: On the Daily chart, the 50-DMA is rapidly approaching the 200-DMA from below. A crossover is imminent, which often triggers algorithmic buying.
📊 3. Volume & Indicators
> Volume Ignition: The volume is not just "high"; it is historic . This level of churn suggests a complete change of hands from "tired investors" to "fresh smart money."
> RSI: Rising sharply. Note that RSI is entering the "Overbought" zone (>70) on Weekly/Daily. In strong breakouts, RSI should remain overbought; it is a sign of strength, not a sell signal.
🎯 4. Future Scenarios & Key Levels
The stock has entered "Markup Phase."
🐂 Bullish Targets (The Extension):
- Target 1: ₹200 – ₹216.
- Target 2: ₹295.
🛡️ Support (The "Must Hold"):
- Immediate Support: ₹140 – ₹145. The breakout zone must now act as a rigid floor ( Polarity Principle ).
- Stop Loss: A weekly close below ₹130 would signal a "False Breakout" (Bull Trap).

NTPC (D): Bullish (Golden Crossover + Base Breakout)(Timeframe: Daily | Scale: Linear)
The stock is on the verge of a major structural breakout from a 10-month consolidation base. The occurrence of a Golden Crossover (50 SMA > 200 SMA) confirms that the long-term trend has officially shifted from "Correction" to "Uptrend."
🚀 1. The Fundamental Catalyst (The "Why")
The technical strength is supported by solid numbers:
> Q3 Earnings Support: The recent Q3 FY26 results (Jan 30) showed stable operational performance with an 8% profit jump. This removed the "Event Risk," allowing institutions to re-enter.
> Valuation Comfort: Trading at a P/E of ~14.5x, NTPC remains attractive compared to private power peers. The dividend of ₹2.75 (Record Date: Feb 6) has also kept the stock supported.
> Monitorable (NGEL): Note that its subsidiary, NTPC Green Energy (NGEL) , is currently trading weak (around ₹89-90). A reversal in NGEL would act as an additional booster for NTPC.
📈 2. The Chart Structure (The Box)
> The Base: ₹315 – ₹370 range. The stock spent nearly a year in this zone.
> The Resistance: The ₹370 – ₹372 level is the "Lid." (This also aligns with the recent 52-week high in Mar 2025).
- Current Status: The stock is knocking on this door. A close above ₹372 will trigger a "Box Breakout."
📊 3. Volume & Indicators
> Golden Crossover: The 50-Day SMA crossing the 200-Day SMA is the headline signal. Historically, for PSU stocks, this signal often precedes a 15-20% rally over the next 3-6 months.
> RSI: Rising in all timeframes. It has room to run before hitting "Extreme Overbought" levels (80+).
🎯 4. Future Scenarios & Key Levels
The stock is primed for a new leg up.
🐂 Bullish Targets (The Breakout):
- Trigger: A decisive Daily Close above ₹372.
- Target 1: ₹390.
- Target 2: ₹415.
🛡️ Support (The "Must Hold"):
- Immediate Support: ₹352. this is a strong swing low.
- Stop Loss: A close below ₹345 (200-Day SMA) would invalidate the Golden Cross and signal a "Bull Trap."
Conclusion
This is a High-Reliability Setup.
> Refinement: The Golden Cross makes this a "Portfolio Grade" buy signal, not just a swing trade.

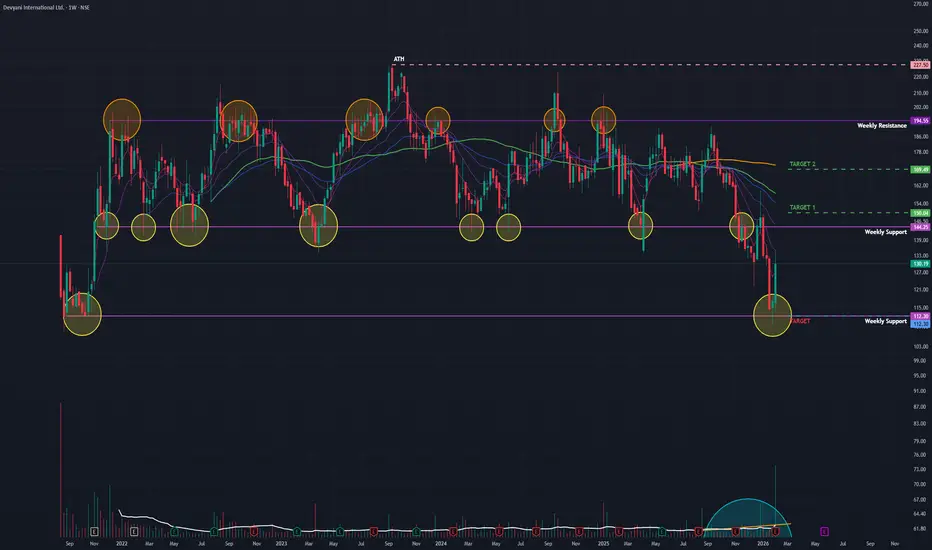
Devyani Int (W): Aggressive Bullish, Turnaround at Major Support(Timeframe: Weekly | Scale: Logarithmic)
The stock has confirmed a major "V-Shape Reversal" from its long-term support zone of ₹110. The surge is backed by "Climax Volume" and a positive reception to its Q3 operational updates, signaling that the 2-year correction might be over.
🚀 1. The Fundamental Catalyst (The "Why")
The technical reversal is driven by a shift in sentiment:
> Q3 FY26 Earnings: The market focused on the positives— Revenue up 11% YoY and operational efficiency improvements—ignoring the bottom-line loss.
> Management Change: The announcement of a new CEO (effective April 1) has been viewed as a positive step for future strategy.
> Valuation Comfort: After falling ~30% in the last year, the stock had priced in most negatives at ₹110.
📈 2. The Chart Structure (The Base)
> The Support (The Floor): At ₹112 level. This zone has been a demand magnet since 2022.
- Confirmation: The Weekly Hammer followed by a massive Green Candle (Marubozu-like) confirms a "Morning Star" type reversal.
> The Volume: The 116 Million volume is an "Institutional Stamp." Retail traders typically cannot generate this volume; it indicates that big funds are "bottom fishing."
📊 3. Technical Indicators
> RSI: Rising from the Oversold zone. This "V-turn" in RSI usually precedes a sharp recovery rally.
> Price Action: The stock has closed above its short-term moving averages (20-Day EMA), signaling a trend shift.
🎯 4. Future Scenarios & Key Levels
The stock is now in "Recovery Mode."
🐂 Bullish Targets (The Pullback Rally):
- Target 1: ₹150.
- Target 2: ₹170.
🛡️ Support (The "Must Hold"):
- Immediate Support: ₹120 – ₹123.
- Stop Loss: A weekly close below ₹110 would invalidate the entire reversal structure.
Conclusion
This is a Grade A Reversal Setup.
> Refinement: The "Hammer" was the signal; the "Earnings Volume" was the confirmation.
> Strategy: The reversal is valid. Use any dip to enter/add.
Bitcoin: Post-Impulse Correction Near the Golden RatioRead time: ~3–4 minutes
The Bigger Picture
Bitcoin completed a clean, non-overlapping 5-wave impulse from the cycle lows, respecting a well-defined rising channel. This structure suggests the broader trend remains intact, but every impulse must correct — and that phase is now underway.
Transition from Impulse to Correction
Following the completion of the full 5-wave advance, price shifted into a corrective mode . The decline so far has been controlled and channel-bound , indicating a correction rather than a structural breakdown.
Importantly, price continues to trade inside the rising channel , keeping the higher-timeframe trend technically valid — for now.
Fibonacci Context: Where Things Get Interesting
The ongoing correction is now approaching the classic 0.5–0.618 Fibonacci retracement zone , a typical depth for a Wave (2) pullback after a strong impulse.
This area also overlaps with:
A former supply zone
A potential supply → demand transition area
Prior reaction zones within the channel
That confluence makes this a high-attention zone , not an automatic buy.
Reversal Zone: What Actually Matters
A meaningful reversal from this region requires confirmation , not assumptions.
Key characteristics to watch for:
RSI bullish divergence
Bullish engulfing candle
Hammer or long lower-wick rejection
No signals = no reversal. Price alone doesn’t qualify.
A Reality Check on Depth
While the 0.5–0.618 zone is typical, retracements can be deep .
If price fails to hold this region, the correction may extend into:
A deeper retracement toward 0.786 , or
A more complex corrective structure (WXY)
Until momentum confirms, this remains a watch zone , not a conviction zone.
Why Track Bitcoin Even If You Don’t Trade It?
Bitcoin acts as a global risk and liquidity barometer .
It often moves ahead of equities , reflecting shifts in risk appetite and capital flow before traditional markets react. Even for non-crypto participants, BTC offers valuable insight into broader market psychology.
Final Take
Structure remains corrective within a larger uptrend
Key support lies near the golden Fibonacci zone
Confirmation is mandatory before calling a bottom
A break below this zone would delay or invalidate the bullish continuation thesis
Disclaimer:
This analysis is for educational purposes only and does not constitute investment advice. Please do your own research (DYOR) before making any trading decisions.

Trent Ltd Cmp 3823 Bullish Engulfing Candle @ supportTrent Ltd Cmp 3823 dated 3-2-2026
Weekly chart (Positional)
1. Bullish Engulfing Candle @ support
2. RSI reversal
Buy above 3900 Sl 3600 target 4000-4200-4400-4500
it is just a view, please trade at your own risk.

LTIM — Corrective Rally Exhaustion, 3-Wave Decline in FocusThe advance in LTI Mindtree Ltd (LTIM) from 3,802 is interpreted as a corrective ABC structure , rather than the start of a fresh impulsive trend.
Wave A advanced to 5,554.50
Wave B corrected lower within a falling channel , ending near 4,939.50
Wave C unfolded in five waves and terminated at 6,429.50, accompanied by bearish RSI divergence , signaling momentum exhaustion
Price has now closed below the 50-DMA , indicating weakening bullish momentum. However, Wave (a) is still evolving , and its completion needs to be confirmed through price action.
A probable corrective path ahead:
Completion of Wave (a) on the downside
A Wave (b) bounce potentially initiating from the 100-DMA , if price stabilizes near that zone
Followed by a Wave (c) continuation lower , with downside risk toward the 5,555 zone
As always, price action will dictate the structure , and the wave count will be updated as the move evolves .
Disclaimer: This analysis is for educational purposes only and does not constitute investment advice. Please do your own research (DYOR) before making any trading decisions.

Resistance aheadPrice is near resistance zone.
Volumes are not strong.
RSI shows bearish divergence on weekly chart.
Thus shorts can give good risk/reward at current price

Power Grid (D): Aggressive Bullish (Guidance-Backed Breakout)(Timeframe: Daily | Scale: Linear)
The stock has staged a violent recovery from its long-term support zone of ₹250. This is not just a technical bounce; it is a Fundamental Re-rating driven by the Capex hike and strong Q3 numbers.
🚀 1. The Fundamental Catalyst (The "Why")
The technical breakout is fueled by three major factors:
> Capex Upgrade: The management raised its FY26 capital expenditure guidance to ₹32,000 Crore (up from ₹28,000 Cr). Higher capex implies higher future asset capitalization, which directly boosts regulated returns (RoE).
> Q3 Earnings: The company reported an 8% YoY jump in Net Profit (₹4,185 Cr) and declared a second interim dividend of ₹3.25/share .
> Sector Tailwind: The Power sector is rallying post-Budget expectations, and Power Grid is the primary beneficiary of transmission grid expansion.
📈 2. The Chart Structure (The Double Bottom)
> The Support: The ₹251 – ₹254 level.
- Significance: The stock took support here in Feb-Mar 2025 and again in Jan 2026. This formation creates a classic "Double Bottom" on the weekly/daily charts.
📊 3. Volume & Indicators
> Volume Ignition: The 37 Million volume is an "Institutional Stamp." It confirms that "Smart Money" is entering to ride the upgraded growth guidance.
> RSI: Rising in all timeframes. The Daily RSI is about to break above 60 with such volume indicates the start of a new "Markup Phase."
Conclusion
Look out for the price action in the coming days

Tech Mahindra: Wave 3 or Trap?The recent rally in Tech Mahindra presents a clear structural dilemma that traders should pay close attention to.
From the lows near 1209 , price has staged a strong advance. If this move is indeed a third impulsive wave , then price must extend decisively higher , as any subsequent Wave 4 should not overlap the 1732 region . A sustained hold above this level would keep the impulsive bullish scenario intact.
However, failure to extend meaningfully higher raises an alternate and equally important possibility. In that case, the entire decline from the prior highs near 1807 is better interpreted as a higher-degree (A)–(B)–(C) zigzag correction . The internal structure already supports this view, with the ABC correction unfolding as a textbook 5–3–5 zigzag .
In the near term, price may still attempt marginal new highs , but with RSI already in the overbought zone , any further upside is likely to be accompanied by bearish momentum divergence , signalling potential exhaustion rather than strength.
If the higher-degree zigzag scenario confirms, the next phase would be a five-wave decline , with the risk of price eventually breaking below the lows of Wave (A) near 1209 .
Key takeaway:
This is a classic extension vs exhaustion setup. The coming price action will decide whether Tech Mahindra is building a powerful third wave — or merely disguising a larger corrective structure .
Disclaimer:
This analysis is for educational purposes only and does not constitute investment advice. Please do your own research (DYOR) before making any trading decisions.

TMPV - Elliott Wave Structure Behind a Head & ShouldersUsing Elliott Wave principles , the advance in Tata Motors Passenger Vehicles can be interpreted as a completed 5-wave impulsive move , after which price has transitioned into a corrective and distributive phase . The emergence of a Head & Shoulder formation aligns well with this wave count, reinforcing the shift in structure . With price holding below the right-shoulder resistance , the neckline remains vulnerable , keeping the broader bias corrective unless a major resistance is decisively reclaimed .
Disclaimer:
This analysis is for educational purposes only and does not constitute investment advice. Please do your own research (DYOR) before making any trading decisions.

Kitex (W): Aggressive Bullish, Political Catalyst + Tech Rev(Timeframe: Weekly | Scale: Logarithmic)
The stock has staged a V-Shape Reversal from a fresh 52-week low, forming a textbook Bullish Hammer on the weekly chart. This technical move is powered by a major political development (joining NDA), which removes significant "Political Risk" from the stock valuation.
🚀 1. The Fundamental Catalyst (The "Why")
The technical bounce is driven by a sentiment shift:
> Political Alignment (NDA Entry): The market expects that joining the ruling alliance will fast-track the company’s massive expansion plans in Telangana and reduce friction in its home state of Kerala.
> Valuation Comfort: At ₹138 (the low), the stock was trading at attractive valuations, prompting value buying in the textile sector which is seeing a revival.
📈 2. The Chart Structure (The Bear Trap)
> The Support: ₹147 the support.
- Refinement: The price momentarily broke this support to hit ₹138.20 (on Jan 21), triggering stop-losses, before skyrocketing back up. This indicates a "Bear Trap" or "Spring" formation, where smart money buys the panic selling.
> The Pattern: The Weekly Hammer has a very long lower shadow, indicating that sellers pushed price down, but buyers overwhelmed them to close the week near the high.
📊 3. Volume & Indicators
> Volume Spike: The 12.43 Million volume is an "Ignition Bar." It is significantly higher than the 10-week average.
> RSI: RSI reversing from the "Oversold" zone (below 30 on daily, rising on weekly) is a classic momentum divergence signal.
🎯 4. Future Scenarios & Key Levels
The stock has cleared the "Panic Bottom."
🐂 Bullish Targets (The Recovery):
- Target 1: ₹200. .
- Target 2: ₹295 - ₹298.
- Blue Sky: If the political tailwinds persist, a breakout above ₹324 (ATH) is possible in the long term.
🛡️ Support (The "Line in the Sand"):
- Immediate Support: ₹147 – ₹150. The previous support level is now reclaimed.
- Stop Loss: A close below ₹135 (below the Hammer's wick) would invalidate the reversal.
Conclusion
This is a High-Conviction Turnaround.
> Refinement: The "Hammer" is valid, but the Fundamental News (NDA) is what makes this a sustainable trend rather than a dead-cat bounce.
> Strategy: The reversal is confirmed. Use dips to accumulate.

Dabur India Ltd: A Double Zigzag Within DistributionThe rally into the 577 high marked the completion of a mature advance, with momentum clearly fading near the top. Since then, price action has transitioned into a corrective phase.
The decline from 577 is unfolding as a higher-degree W–X–Y correction . Within this structure, the bounce from 479.15 has been overlapping and choppy, lacking impulsive strength. Structurally, this recovery is shaping into a double zigzag , reinforcing that the move is corrective.
This is a distribution phase, not accumulation.
The market is rotating out, not building fresh long exposure.
If this interpretation holds, the entire correction from 577 is expected to complete as a W–X–Y double zigzag , effectively forming a double zigzag within a higher-degree double zigzag — a structure typically seen during extended distribution phases.
From a Fibonacci perspective, the final leg of the correction is projected to terminate near the 0.786 retracement around the 464 zone , where price, structure, and retracement align. This zone becomes the most logical area for the correction to fully mature.
Until price shows clear impulsive behavior and breaks above key resistance, rallies should be treated as corrective bounces within distribution , not trend continuation.
Disclaimer: This analysis is for educational purposes only and does not constitute investment advice. Please do your own research (DYOR) before making any trading decisions.

Leading Diagonal to Double Zigzag – Jio Financial’s Full CycleFrom the lows of ₹198.65 , the stock kicked off with a classic leading diagonal — an overlapping structure, exactly how impulsive moves often begin when sentiment is still uncertain. This marked the start of a larger impulsive advance.
Post the Wave 2 low at ₹203.10 , price surged into a powerful Wave 3 rally toward ₹338.30 . Momentum confirmed the strength of this move, with RSI overshooting well into the overbought zone , validating the impulsive nature of the advance.
The rally ended with Wave 5 topping marginally above Wave 3 , but momentum failed to confirm the new high. A clear bearish RSI divergence signaled exhaustion near the top.
Since then, price has transitioned into a W–X–Y double zigzag correction , unfolding neatly within a well-aligned descending channel . Typically, such structures resolve with an upside breakout, but markets don’t always follow the textbook.
Instead, price has broken below the channel and is now sitting exactly at the 0.618 Fibonacci retracement of the entire impulse near ₹252 .
From a momentum perspective, RSI is deeply stretched and hints at a possible relief bounce . If that bounce materializes, it is likely to be corrective in nature — potentially a retest of the broken channel — before one final leg lower.
The ideal structural path would be:
A short-term bounce to cool off RSI
Followed by a final Wave (v) decline below ₹252.25
Ideally accompanied by bullish RSI divergence or a clear bullish reversal candlestick
Such a move would complete Wave (c) of Y , thereby finishing the broader W–X–Y corrective structure . The correction is expected to terminate near the major pivot support zone between ₹236 and ₹228 , just above the 0.786 Fibonacci retracement .
For now, this remains a wait-and-watch setup .
Patience is key rather than bottom fishing . Let price action confirm strength — meaningful reversals usually come with clear signals, not guesses.
Disclaimer:
This analysis is for educational purposes only and does not constitute investment advice. Please do your own research (DYOR) before making any trading decisions.

Evaluating Trend and Momentum Alignment with EMA & RSI🔎 Intro / Overview
This idea presents an EMA + RSI Alignment Framework designed to help traders understand market conditions rather than chase price movements.
Often, traders feel they have “missed the move”.
In most cases, this happens not because of late entries, but because market context was not clearly defined beforehand.
This framework focuses on evaluating trend direction and momentum quality first, so traders can better understand when conditions were supportive, unclear, or weakening.
⸻
📔 Concept
Indicators are frequently misused when applied in isolation.
This framework assigns clear and specific roles to each tool:
• EMA defines trend bias, not support or resistance.
• RSI measures momentum quality, not overbought or oversold levels.
A market environment is considered valid only when EMA and RSI are aligned.
When alignment is missing, price movement alone is treated as low-quality information.
This shifts focus away from prediction and toward environment assessment.
⸻
📌 How to Use
The framework is applied through three structured steps:
1. Identify Trend Bias (EMA)
• Price holding above EMA → bullish environment
• Price holding below EMA → bearish environment
• Price frequently crossing EMA → unstable environment
2. Assess Momentum Quality (RSI)
• RSI holding above 40 → supportive bullish momentum
• RSI holding below 60 → supportive bearish momentum
• RSI fluctuating around 50 → momentum instability
3. Confirm Alignment
• EMA + RSI aligned → valid market environment
• EMA + RSI misaligned → low-quality environment
This framework is used strictly for evaluation and learning, not execution.
⸻
📊 Chart Explanation
• Bullish Alignment Zone
Price holds above EMA while RSI confirms stable bullish momentum.
• No Alignment Zone
EMA flattens and RSI becomes unstable, indicating a low-quality environment.
• Bearish Alignment Zone
Price holds below EMA while RSI confirms bearish momentum.
The RSI panel is used only for confirmation, never for signal generation.
⸻
👀 Observation
Many traders feel they missed a move only after alignment has already occurred.
This framework helps visualize:
• When alignment was present
• When conditions became unclear
• When momentum weakened
Understanding this sequence helps traders learn from price behavior instead of reacting emotionally to it.
⸻
❗ Why It Matters?
Market movement alone does not equal opportunity.
By learning to recognize alignment vs misalignment, traders can:
• Avoid chasing price after moves are over
• Stay out of choppy or unstable conditions
• Build patience and contextual awareness
Context is often the difference between consistency and frustration.
⸻
🎯 Conclusion
The EMA + RSI Alignment Framework is a context-first approach to understanding market behavior.
It does not attempt to forecast future price moves.
Instead, it explains why certain environments supported movement and why others did not.
This makes it a valuable educational tool for developing disciplined, structured market understanding.
⸻
⚠️ Disclaimer
📘 For educational purposes only.
🙅 Not SEBI registered.
❌ Not a buy/sell recommendation.
🧠 Purely a learning resource.
📊 Not financial advice.

Hindustan Zinc (D): Bullish (Throwback to Support)(Timeframe: Daily | Scale: Linear)
The stock is undergoing a classic "Throwback" or "Re-test" phase after a confirmed Rounding Bottom breakout. While the 4% drop looks scary, it is a natural reaction (profit-taking) following the "News-Based" rally from the Q3 earnings.
🚀 1. The Fundamental Catalyst (The "Why")
The volatility is driven by two opposing forces:
> Bullish Engine (Results): HZL reported its best-ever quarterly numbers for Q3 FY26 (Net Profit ₹3,916 Cr, up 46% YoY), driven by the silver business. This fundamental floor supports the breakout.
> Bearish Trigger (Today): Silver prices, which had been vertical, saw a sharp correction in global markets today. Since HZL is now a "Silver Proxy," its stock price reacted immediately.
📈 2. The Chart Structure (Rounding Bottom Re-test)
> The Pattern: A Rounding Bottom (Jul 2024 – Jan 2026).
- Neckline: ₹654 – ₹660 . This was the ceiling for 6 months.
> The Current Move (The Throwback):
- Breakout: The stock cleared ₹660 on Jan 19/20.
- Re-test: Today's fall to ₹668 is bringing the price back to check if the "Old Ceiling" (660) can act as a "New Floor."
- Volume Warning: The 28.2 Million volume on a red candle suggests aggressive selling/profit-booking. The stock must stabilize near ₹660 quickly to absorb this supply.
📊 3. Technical Indicators
> EMAs: The Positive Crossover (PCO) remains valid. The stock is still trading well above its 20-Day EMA (approx. ₹630), so the intermediate trend is intact.
> RSI: The dip today has cooled the RSI from "Overbought" levels, which allows fresh momentum to build if support holds.
🎯 4. Future Scenarios & Key Levels
The trade is at a critical "Buy the Dip" zone.
🐂 Bullish Continuation (The Bounce):
- Trigger: Validation of support at ₹660 . Watch for a reversal candle (Hammer/Doji) here.
- Target 1: ₹716
- Target 2: ₹807 (ATH).
🛡️ Support (The "Must Hold"):
- Immediate Support: ₹654 – ₹660 . The Neckline.
- Stop Loss: A daily close below ₹640 would imply the breakout was a "Bull Trap" (Failed Breakout) and could send the stock back to ₹600.
Conclusion
This is a High-Risk, High-Reward Setup .
> Refinement: The "Fall" is likely a buying opportunity provided ₹660 holds.
> Strategy: Wait for the selling frenzy to settle.

Bajaj Finance: When Structure, Liquidity & Catalysts Line UpStructure
The rally from ₹849 to ₹1,102.50 unfolded as a clean 5-wave impulse , clearly establishing the move as directional and non-corrective .
Post the impulse high, price transitioned into a corrective phase , drifting lower within a well-defined descending channel . From an Elliott Wave perspective, the decline fits well into a W–X–Y double zigzag structure, with the current leg likely unfolding as Wave Y — suggesting a mature correction rather than trend damage.
Liquidity
Crucially, Wave Y is now approaching an unfilled gap that aligns closely with the 0.786 Fibonacci retracement of the prior impulse. This convergence marks a potential liquidity zone , where downside momentum may begin to exhaust and responsive buying interest could emerge.
This area warrants close observation for bullish reversal candlestick patterns and/or bullish divergence on RSI , which would strengthen the case for a constructive reaction from this zone.
Catalysts
Adding further context, earnings are scheduled for Feb 3rd , with the Union Budget on Feb 1st — two near-term events that could act as timing catalysts. A positive price response around this liquidity pocket could help transition the structure from corrective to impulsive, setting up a high-quality trade opportunity with a favorable reward-to-risk profile .
Risk Management
Importantly, bullish invalidation lies below ₹849 . As long as this level holds, the impulsive base remains intact, keeping risk clearly defined and asymmetric.
Conclusion
This is a high-context, high-clarity zone where structure is mature, liquidity is in focus, and catalysts are lined up . Upside confirmation from here could unlock a meaningful move, making patience and disciplined observation key.
Disclaimer: This analysis is for educational purposes only and does not constitute investment advice. Please do your own research (DYOR) before making any trading decisions.

Kalyan Jewellers: Wave Y Still at Play?Disclaimer: This analysis is for educational purposes only and does not constitute investment advice. Please do your own research (DYOR) before making any trading decisions.
Bigger Picture
Kalyan Jewellers topped near 795.40 and has been in a prolonged corrective phase. The structure since then is not impulsive but rather corrective — pointing toward a Double Combo (W–X–Y) correction.
Wave Structure Breakdown
Wave W: A clean zigzag down into 399.40 , completing the first corrective leg.
Wave X: Extended choppy consolidation into 616.00 , best interpreted as a connector.
Wave Y: Currently unfolding as an A–B–C decline . If the pattern holds, another leg lower could complete the structure.
Technical Confluence
Support Zone: 399.40 remains a major demand area , historically respected by price. If retested, it could become the potential accumulation zone .
Projected Trendline Resistance: The descending line from 795.40 to 616.00 may evolve into a key resistance barrier on the next test.
RSI: Recent bounce came from oversold territory — a technical relief rally, not yet a trend change .
Alternate Possibility
If the 442.25 low already marked the end of Wave Y, the current rally could evolve into the start of a new impulsive sequence . Confirmation requires RSI strength above midline (50) and sustained closes beyond the projected descending trendline.
Takeaway
Kalyan Jewellers is most likely unfolding a Double Combo correction (W–X–Y) with Wave Y still in progress. Traders should watch the 399.40 demand zone as a decisive level. Holding it could set up the next bullish cycle, while a breakdown risks a deeper correction toward 336.05.

CG Power: A 5% Jump Inside a Bigger CorrectionThe recent 5% move on a positive order win looks encouraging, but the price structure remains corrective . From an Elliott Wave perspective, this is not the time to chase strength .
From the ₹874.70 high , CG Power entered a complex correction . The first leg down, Wave (W) , unfolded as an ABC zigzag and ended near ₹517.75 . From there, price rallied into Wave (X) as an ABC flat (3–3–5) , topping around ₹797.55 .
Although the rise from ₹517.70 to ₹797.55 unfolded in five waves , it should not be confused with an impulse . In complex corrections, C-waves and connecting waves can subdivide into five while remaining corrective .
From ₹797.55 , price has started another ABC decline , marking Wave (Y) . Wave A and Wave B appear complete , and price is currently falling in Wave C . I am also expecting Wave (Y) to terminate below ₹517.70 before the broader correction ends.
The recent news-driven bounce does not change this structure . There are no clear bullish reversal signals yet , and jumping in on a headline move risks bottom-fishing inside an unfinished correction .
I prefer to wait for Wave (Y) to complete , ideally accompanied by weekly bullish divergence , before reassessing whether a sustainable upside move is in place.
Disclaimer: This analysis is for educational purposes only and does not constitute investment advice. Please do your own research (DYOR) before making any trading decisions.

Hindlco Ltd Cmp 934.65 Bearish Engulfing Candle @ topHindlco Ltd Cmp 934.65 dated 16-1-2026
1. Bearish Engulfing Candle @ top
2. RSI reversal
Sell below 930 SL 970 target 920-900-880-860
It is just a view, please trade at your own risk.

L&T: Wave 5 Exhaustion Signals a Corrective PhaseA clear 5-wave impulse has played out, with Wave 3 showing classic overbought RSI behavior while still respecting Elliott Wave rules.
Wave 5 ended with RSI divergence , signaling exhaustion near the highs.
Price has now slipped below the 100-DMA , reinforcing the view that the advance has likely stalled and a corrective phase is underway. The decline should unfold in at least a 3-wave structure . Importantly, Wave (a) may not be complete yet . Despite RSI reaching oversold levels, there is no decisive reversal signal so far. Any near-term bounce could turn out to be a dead-cat bounce , potentially forming Wave (b) rather than a trend reversal.
The previous accumulation zone , which also aligns with the 50% Fibonacci retracement , remains a key area to monitor. Until the corrective structure is fully resolved, bounces are best treated as counter-trend moves , not fresh longs.
Disclaimer: This analysis is for educational purposes only and does not constitute investment advice. Please do your own research (DYOR) before making any trading decisions

Policy Bazaar Cmp 1648 Hammer Candle @ SupportPolicy Bazaar Cmp 1648
1. Triple bottom @ support Line
2. Hammer Candle @ Support
2. RSI reversal
Buy above 1652 SL 1610 target 1675-1700-1725-1750
It is just a view, please trade at your own risk.
