Master Institutional Trading🎯 Introduction
Master Institutional Trading is the advanced art and science of trading the financial markets the way big institutions do — with deep capital, strategic precision, and unmatched risk management.
Unlike retail trading, which often relies on basic indicators and emotions, institutional trading follows a rule-based, data-driven, and psychology-controlled framework. Mastering this approach means stepping into the mindset and strategy of hedge funds, mutual funds, proprietary desks, and investment banks.
If you want to trade with consistency, clarity, and capital preservation, mastering institutional trading is the next step.
💡 What is Institutional Trading?
Institutional trading refers to the activities of large financial entities that control significant capital and influence market movement through their trades.
Examples include:
Hedge Funds
Mutual Funds
FIIs (Foreign Institutional Investors)
DIIs (Domestic Institutional Investors)
Pension Funds
Proprietary (Prop) Trading Desks
These institutions operate based on in-depth research, order flow analysis, macroeconomic models, and advanced risk frameworks.
🧠 What Does “Master Institutional Trading” Mean?
It means gaining the skills, tools, mindset, and techniques to:
Analyze market movements through institutional logic
Identify smart money footprints
Build trades based on volume, order flow, and positioning
Manage risk with capital preservation like pros
Avoid retail traps and fakeouts set by institutions
You’re not just reacting to the market—you’re reading what the big players are doing and aligning with them.
🧩 Core Concepts in Master Institutional Trading
1. Market Structure Analysis
Understand liquidity zones, order blocks, and institutional S/R
Learn why institutions build positions over time, not all at once
2. Volume & Open Interest Analytics
Spot unusual volume spikes
Understand Open Interest traps in options
Decode what institutions are betting on
3. Smart Money Concepts
Accumulation and Distribution phases
Wyckoff Theory in modern application
Spotting manipulation and liquidity grabs
4. Advanced Risk Management
Never risk more than 1–2% per trade
Use position sizing based on volatility
Focus on capital efficiency, not revenge trading
5. Price Action + Institutional Candle Patterns
Recognize imbalance zones, breaker blocks, and engulfing traps
Use tools like VWAP, Delta Volume, and Footprint Charts
6. Trade Execution Techniques
Partial entries
Scaling in/out like funds
Managing trade lifecycle like a desk trader
🛠 Key Strategies in Master Institutional Trading
A. Liquidity Hunting
Institutions place orders where most retail SLs are placed
Then reverse price after triggering retail orders
B. Options Positioning & IV Play
Use of Straddles/Strangles for theta decay
Selling volatility pre-event, buying it post-event
C. Delta Neutral & Gamma Scalping
Market-neutral strategies hedged with futures or stocks
Designed to profit from volatility swings
D. Accumulation/Distribution Mapping
Long consolidation = institutional entry/exit
Price reacts to volume shifts more than indicator signals
🔥 Institutional Footprint Examples (Nifty/Bank Nifty)
ATM Straddle OI surge with no move in price
→ Market makers hedging aggressively = big move coming
Sudden OTM Put buying with high IV on a flat day
→ Institutions betting on downside volatility = potential crash setup
VWAP deviation rejection
→ Institutions use VWAP as a fair value; moves away from it often reverse
👨🏫 How to Master Institutional Trading?
✅ Step-by-step Learning Path:
Study Market Microstructure
Understand how orders get matched, what limit/market orders do.
Learn Option Greeks & Institutional Strategies
Especially delta, gamma, and IV crush.
Use Volume Profile, VWAP, OI data together
Build your view based on multi-layered confirmation.
Follow FIIs/DII Data Daily
Learn how they position in equities, derivatives, and sectors.
Backtest Institutional Setups
Focus on risk-reward, not just accuracy.
Use Trading Journals
Analyze what works, improve continuously.
⚠️ Common Mistakes Traders Make (That Institutions Don’t)
Chasing trades emotionally
Overtrading low-conviction setups
No journaling or review process
Relying on random indicators instead of structure
Ignoring risk-to-reward or capital management
🧘♂️ Mindset of Institutional Traders
"Protect capital first, profits will follow."
Trade like a sniper, not a machine gun.
Think in terms of probabilities, not guarantees.
Never marry your analysis; adapt to new information.
💼 Who Should Learn Master Institutional Trading?
Intermediate to advanced traders
Full-time traders or those planning to go full-time
Derivatives traders (Nifty, Bank Nifty, Options)
Students of technical analysis who want a deeper, real-world edge
🔚 Final Words
Master Institutional Trading is the next-level evolution of your trading journey. It’s about stepping away from noise and hype, and embracing how real money trades.
You don’t need a hedge fund job to trade like one—you just need the knowledge, tools, and discipline. When you think and act like an institution, you stop being prey and start playing the game with the big players.
Oscillators

Option Trading Advanced Strategies📌 Introduction: Why Go Beyond Basic Options?
Basic option strategies like buying calls or puts, or even covered calls, offer simplicity—but they don’t fully unlock the potential of options as a strategic tool.
When you enter the advanced territory, you gain the power to:
Profit in sideways markets
Neutralize directional risks
Create high-probability income
Minimize drawdowns
Take advantage of volatility shifts
Advanced strategies require you to understand multi-leg positions, greeks, risk/reward shaping, and market timing.
Let’s break it all down into clear, real-life explanations.
🧩 1. Iron Condor – Profit in Range-Bound Markets
🔍 What is it?
An Iron Condor involves selling a call spread and a put spread at the same time, expecting the stock/index to stay in a tight range.
🔧 Construction:
Sell 1 OTM Call
Buy 1 further OTM Call
Sell 1 OTM Put
Buy 1 further OTM Put
All with same expiry.
🎯 Ideal Market View:
Market is range-bound
You expect low volatility
No major event expected
💰 Max Profit:
Occurs when stock expires between the two short strikes
⚠️ Max Loss:
Happens when stock moves beyond outer strikes
✅ Why use it?
Generates monthly income
Defined risk
High probability if used smartly
⚖️ 2. Butterfly Spread – Profit from Precision
🔍 What is it?
The Butterfly Spread is a neutral strategy where the trader expects the stock to close near a specific price.
🔧 Construction (Call Butterfly):
Buy 1 ITM Call
Sell 2 ATM Calls
Buy 1 OTM Call
All with same expiry.
🎯 Ideal Market View:
You expect stock to move very little
Great for expiry day setups or low-volatility trades
💰 Max Profit:
When stock closes exactly at strike price of sold calls
⚠️ Max Loss:
When price moves significantly up or down
✅ Why use it?
Cheap entry cost
Controlled risk
Can return 200–300% with precise movement
🌀 3. Calendar Spread – Play on Time and Volatility
🔍 What is it?
A Calendar Spread profits from time decay and implied volatility expansion.
🔧 Construction:
Sell 1 Near-Term Option
Buy 1 Longer-Term Option
Same strike, same type (Call or Put)
🎯 Ideal Market View:
Expect stock to stay around strike price in short term
Expect volatility to increase
💰 Max Profit:
When the short-term option decays and stock remains near the strike
⚠️ Max Loss:
If stock makes a strong move or IV drops unexpectedly
✅ Why use it?
Good for earnings events
Plays time + volatility
Low capital strategy
💡 4. Ratio Spread – When You Want a Controlled Gamble
🔍 What is it?
A Ratio Spread involves selling more options than you buy (like buying 1 Call and selling 2 Calls). It’s directional but nuanced.
🔧 Construction (Call Ratio Spread):
Buy 1 ATM Call
Sell 2 OTM Calls
You can reverse for puts if bearish.
🎯 Ideal Market View:
Expect a mild bullish move, not a breakout
Moderate volatility
💰 Max Profit:
When stock closes near the short strike
⚠️ Max Risk:
If stock moves too much upward, losses can be unlimited (unless hedge is applied)
✅ Why use it?
High reward-to-risk if market behaves
Can be converted into a risk-free structure using debit/credit adjustments
🏹 5. Straddle and Strangle – Playing Big Moves
🔍 What is it?
Straddle and Strangle are volatility-based strategies.
Straddle = Buy Call + Buy Put at same strike
Strangle = Buy OTM Call + Buy OTM Put
🎯 Ideal Market View:
Expect a big move but unsure of direction
Perfect for events: earnings, budget, Fed announcements
💰 Max Profit:
When market makes a big move, either up or down
⚠️ Max Loss:
When market stays flat
✅ Why use it?
Useful before news or big breakout
Non-directional but aggressive
🧮 6. Delta-Neutral Trading – Profit Without Direction
🔍 What is it?
Delta-neutral trading aims to neutralize directional risk (delta = 0) using a combination of options and/or futures.
💡 Example:
Sell ATM Call + Buy underlying stock in proportion so total delta = 0
Or balance long and short options across strikes
🎯 Ideal Market View:
Expect volatility or time decay
No strong directional bias
✅ Benefits:
Income generation regardless of market direction
Hedged and flexible
🔁 7. Rolling Strategies – Actively Adjust for Profit
🔍 What is it?
Rolling means shifting an existing position to a new strike or expiry to manage risk or lock profit.
Use Cases:
Roll down puts in falling market
Roll up calls in bull trend
Roll to next expiry to extend time decay
✅ Benefits:
Dynamic control
Prevents stop-loss triggers
Protects profits in trending markets
🛑 Risk Management Tips for Advanced Traders
Always define max loss – Use spreads, not naked trades
Check IV before trading – High IV = sell premium; Low IV = buy premium
Position sizing – Never go all-in on a strategy
Use alerts and automation – Advanced strategies need fast reaction
Avoid illiquid options – Stick to Nifty, Bank Nifty, liquid stocks
Paper trade first – Test complex strategies without real money
📈 Real-Life Example – Iron Condor on Nifty
Let’s say Nifty is at 24,300 and expiry is 7 days away. You expect Nifty to stay between 24,000 and 24,600.
Trade Setup:
Sell 24,000 Put
Buy 23,800 Put
Sell 24,600 Call
Buy 24,800 Call
Net credit: ₹50–60
Max Profit: ₹50 if Nifty stays between 24K–24.6K
Max Loss: ₹150 if market breaks either side
This gives a 1:3 risk-reward with 70%–75% probability.
💬 Final Thoughts
Advanced option strategies aren’t about gambling—they’re about precision, hedging, and income generation with structure. They offer you more control than simple buying/selling.
But with more power comes more responsibility:
Know your market view
Know the structure of your strategy
Know when to adjust or exit
Once you understand how to read volatility, manage risk with Greeks, and construct defined-risk trades, options can become your most flexible and profitable tool in the market.
SMCI short term Target of 54SMCI has been correcting in a complex zig-zag correction.
It has completed triple Zig-Zag, correction seems over as per Wave-3 max pull back and seems to be headed towards 54 in short time, provided some conditions are met.
Conditions:
a) Correction should stop at around this level or can go max till ~38.23, what it means is, price damage should stop, we may still correct in horizontal way not breaking price of approx 38.23.
b) We need fast re-tracement of price towards ~44.40
If above is satisfied, entry at 44.40 for a target of 54 is a good probabilistic trade.
When set up gets invalid ?
When price breaks and closes below 38.23 on 4hr closing candle basis.
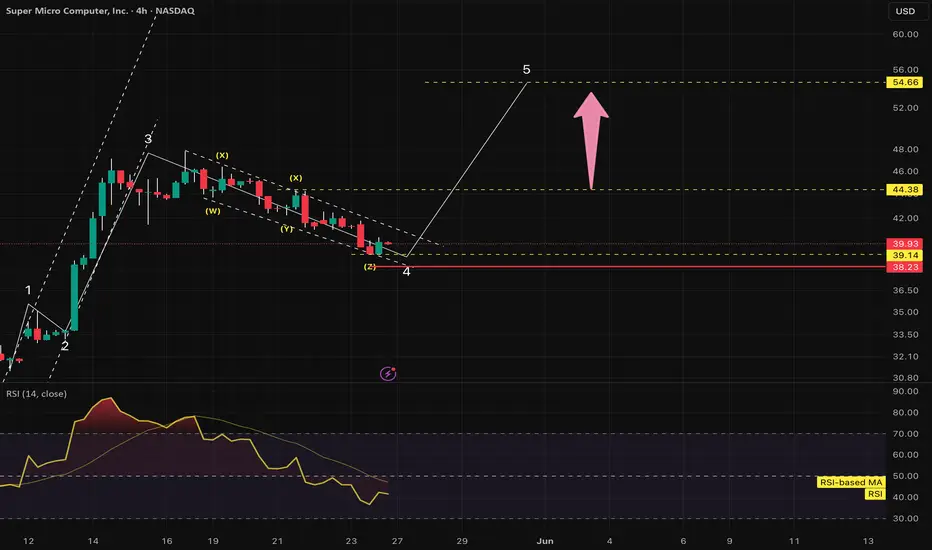
What else you need, RSI divergence + 44 ma support + PatternGood to take for a swing trade,
What you people think?
Rsi convegense shows uptrend with good support and pattern. target 7-8 percent.
Buy on Dips Narayana Hrudayalaya NSE:NH has a beautiful structure on the Daily timeframe it saw Good Volumes around the marked Key Levels which were previously All-Time highs around last year it broke out today and made a new ATH after a year.
Technically above all Moving Averages and RSI and MACD show an Uptrend.
About:
NSE:NH is engaged in providing economical healthcare services. It has a network of multispecialty and super-speciality hospitals spread across multiple locations.
Trade Setup:
Could be a good Positional Trade with Buy on Dips Approach May Retest the Breakout Zones again
Target(Take Profit):
Around 1806 Levels
Stop Loss:
Entry Candle Low or The Key Levels Marked.
📌Thank you for exploring my idea! I hope you found it valuable.
🙏FLLOW for more
👍BOOST if useful
✍️COMMENT Below your views.
Meanwhile, check out my other stock ideas on the right side until this trade is activated. I would love your feedback.
Disclaimer: "I am not SEBI REGISTERED RESEARCH ANALYST AND INVESTMENT ADVISER."
This analysis is intended solely for informational and educational purposes only and should not be interpreted as financial advice. It is advisable to consult a qualified financial advisor or conduct thorough research before making investment decisions.

CRAFTSMAN
In March 2025, the Weekly MACD crossed above its Trigger line.
Subsequently, price negated its lower top lower bottom formation, confirming bullishness.
If the price is to follow its past behavior, we could a resumption of long term up-move to test 10500.
Bullish outlook would remain valid as long as price is above 4500.

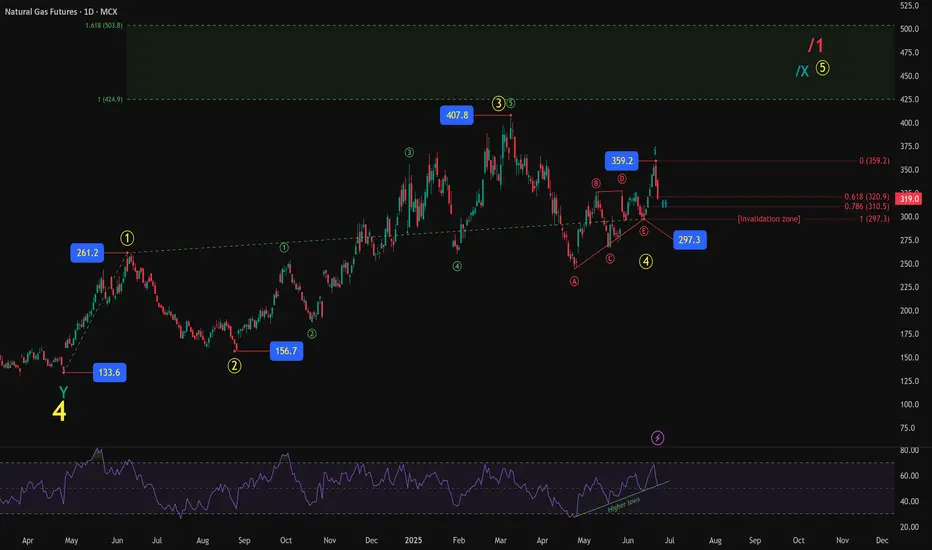
Natural Gas Futures: Triangle Breakout and New Impulse UnfoldingNatural Gas Futures (MCX) is showing an interesting Elliott Wave structure unfolding. After completing a corrective Y wave near 133.6, prices started a well-defined impulsive advance. The initial advance took shape as a 5-wave structure (yellow degree), completing wave 1 at 261.2, followed by a healthy correction into wave 2 at 156.7. The subsequent rally carved out another 5-wave pattern (green degree), pushing prices toward 407.8, marking a likely completion of wave 3.
The corrective wave 4 unfolded as a typical contracting triangle (ABCDE), finding support around 297.3. This triangle structure respected the Elliott guidelines quite well and indicates a potential setup for the next impulsive leg higher.
Post-triangle, the initial move up to 359.2 can be counted as wave i of the next larger impulse. The ongoing retracement has pulled back close to 61.8%–78.6% Fibonacci levels, a common zone for wave ii corrections. The RSI continues to print higher lows, supporting the underlying bullish sequence.
The invalidation zone is clearly marked around 297.3. As long as price remains above this level, the possibility of an ongoing bullish impulse remains valid, with eventual targets extending much higher toward the 1.618 projection zone near 503.
This remains a developing wave count, with structure still unfolding. Monitoring how price reacts around current levels will provide further clues whether the larger bullish sequence resumes or deeper correction emerges.
Disclaimer:
This analysis is for educational purposes only and does not constitute investment advice. Please do your own research (DYOR) before making any trading decisions.
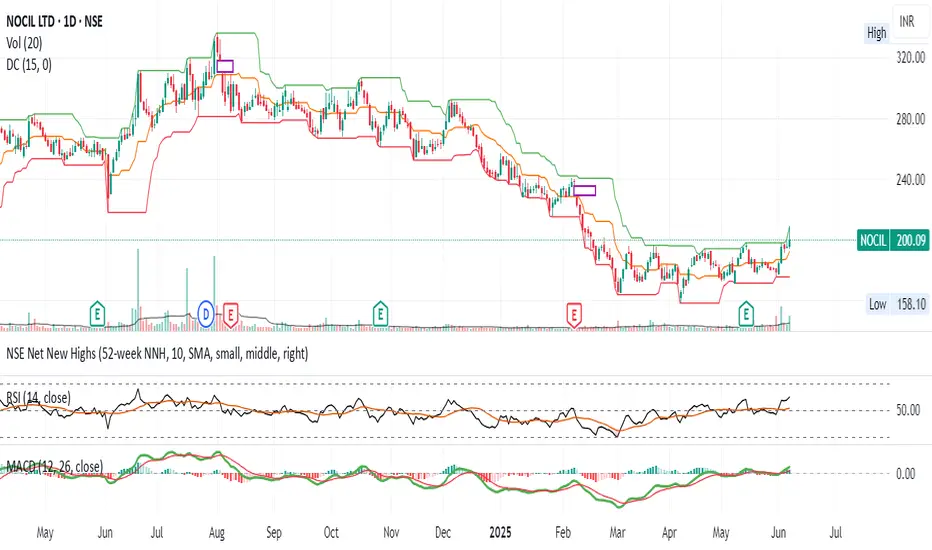
NOCIL - target @ 235-300 and aboveNOCIL, trading @ 200 on NSE/BSE
it may reach firstly @ 235, where it had formed a gap when it was falling downwards. 235 may act as a strong resistance as it traded around this level in FEB 2025.
it may also scale towards 300 plus levels since high volume buying candle is formed on 31 july 2024 around 320 levels , note that buying volume is considered a major signal for upside move.
factors supporting the same :
1- around 185-195, it has formed major buying volume candles (DAILY TIMEFRAME) which suggests follow-up upmove may continue
2- 198 which was acting as resistance SINCE MARCH 2025 is broken successfully , making highs @ 208, and closing at 200
3- technical indicators are also supporting the same analysis as RSI is at 64, trading above its own moving avg . MACD is trading above zero level and above signal line
4- price is trading at the upper range of the 15 day donchian channel , suggesting range breakout.
buying is suggested between 185-205 levels , keeping stoploss @ 175 for targets of 235 and may be 300 if markets sustain upward strength for coming months.
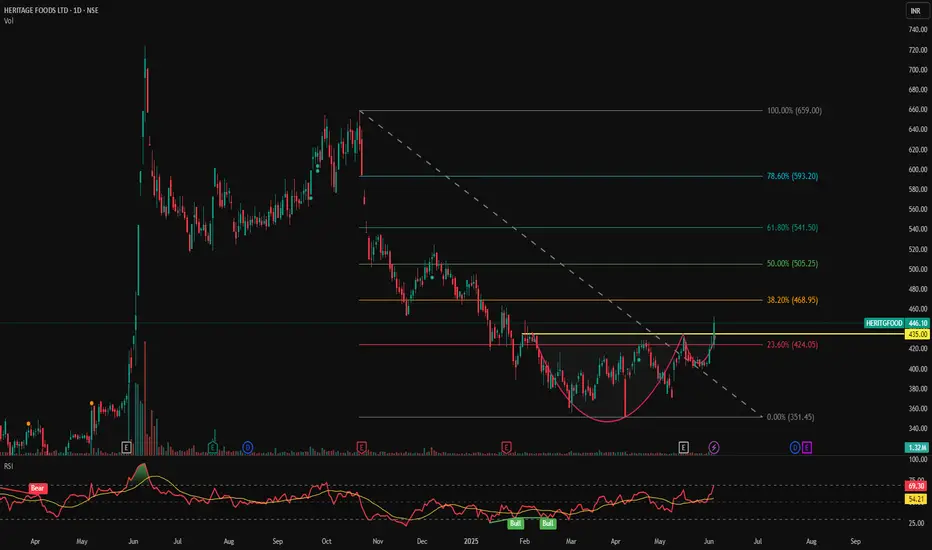
HERITGFOOD - Cup & Handle Breakout with RSI Confirmation | Daily📊 HERITAGE FOODS LTD (HERITGFOOD) – Cup & Handle Breakout with RSI Confirmation | Daily Chart
📅 Chart Date: June 5, 2025
📈 CMP: ₹446.10 (+5.94%)
📍 Ticker: NSE:HERITGFOOD
🔍 Technical Analysis Overview
☕ Cup & Handle Pattern Breakout
HERITGFOOD has successfully broken out of a Cup & Handle pattern, signaling the end of a long downtrend and a potential start of a new bullish wave. The breakout zone lies around ₹435–₹440.
💥 Breakout Volume: Supported by a strong surge in volume (~1.32M), adding conviction to the breakout.
📉 RSI Indicator:
RSI is at 69.30, just below overbought territory, indicating strong momentum.
RSI crossover above signal line confirms bullish strength.
📍 Key Price Levels
✅ Breakout Zone: ₹435–₹440
🚀 Upside Targets (based on pattern projection and past resistance):
₹470 – minor resistance
₹510 – medium-term swing target
₹550+ – extended target if momentum sustains
🛡️ Support Levels:
₹435 – breakout retest zone
₹415 – minor base
₹390 – handle bottom (critical invalidation)
🔻 Stop Loss Zone: Below ₹415–₹420 for risk-managed swing positions
🛠️ Trading Strategy
Entry: After confirmation candle above ₹440 or on pullback to retest breakout zone
Stop Loss: Below ₹415
Targets: ₹470 → ₹510 → ₹550+
Risk/Reward: Attractive R:R setup with confirmation indicators
⚠️ Disclaimer
This chart is for educational and analysis purposes only. Please consult a SEBI-registered financial advisor before taking any trading decision.
Bitcoin (BTC) Technical Analysis for the Week of Jue 02 -June 09Technical Analysis
Price Action: Bitcoin is consolidating around $105,000–$108,000 after a sharp rally from April lows (~$74,000) and a peak near $112,000. A recent 3% correction was driven by profit-taking, with BTC stabilising near $106,000.
Trend: Medium-term trend remains bullish, but momentum is slowing. BTC has broken the previous resistance , indicating a potential slower rise or horizontal movement.
Note : Indicator MACD making bearish diversions in my view its not strong .
Key Levels:
Support: ~$102,600–$103,500 (recently tested)
Resistance: ~$106,000 (current resistance) and $110,500–$123,000 (next major target).
-- Disclaimer --
This analysis is based on recent technical data and market sentiment from web sources. It is for informational purposes only and not financial advice. Trading involves high risks, and past performance does not guarantee future results. Always conduct your own research or consult a SEBI-registered advisor before trading.
#Boost and comment will be highly appreciated

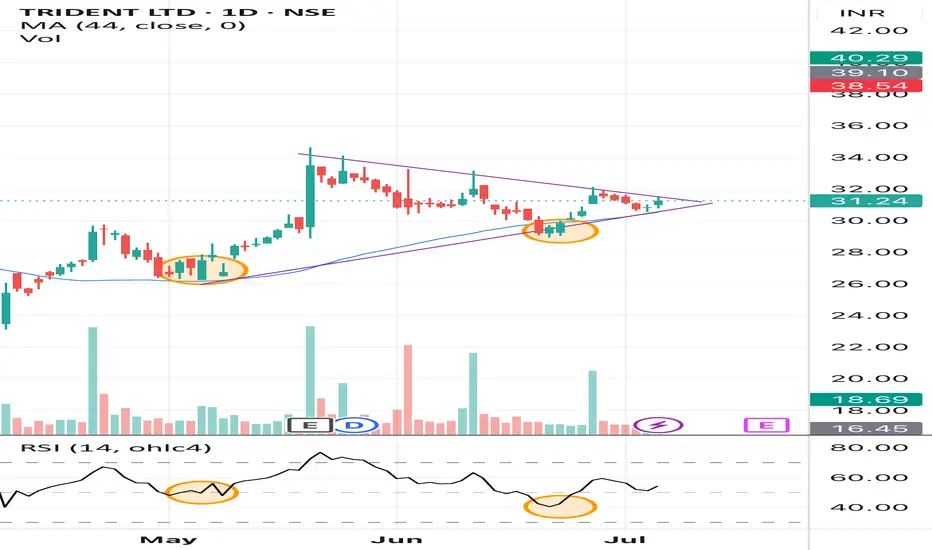
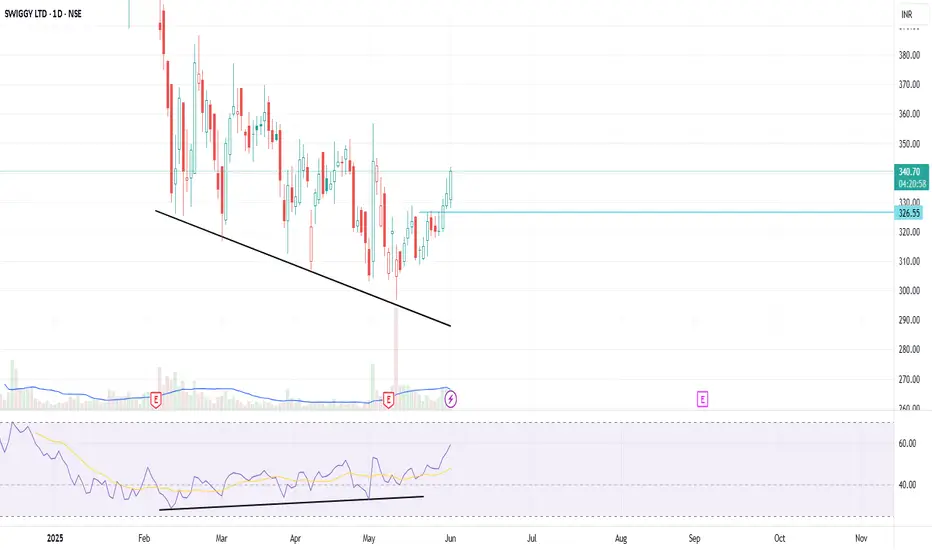
RSI Divergence on Swiggy Daily Time frameRSI divergence marked on above chart in daily time frame.
Entry price: 326
Currently price is on 340 , which is 4% above the entry level.
TG : 10 %
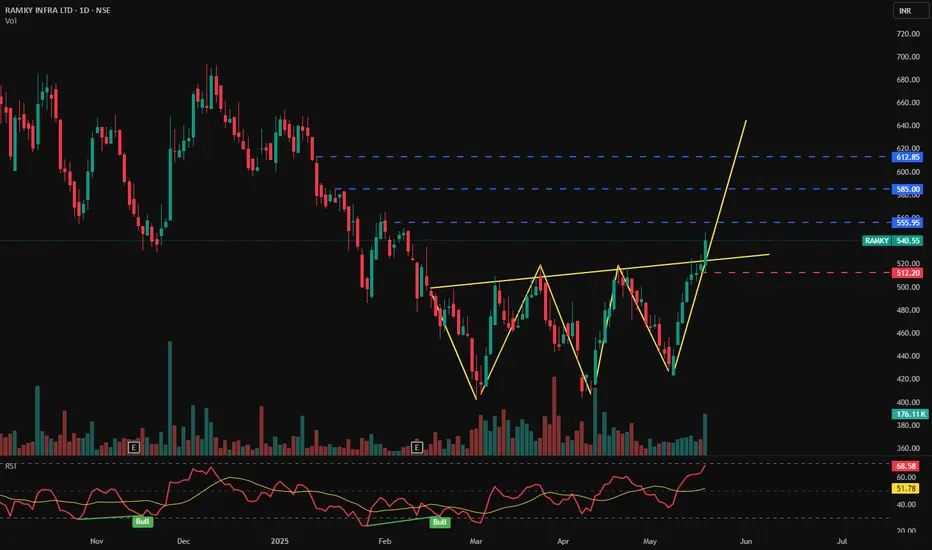
RAMKY INFRA LTD - Bullish Pattern📊 RAMKY INFRA LTD (1D) – CMP ₹540.55
📅 Date: May 21, 2025
📈 Exchange: NSE
📌 Ticker: RAMKY
🧠 Technical Analysis Overview
✅ Bullish Inverse Head & Shoulders Pattern:
Price has broken out of a clearly formed inverse head and shoulders pattern — a powerful trend reversal structure — indicating a strong bullish sentiment and possible long-term uptrend.
✅ Breakout Confirmation:
A sharp breakout above the neckline near ₹512 has occurred with strong bullish momentum and increased volume.
✅ RSI Indicator – 📈
RSI is at 68.58, approaching overbought levels but not showing divergence yet, confirming continued bullish strength. The RSI trend also shows recent bullish crossovers.
📍 Key Price Levels
📌 Support
🟥 ₹512.20 – Neckline retest level (ideal re-entry zone)
📌 Resistance (Targets)
🔵 ₹555.95 – Immediate target
🔵 ₹585.00 – Mid-term resistance
🔵 ₹612.85 – Major resistance / final target from pattern projection
💬 Potential Strategy
Breakout Entry already active above neckline
Pullback Entry possible near ₹512–₹520
SL below ₹512
Target 1: ₹555
Target 2: ₹585
Target 3: ₹612+
📌 Conclusion
RAMKY INFRA is breaking out of a strong inverse head and shoulders pattern with bullish volume and RSI confirmation. Watch for a potential retest near ₹512 for a high-probability entry. Targets lie ahead at ₹555, ₹585, and ₹612.
🛑 Disclaimer:
This analysis is for educational purposes only. Not investment advice. Always DYOR or consult your financial advisor.
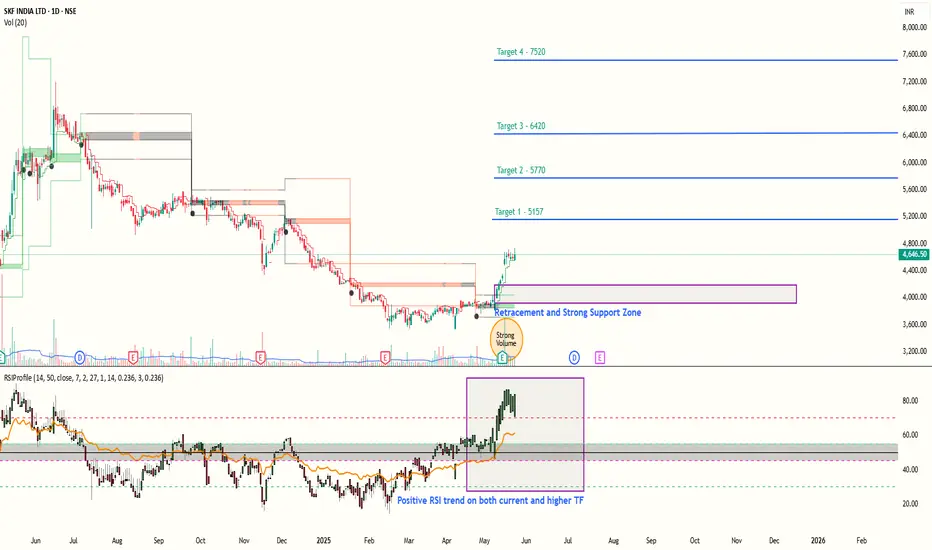
SKF Great Bullish PotentialSKF has been showing continous Bullish RSI trend in the daily chart. And fundamentals also exhibit strength, with the company being debt free, Good cashflow, Positive earnings and Rising EPS.
It has a very strong support zone in 3900-4200 price range, where big institutional and responsive buyers are present.
Big volume on chart indicate entry of initiative buyers after the price testes lows for some time and was effectively bought by responsive buyers.
RSI Profile shows - A Clear bullish trend.
We expect the price to continue rising in the coming weeks with the following targets
Targets :-
1) 5157
2) 5770
3) 6420
4)7520
Lodha - Taking rejection at the trendlineTaking rejection at declining trendline on daily timeframe. Bearing engulfing is seen. SL could be just above the trendline.

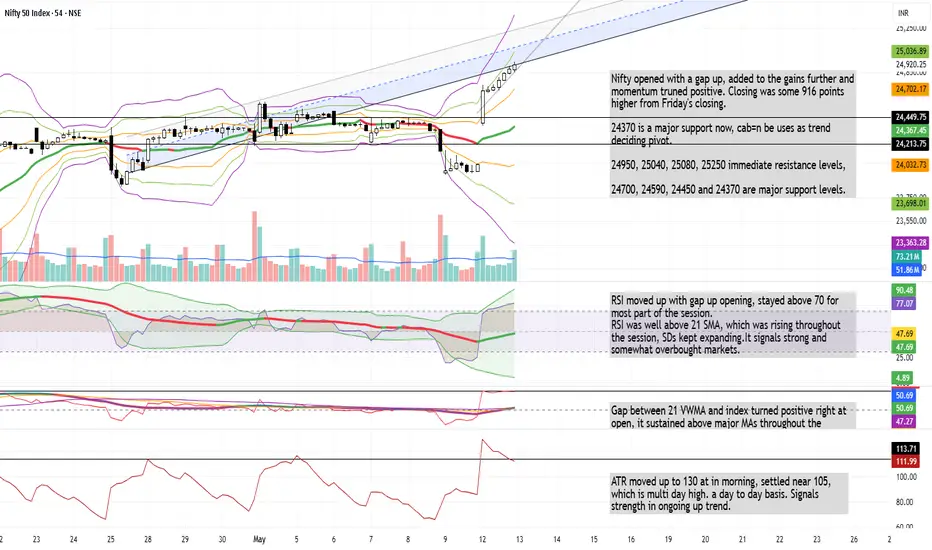
Nifty momentum turned positive with strong closing.Nifty opened with a gap up, added to the gains further and momentum truned positive. Closing was some 916 points higher from Friday's closing.
24370 is a major support now, cab=n be uses as trend deciding pivot.
24950, 25040, 25080, 25250 immediate resistance levels,
24700, 24590, 24450 and 24370 are major support levels.
Pls refer to chart text for reading on indicators.
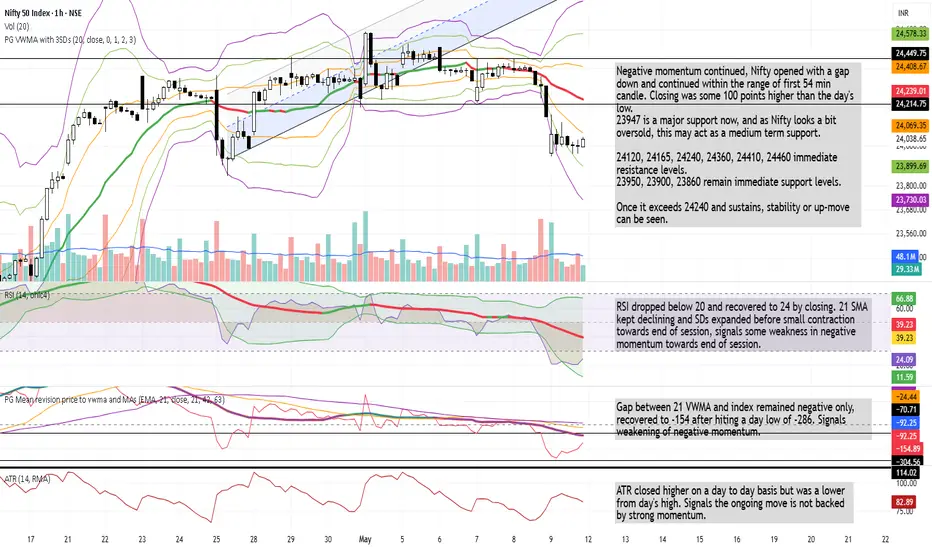
Nifty -Some recovery was seen in momentum towards end of sessionNegative momentum continued, Nifty opened with a gap down and continued within the range of first 54 min candle. Closing was some 100 points higher than the day's low.
23947 is a major support now, and as Nifty looks a bit oversold, this may act as a medium term support.
24120, 24165, 24240, 24360, 24410, 24460 immediate resistance levels.
23950, 23900, 23860 remain immediate support levels.
Once it exceeds 24240 and sustains, stability or up-move can be seen.
Refer to the charts text for detailed reading of Indicators.
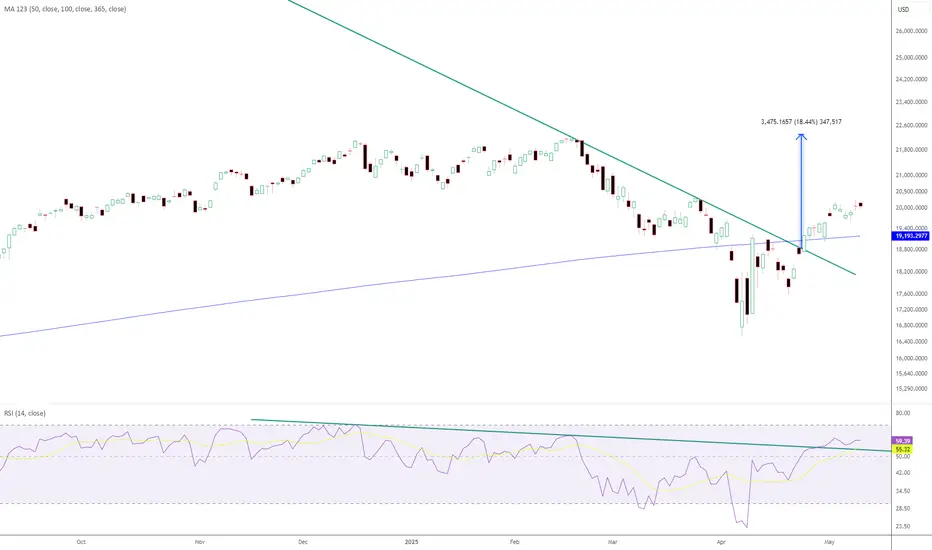
Nasdaq Index set for new all time highsNasdaq has broken out from the downward slopping trendline that defined it's recent correction. Recently the RSI indicator also broke above it's trendline
It's highly likely that the worst is over for the index and we are headed back to new all time highs
NIFTY daily Retrace 61% from bottomHello everyone,
Nifty spot 24340 consolidating since 2 weeks within range of 24000 to 24500 rsi negative divergnve is there on daily time aong with fibbonacci 61% retrace from bottom volume is not supporting bullish breakout away from 200 ema can expect bearish move till 23500 trendline support.

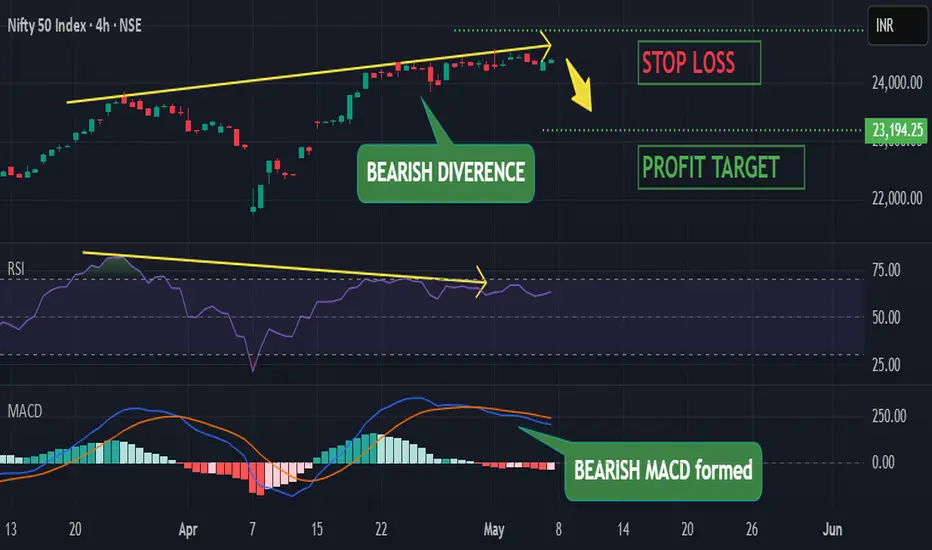
NIFTY : Very bearish due to forming Bearish Divergence pattern
BEARISH DIVERGENCE -
Market has formed a higher high on the chart whereas rsi has formed a lower high which indicates a bearish divergence pattern. This indicates upcoming market fall
Bearish Divergence forms when market forms higher high & rsi forms lower high
BEARISH MACD -
The macd line recently crossed below the signal line inside the macd indicator forming bearish macd crossover. Market is likely to fall in the upcoming days due to this bearish signal
MACD indicator is the combination of 2 lines - macd line is the difference between 26-period & 12-peroid EMA & signal line is the 9-period EMA of macd line
INVERTED HAMMER CANDLESTICK -
On daily timeframe NSE:NIFTY has formed a bearish candlestick pattern called "Inverted Hammer". it indicates reversal of the ongoing trend and beginning of the opposite trend ie bearish trend here.
Inverted Hammer candlestick is formed when a candlestick has long upper shadow & smaller body at the bottom
PROFIT TARGET -
target is 23194.25
STOP LOSS -
24908.05
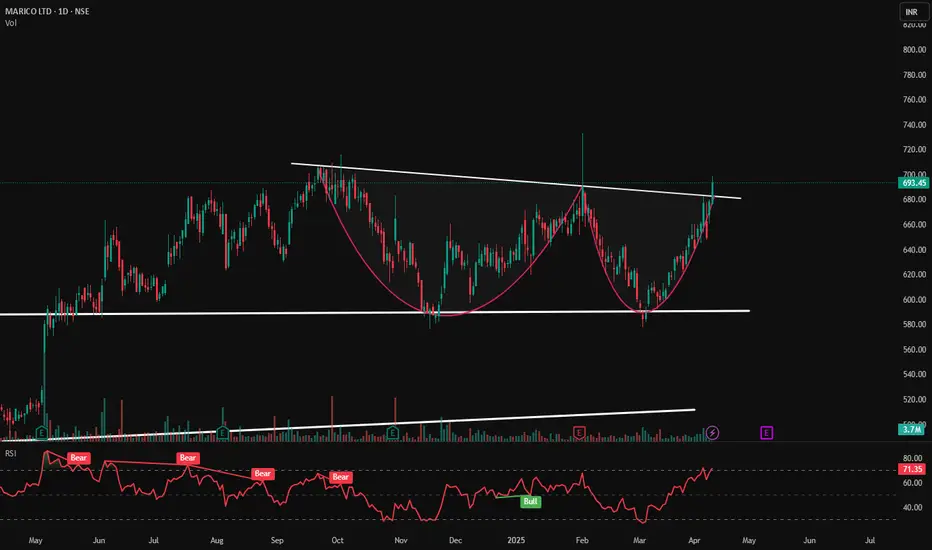
Marico Ltd- Cup & Handle Breakout Forming?Marico Ltd.—Cup & Handle Breakout Forming? ☕️📈
📆 Date: April 10, 2025
📊 Chart Analysis:
Marico is showing a classic "cup & handle" pattern, a bullish continuation setup. The price has successfully broken above the neckline resistance, indicating a potential for upward continuation if volume sustains.
📌 Key Levels:
🛑 Resistance (neckline—now flipped to support): ₹685
✅ Support (Base of Cup): ₹580
🔼 Immediate Resistance Targets: ₹710 ➡️ ₹735 ➡️ ₹765
📈 Indicators & Technicals:
☕ Cup & Handle Pattern clearly visible with a rounded bottom and breakout above resistance.
🔍 RSI at 71.35 shows bullish momentum but is slightly overbought —a sign of strength with caution.
💹 Volume steadily increasing — confirms accumulation phase and breakout intent.
🟥 Multiple "Bear" RSI icons (prior weakness) followed by a ✅ "Bull" label hinting at a momentum shift.
📉 Bearish divergence in RSI is now getting invalidated by price strength and pattern breakout.
🧠 Trade Plan:
📌 Entry near ₹685–₹695 breakout zone
🎯 Targets: ₹710 ➡️ ₹735 ➡️ ₹765
❌ SL: ₹670 (below neckline)
📌 Disclaimer: For educational purposes only. Do your own research or consult with a SEBI-registered advisor before trading or investing
Reliance - Price action channel + Candlestick + RSIKey Observations from the Chart
Channel Structure -
Both resistance and support lines have been tested multiple times with precise reactions
The most recent price action shows a strong rejection at the lower channel boundary
Candlestick Formation-
This month printed a textbook strong lower wick rejection candle:
Long lower wick indicates buyers aggressively stepping in at support
RSI Confluence-
The RSI tells a compelling complementary story:
Recently retested COVID-era levels (historic oversold territory)
Has since established higher highs and higher lows (bullish structure)
Shows positive divergence with price (RSI making HHs while price tests support)

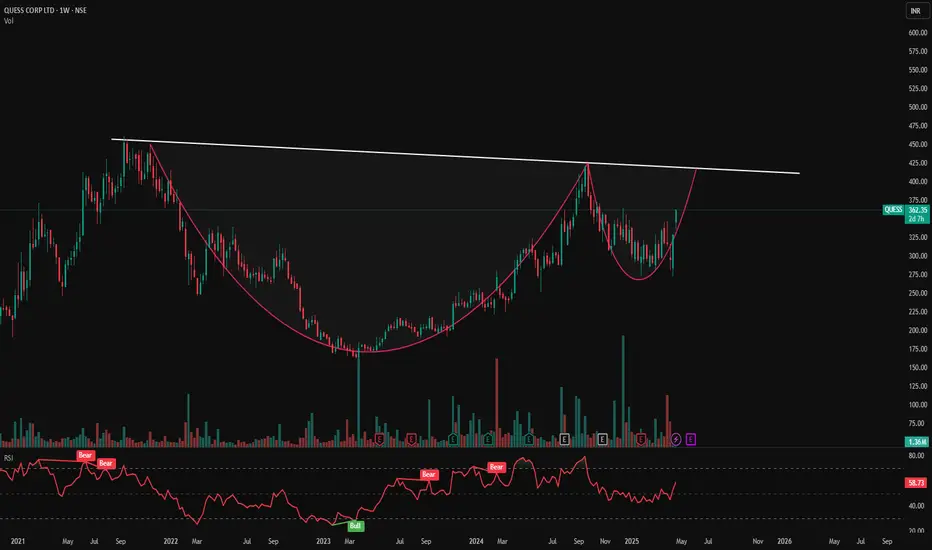
QUESS CORP LTD- Weekly Chart Analysis📊 QUESS CORP LTD – Weekly Chart Analysis
🕰️ Timeframe: 1W | 📈 Pattern: Cup & Handle Formation
🔍 Chart Overview:
QUESS is exhibiting a classic multi-year Cup & Handle pattern, forming over 3 years — a powerful technical setup indicating potential bullish continuation.
Currently, price is approaching a crucial descending trendline resistance that has been respected multiple times. A breakout above this level with volume confirmation could signal a major upside.
🔑 Key Technical Highlights:
📉 Trendline Resistance: Near ₹420
🟢 Immediate Resistance Zone: ₹390–₹420
🛑 Support Zone: ₹325–₹300
🔁 Breakout Watch: Close above ₹420 (weekly) with volume = bullish confirmation
📊 Volume & Momentum:
Increasing volume on recent up moves
RSI trending upward (if included, add RSI screenshot or note over 60+)
🧠 Bias: Bullish (on breakout confirmation)
🔔 What to Watch:
🔓 Breakout above ₹420 = trigger for swing/mid-term entries
📉 Breakdown below ₹325 may invalidate pattern
⚠️ Disclaimer: This is not financial advice. Chart shared for educational purposes only. Do your own research before investing.
📌 Follow for more chart setups | PriceAction_Pulse
💬 Drop your views or questions in comments!
GRSE - Chart of the Week, Breaking Trendline and Made a BaseNSE:GRSE has a beautiful structure on the Weekly Timeframe to Qualify for my Chart of the Week idea, it saw Decent Volumes this week around the marked Key Levels of 100 WSMA and also broke the trendline with RSI Trending Upwards.
About:
NSE:GRSE is a premier shipbuilding company in India under the administrative control of the Ministry of Defence, primarily catering to the shipbuilding requirements of the Indian Navy and the Indian Coast Guard.
NSE:GRSE is a diversified, profit-making and the first Shipyard in the country to export warships and deliver 100 warships to the Indian Navy and Indian Coast Guard.
Trade Setup:
Could be a good Positional Trade with the 100 WSMA Being a Major Support along with Marked Key Levels, Buy on Dips as the Entire Defense Sector is in an Uptrend and it Broke the Trendline Strongly this week.
📌Thank you for exploring my idea! I hope you found it valuable.
🙏FLLOW for more
👍BOOST if useful
✍️COMMENT Below your views.
Meanwhile, check out my other stock ideas on the right side until this trade is activated. I would love your feedback.
Disclaimer: "I am not SEBI REGISTERED RESEARCH ANALYST AND INVESTMENT ADVISER."
This analysis is intended solely for informational and educational purposes only and should not be interpreted as financial advice. It is advisable to consult a qualified financial advisor or conduct thorough research before making investment decisions.
