Oswal Agro Mills 12% upsideFollow Us and Don't miss a next Idea
The company's activities are divided between trade, real estate and investments
The company has almost no debt
Over the past 5 years, CAGR is 28.4%
In recent quarters, there has been significant growth in revenue and operating profit
Low P/E 8.4
P/B 1.1
Target Price 89
OSWALAGRO

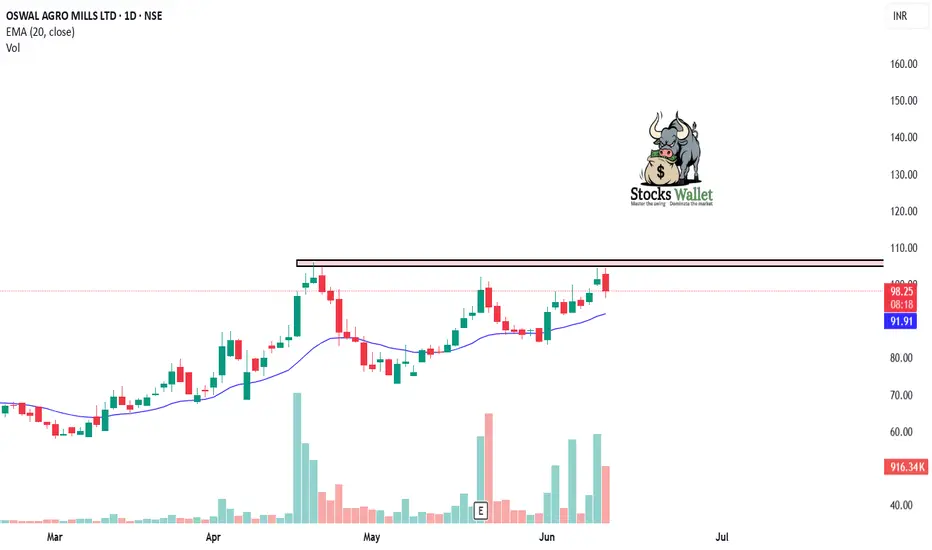
Oswal Agro – Breakout From Long-Term Consolidation Zone🌱 Oswal Agro – Breakout From Long-Term Consolidation Zone.
Chart: Oswal Agro Mills (OSWALAGRO) – Daily Timeframe
Oswal Agro has given a breakout from a long consolidation range, indicating a potential start of a new uptrend. The price action has broken above key resistance near ₹101 with strong bullish candles and increasing volume, suggesting accumulation by smart money.
🔹 Technical Highlights:
Breakout above ₹106 after nearly 3-month sideways movement
Volume spike on breakout candle – confirms strength
Price trading above 20 EMA and 50 EMA
MACD crossover shows bullish momentum
RSI above 60 and trending upward – healthy strength
📌 Trade Setup:
Entry Range: ₹106-107
Target 1: ₹125
Target 2: ₹140
Stop Loss: ₹82. (closing basis)
The breakout could lead to multi-day bullish momentum if sustained above ₹30. Watch for retests or consolidation near breakout levels for low-risk entry opportunities.
⚠️ Educational post only – trade with proper risk management and research.
OSWALAGRO - Breakout after 250+ daysDetailed View about this Breakout:
No.of Resistance: 3
No.of Support: 3
Consolidation Days: 250+ Days
I Post educational chart for 3 Swing / Potential Stocks Everyday.
Check Related Ideas section for more Swing Stock analysis.

OSWALAGRO | Ascending Triangle Breakout | Swing TradeOSWALAGRO | Ascending Triangle Breakout | Swing Trade
Chart Analysis:
1) Ascending Triangle Breakout
2) Volume Breakout

Breakout in Oswal Agro Mills...Chart is self explanatory. Levels of breakout, possible up-moves (where stock may find resistances) and support (close below which, setup will be invalidated) are clearly defined.
Disclaimer: This is for demonstration and educational purpose only. This is not buying or selling recommendations. I am not SEBI registered. Please consult your financial advisor before taking any trade.
