XAUUSD (4H) – Buy Side ViewXAUUSD (4H) – Buy Side View
Overall Bias:
The higher-timeframe trend is still bullish. The current fall looks like a healthy correction, not a full trend reversal.
📍 Strong Buy Zones
5190–5110 → Primary demand / high-probability buy zone
4990–5050 → Deep buy zone (positional / swing)
✅ Buy Confirmation Needed
4H bullish engulfing or pin bar
Clear rejection wicks from the support zone
Optional: volume expansion on bullish candles
🎯 Buy Targets
TP1: 5355
TP2: 5465
TP3: 5600+
🛑 Invalidation
A 4H close below 4990 weakens the bullish outlook
Community ideas

US Oil Has just broken out of Inverted H&S PatternTVC:USOIL has broken the neckline at $62 on a daily chart and, along with other commodities, is ready to climb to $70 levels in the coming weeks.
We keep $58 is the hard stop if the price recedes below the neckline.
Historically, rallies in Gold, Silver, and Crude Oil go hand in hand, though this time Oil started late.

NIFTY (30-01-2026)Please note this levels are for intraday trading only.
Soch Samajh ke 🐉
Technical Analysis of Nifty
[This is for educational purposes only

TECH MAHINDRA (1W) – Approaching Major Resistance Zone 🟢 Simple Chart Explanation:
• TECHM is moving in a clear long-term uptrend
• Price is consistently respecting the rising trendline (green line)
• Higher highs & higher lows show buyers are in control
• Currently, price is near a strong weekly resistance zone
📌 Important Levels to Watch:
• Major Resistance: ₹1,800–₹1,840
• Immediate Support: ₹1,650–₹1,680
• Trend Support: Rising trendline
• Invalidation: Weekly close below ₹1,600
💡 Price Action Insight:
• Strong recovery from trendline support
• Momentum is positive but price is at supply zone
• Break & hold above resistance = fresh upside potential
• Rejection from resistance = possible consolidation or pullback
📈 Bias:
• Bullish as long as trendline holds
• Watch for weekly close behavior near resistance
⸻
⚠️ Disclaimer
This analysis is only for educational purposes.
I am not a SEBI-registered investment advisor.
This is not a buy or sell recommendation.
Stock market trading & investing involve risk.
Please do your own research or consult a SEBI-registered advisor before making any decision.
⸻
❤️ If this helped, LIKE & SAVE the chart for future reference
(Weekly levels are powerful when saved 📌)

Five Star - Broke SupportFive Star :
Broke support levels , now back to where it started
Looks Weak below 430

Nifty FIIs Open Interest - Jan 29, 2026Fiis have added fresh short positions around 25350-25400, Technically, Nifty may face resistance above 25550-25600 range.

MRPL - Trendline BreakoutMRPL :
Trendline breakout possibility
Sustaining 186 levels might take this to 200

XAUUSD Bullish Flag on 15-Min – Breakout Watch Above 5560✅ NEW TRADE (BEST RIGHT NOW)
🔵 BUY ONLY ON BREAKOUT (high-probability)
📌 Condition
👉 XAUUSD 15-min candle CLOSE above 5560
(No wick-only breakout. Close matters.)
🟢 Trade
Buy Gold
🎯 Targets
T1: 5600 → 5620
T2: 5660
🛑 Stop Loss
5535 (strict)
🧠 Why this works:
Range expansion after consolidation
Momentum resumes
Option premium expands fast
🟡 Alternate trade (only if rejection)
📌 Condition
Price fails at 5560
AND breaks below 5485
🔴 Trade
Buy Put / Sell Gold
Target: 5420 → 5380
SL: 5515
⚠️ This is secondary, not preferred.
❌ No trade zone (very important)
Between 5500 – 5555
This is chop → premium decay zone
🧭 Direction bias
Above 5560 → Strong bullish continuation
Below 5485 → Deeper pullback

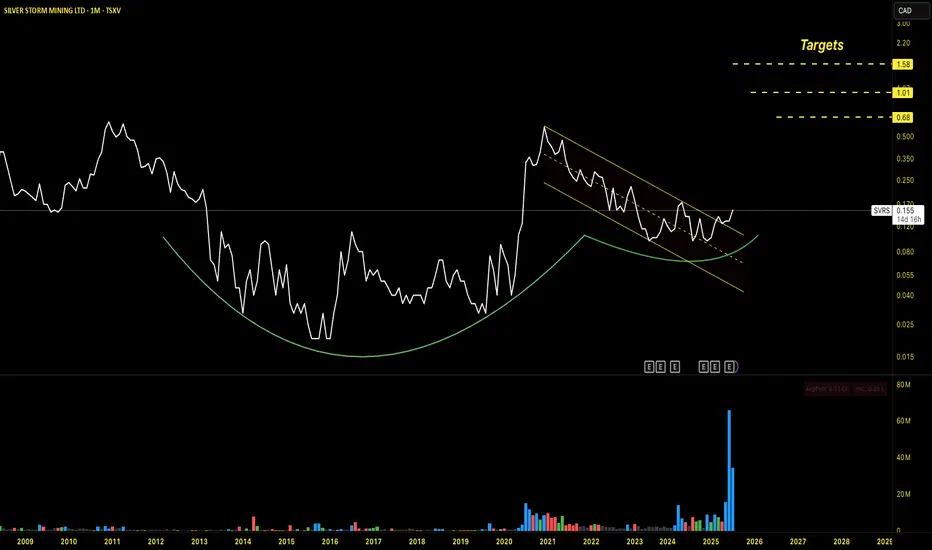
$SVRS forming a multi year cup and handle breakoutTSXV:SVRS is a compelling setup, nearly 8 years of consolidation (cup phase) followed by an impulse movement in 2020, and again 5 year long time correction handle pattern. This is a solid setup which we don't find often. What i like is the volume buildup near the handle phase, which is a clear institutional smart money surge.
I am buying here, and clearly this is not a short term trade. My downside risk is capped at 30%.
BTC 4H UpdateIf you feel like the market is holding its breath, you’re right. Bitcoin is currently trapped in a tight consolidation between $88,000 and $89,000. We’re seeing a classic "calm before the storm" as the market processes the latest Fed signals.
The Technical Blueprint:
The Bull Scenario: A clean 4H candle close above $91,195 is our "go" signal. If we flip that level, I’m looking at $95,621 as the first target, with a potential run to clear the $97,932 liquidity.
The Bear Scenario: If we lose the current local support, keep your eyes on the $86,355 level. The "safety net" demand zone sits lower at $83,786 – $84,408—if we hit that, I’m looking for aggressive buyer absorption.
The Macro View: February has historically been a power month for BTC, and with institutional "dip-buying" activity still high despite the sideways price action, we are likely just shaking out the weak hands before the real Q1 trend begins.
#Bitcoin #BTC #CryptoTrading #TechnicalAnalysis #TradingView #Web3 #FOMC

CRUDE FUTURE MCX CRUDE POSSIBLE MOVES
RESISTANCE 6270 6400
SUPPORT 5880 5690
6288 ABOVE SUSTAIN DOWN MOVE INVALIDATION
5588 BELOW SUSTAIN UP MOVE INVALIDATION
View is for study purpose only , we are not recommend any trade or investment
Always do your own analysis

GMDCLTD – Technical Update | Price Approaching Key ResistanceGMDCLTD has respected the previously identified support zone and is now trading near an important resistance area. The chart structure remains constructive, with price action showing controlled higher-high and higher-low formation.
🔍 Technical Overview:
• Major Support Zone: ₹480
Price formed a strong base near this level, which acted as a demand area and initiated the current upward move.
• Current Price: ₹618.35
• Trend Structure:
Price continues to move above an ascending trendline, indicating sustained buying interest on minor pullbacks.
• Volume Observation:
Volume expansion was visible during impulsive moves, suggesting active participation from buyers rather than weak speculative spikes.
⚠️ Key Levels to Monitor:
• Resistance Zone: ₹640
This level remains a near-term supply area.
• Continuation Scenario:
A daily close above ₹640 with strong volume would improve the probability of further upside and trend continuation.
• Consolidation Risk:
Failure to sustain above resistance may result in short-term sideways movement or a mild pullback toward the trendline.
🧭 Trade Structure:
• Support Levels:
– Rising trendline
– ₹480 (positional base)
• Bias:
Bullish above trendline, neutral to cautious near resistance until confirmation.
Focus on structure, volume, and confirmation rather than anticipation.
— Ayushi Shrivastava
NISM-Certified Research Analyst

Graphite- At a Critical Inflection Point – Breakout or Trap?Graphite India is currently trading near a multi-year decision zone, where both technical structure and long-term strategic shifts are converging. This makes the stock interesting — but also risky — at current levels.
By Ayushi Shrivastava | Market Analyst
🔹 Technical Outlook
Current Price: ~₹666
The stock is attempting to break a long-term descending trendline in place since 2018, which makes this zone structurally important.
A sustained breakout above ₹694–700, supported by strong volume expansion, could open the door for a meaningful upside move.
Recent sessions have shown above-average volume, hinting at increased participation from informed players.
⚠ False Breakout Risk:
A rejection near the ₹690–700 resistance zone or a breakout without follow-through volume could result in a bull trap and lead to range continuation or a pullback.
🔹 Fundamental Snapshot
Balance Sheet Strength: Virtually debt-free (D/E ~0.03), providing strong financial stability.
Earnings Pressure: Net profit has declined ~48% YoY due to weak global graphite electrode pricing and macro disruptions.
Valuation: Trading at a premium P/E compared to industry averages, implying that future growth is already partially priced in.
🔹 Strategic Optionality – EV Play
The company has announced a ₹4,330 crore investment into Synthetic Graphite Anode Materials (SGAM) for lithium-ion batteries.
This marks a strategic shift beyond cyclical steel demand into the EV value chain.
While the opportunity is large, execution and commercialization risks remain, and revenue visibility is medium-to-long term.
🔹 Smart Money Signals
FII holding has increased from ~4.27% to ~6.43%, even as retail participation softened.
This often reflects long-term positioning, not short-term momentum chasing.
🧠 Final View
Graphite India is in a transition phase — financially strong but earnings-challenged, with a promising yet execution-dependent EV strategy.
Long-term investors: Can track the EV project progress and accumulation patterns.
Short-term traders: Should wait for a clear breakout and sustained close above ₹694–700 with volume to avoid false signals.
📌 This is a stock to watch closely — patience and confirmation matter more than prediction.
Disclaimer:
This analysis is for educational purposes only and does not constitute investment advice. Always manage risk and confirm setups with your own analysis.

Why Maruti Share is FallingThe reason is Simple because Hournable Prime Minister of India Cut the Import Duty on BMW and Mercerdes for the benefit of #Poor People of India, hence Maruti Sales are Hevely impacted After all this reason Maruti Share is Fall.

Duniya ka Razor Gillette
Good Positional Setup >>>>>>> Specially for Patient & conservative Traders looking for Decent RR Ratio
Stock is Following Regression Channel > shows smart recovery from Lows which acting as a strong Support Zone.
Any signs of Broader recovery will provide a decent Push to Gillette & help in upmove as per below mentioned targets🎯
for your safety & to maximize your profits >> Please strictly follow SL & TSL
CMP 8420
Add on dips till 8k
SL CLB 7300
Expected Targets
Targets
T1: 9,000
T2: 9,500
T3: 10,000
T4: 10,500
T5: 11,000
T6: 14K
Probably More
Maintain Strict TSL & SL
💡 Liked the idea?
Then don’t forget to Boost 🚀 it !
For more insights & trade ideas,
📲 Visit my profile and hit Follow
Warm regards,
Naresh G
SEBI Registered Research Analyst
💬 Comment below if you want me to analyse any stock for you 🔍

BANK NIFTY 15 MINYesterday, advance V levels were shared in advance.
Price respected the marked liquidity zones exactly as planned, confirming their importance.
As long as these levels hold, they remain key reference points for the next session.
Tomorrow’s Outlook
For the next session, watch how price behaves around the same liquidity levels.
Holding above them may support continuation, while failure could invite a deeper retracement.
These levels remain the primary reference for intraday bias.

NIFTY 15 MINNifty 15m – Levels Reaction Update
Yesterday, advance V levels were shared in advance.
Price respected the marked liquidity zones exactly as planned, confirming their importance.
As long as these levels hold, they remain key reference points for the next session.
Tomorrow’s Outlook
For the next session, watch how price behaves around the same liquidity levels.
Holding above them may support continuation, while failure could invite a deeper retracement.
These levels remain the primary reference for intraday bias.

CRUDE is approaching crucial zoneCrude is moving up near the critical 65–65.50 decision making zone.
I anticipate considerable supply there, but more upside is anticipated if the price moves beyond 65.50.
After entering, book profits at all levels of gains.

ANET | No Fireworks, Just Higher Prices to 178 target📡 Arista Networks, Inc. (ANET)
Calm Pullback, Serious Business | Bullish Continuation Setup
🧠 Let’s be honest…
Not every stock needs fireworks to make money.
Some just do the work quietly — and ANET is one of them.
After a healthy reset, Arista is back above key value and VWAP, telling us something simple but important: big money didn’t leave — it waited.
📊 What the Chart Is Saying (No Drama)
✔ Higher-timeframe uptrend still intact
✔ Pullback respected demand (no panic selling)
✔ VWAP reclaimed → acceptance, not rejection
✔ Overhead supply mostly chewed through
Translation: This is digestion, not distribution.
🎯 Trade Plan (Clean & Disciplined)
🟢 Buy Zone
$138 – $145
Where value lives, risk is defined, and emotions stay out.
🎯 Upside Targets
Target 1: $165
Target 2: $178
Stretch Target: $195 (if momentum keeps its foot on the gas)
🔴 Stop Loss
Below $128 (daily close)
If it breaks demand, we walk away — no hero trades.
⚖️ Risk–Reward Snapshot
Risk: ~8–9%
Upside potential: 20–28%
High-confidence upside: 10–14%
Not flashy. Just efficient.
🏢 Company Profile (Why Institutions Care)
Arista Networks builds high-performance networking gear that keeps modern data centers running at scale.
🧩 Core Products
Cloud networking switches
High-speed Ethernet platforms
EOS (software-driven network OS)
🤝 Customers
Hyperscale cloud providers
AI & data-center operators
Large enterprises moving serious data
If AI is the brain, ANET is part of the nervous system.
💼 Business Model in One Line
High-margin hardware + sticky software + exploding data demand
= repeat customers with deep pockets
No gimmicks. No hype cycles. Just infrastructure that has to work.
🧭 Final Take
ANET doesn’t need to scream to move higher.
As long as price holds above the $128–130 demand zone, the path of least resistance remains up. Pullbacks are opportunities, not warnings.

Applied Materials, Inc. (AMAT) — Bullish Continuation Setup🏢 Company Snapshot
Applied Materials is a global leader in semiconductor manufacturing equipment, providing critical tools used in:
Advanced logic chips
Memory (DRAM & NAND)
Foundry and AI-driven chip production
The company sits at the center of the semiconductor supply chain, benefiting from:
AI infrastructure expansion
Advanced node transitions
Long-term global chip demand
This is not a speculative name — it’s a core industry compounder.
📌 Trade Bias: BULLISH (Trend Continuation)
Applied Materials remains one of the strongest semiconductor equipment leaders, trading in a clear higher-high / higher-low structure on both the daily and weekly charts. Price is holding above key volume acceptance zones and VWAP, indicating continued institutional participation rather than late-stage distribution.
📊 Technical Overview
Strong weekly uptrend with clean structure
Price holding above prior breakout value
Volume Profile shows acceptance above previous resistance
No major overhead supply on the higher timeframe
Pullbacks remain shallow and controlled → trend strength intact
This is a buy-the-dip environment, not a chase.
🎯 Trade Plan (Swing / Positional)
✅ Buy Zone
$330 – $345
Pullback into prior value area
Near VWAP / demand zone
Best risk-to-reward area
🎯 Targets
Target 1: $380
Target 2: $405
Extended Target: $430 (trend continuation scenario)
🛑 Stop Loss
Below $300 (daily close basis)
Loss of value acceptance
Breakdown of higher-low structure
📈 Risk–Reward
Risk: ~8–10%
Upside potential: 18–25%
High-confidence upside: 12–15%
Well-aligned for institutional-style swing trades.

ABB :Supply Zone Battle or Breakout?ABB is currently the talk of the town after a 7.3% intraday surge today! The stock successfully defended support at 4650 and is now testing a critical technical junction.
Fundamentals ☛
Big Win: ABB just secured a major contract from Titagarh Rail Systems to supply propulsion and control systems for Mumbai Metro Lines 5 & 6.
Milestone: This marks ABB's strategic entry into India's 25 kV AC metro segment, significantly boosting their future revenue visibility in the urban mobility sector.
Backlog Strength: The company continues to ride on a robust order backlog (last reported at ₹9,895 Cr), providing a strong cushion against market volatility.
Technically ☛
The "Supply Wall": 5080 – 5134. This zone has historically seen selling pressure. Expect a fierce battle between bulls and bears here.
The Bearish Case: If supply overwhelms at this zone, we could see a healthy retracement back to the 4785 support level.
The Bullish Case: A clean breakout and sustain above 5133 (with volume confirmation) clears the path for a "moon mission" toward 5330.
Intraday: Keep targets tight at 1% (It's my ultimate strategy for 20 years) to account for high intraday volatility (currently ~39%).
Volume Check: Look for rising volume bars on any 15-min candle breaking the 5134 mark for a safer entry.
Sentiment: Overall sentiment is turning positive as the stock has now crossed its short-term 5-day moving average.
I am not sebi registered advisor.

BEL | HH–HL Structure | Swing Continuation Setup🏭 Business Snapshot
BEL is a Navratna PSU under the Ministry of Defence
Core business: defence electronics, radar systems, avionics, communication & EW systems
Strong presence in indigenisation and defence modernization programs
Order book visibility and government capex provide long-term earnings stability
(Business view added for context only; trade is based on technicals.)
🔍 Technical Structure
Weekly HH–HL structure intact
Range breakout above ₹420
Prior resistance turned demand zone
Price holding above VWAP & short-term EMAs
Breakout supported by volume expansion
✅ Ideal Buy Zone
₹410 – ₹420
Demand + high volume node
Retest zone of breakout
Avoid chasing strength above ₹445
🎯 Targets
Target 1: ₹480
Target 2: ₹520
(Trail stop after T1 if momentum sustains)
❌ Stop Loss / Invalidation
₹398 (Daily close)
Breakdown below demand
Structure invalid if HL fails
📐 Risk–Reward
Approx Risk: ₹15–20
Reward: ₹60–100
R:R ≈ 1:3 to 1:4
🧠 TradingView Disclaimer
This chart is shared for educational purposes only.
Levels are based on price action and market structure.
Trade only if aligned with your risk management.

XAUUSD (GOLD) | BREAKOUT VS BREAKDOWN LEVEL | 29th Jan'2026XAU/USD (Gold) Outlook | 29 Jan 2026
Gold (XAU/USD) is trading near 5513, maintaining a strong bullish structure across daily, weekly, and monthly timeframes. Price is holding well above key moving averages, indicating sustained buying momentum. As long as gold stays above the 5515–5495 support zone, the upside bias remains intact with potential continuation toward 5555–5590. A decisive break below 5495 may trigger short-term corrective pressure, but the broader trend remains positive.
Breakout & Breakdown Levels
Bullish Breakout: Above 5555 | Bearish Breakdown: Below 5495
Disclaimer: This content is for educational purposes only and not financial advice. Trading involves risk; manage your position size wisely.
